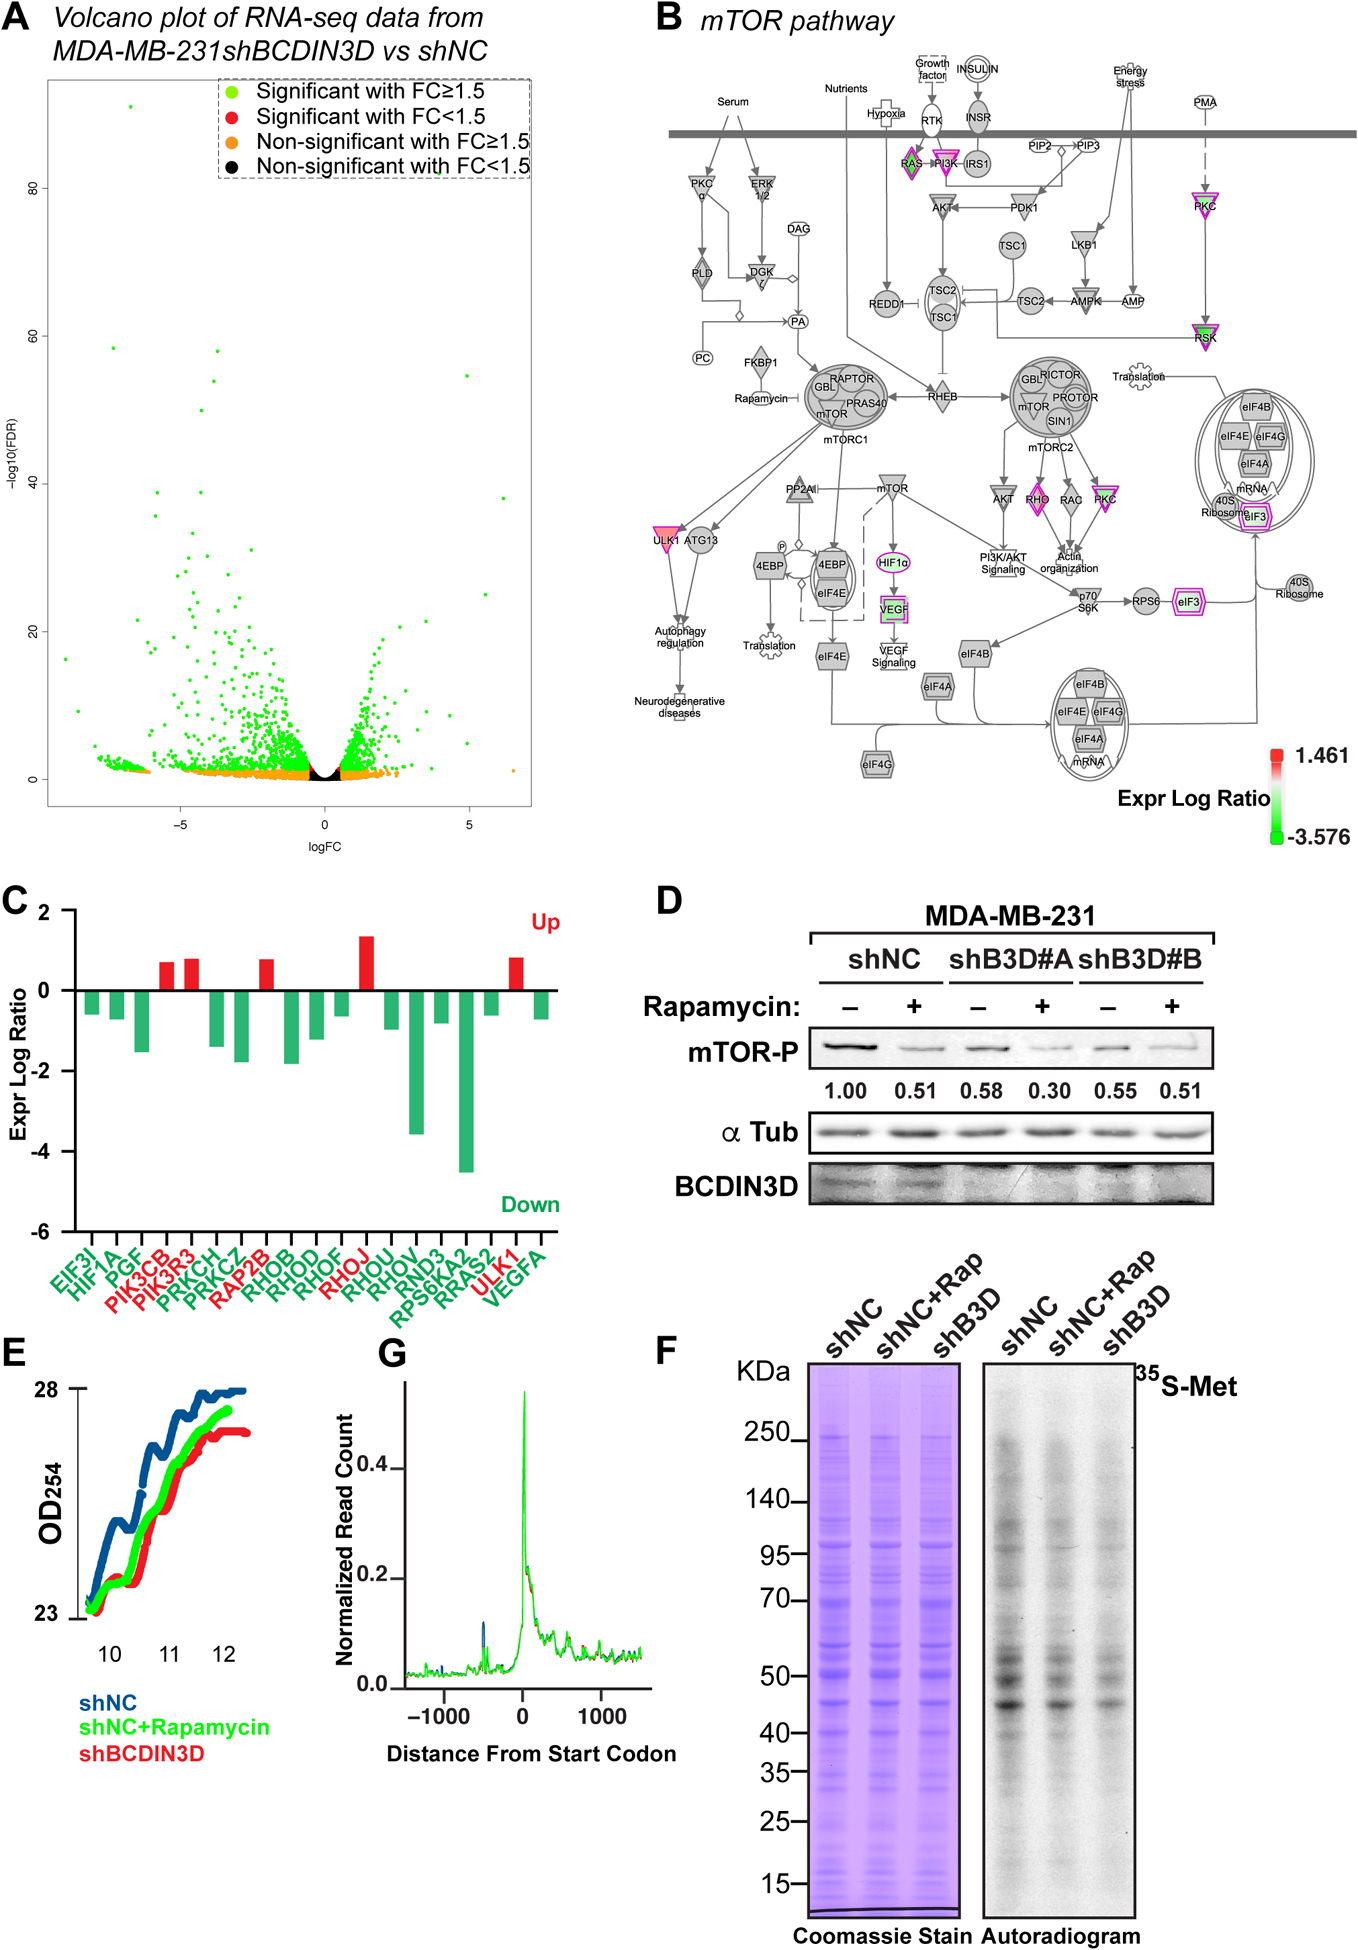
Figure 2. BCDIN3D knock-down profoundly affects gene expression in breast cancer cells.

a Volcano plot representing the fold change (FC) of normalized RNA read counts (shBCDIN3D over shNC) on the X-axis (log2) and the False Discovery Rate (FDR) on the Y-axis (log10). Green dots indicate significantly down- or up-regulated genes in shBCDIN3D over shNC with a fold change FC≥1.5 and FDR ≤ 0.05, while the other colors indicate the other combinations of FC and significance, as indicated in the legend in top right of the Volcano plot.
b Ingenuity pathway analysis (IPA) of the RNA-Seq analysis in MDA-MB-231 shNC and shBCDIN3D cells, mapping the position of protein coding genes belonging to the “mTOR pathway” that were differentially regulated in shBCDIN3D compared to shNC cells (green: downregulated; red: upregulated, see legend for exact correspondence between expression log ratio and color).
c Identity and expression log ratio of the mTOR pathway in (B).
d mTOR-phospho Ser 2448 western blot analysis of MDA-MB-231 shNC and shBCDIN3D cells untreated, or treated with 10 nM Rapamycin for 24h. shB3D#A and B represent two independent MDA-MB-231 shBCDIN3D clones. The numbers beneath the anti mTOR-P western blot corresponds to the mTOR-P signal normalized to αTubulin signal from the same western blot, and to shNC.
e Polysome lysates from MDA-MB-231 shNC, shNC+Rapamycin at 10 nM for 24h, and shBCDIN3D cells were fractionated on a 7–50% sucrose gradient. Shown here are the real time recording of OD254, starting at the monosome fraction of a representative experiment.
f Metabolic labeling of MDA-MB-231 shNC, shNC+Rapamycin at 10 nM for 24h, and shBCDIN3D cells for 30 min with Methionine, L-[35S]. The autoradiogram on the left was obtained from exposure on film of the Coomassie-stained gel on the right.
g Meta-analysis of ribosome profiling reads around the translation start site (TSS ± 1kb) of protein coding genes in MDA-MB-231 shNC, shNC+Rapamycin at 10 nM for 24h, and shBCDIN3D cells (See complete analysis in Fig. S3).
