

Abstract
The biased signaling has been extensively studied in the original mu opioid receptor (MOR-1), particularly through G protein and β-arrestin2 signaling pathways. The concept that the G protein pathway is often linked to the therapeutic effect of the drug, while the β-arrestin pathway is associated to the side effects has been proposed to develop biased analgesic compounds with limited side-effects associated with traditional opiates. The mu opioid receptor gene, OPRM1, undergoes extensive alternative pre-mRNA splicing, generating multiple splice variants or isoforms that are conserved from rodent to human. One type of the Oprm1 splice variants are the full-length 7 transmembrane (7TM) C-terminal splice variants, which have identical receptor structures including entire binding pocket, but contain a different intracellular C-terminal tail resulted from 3′ alternative splicing. Increasing evidence suggest that these full-length 7TM C-terminal variants play important roles in mu opioid pharmacology, raising questions regarding biased signaling at these multiple C-terminal variants. In the present study, we investigated the effect of different C-terminal variants on mu agonist-induced G protein coupling, β-arrestin2 recruitment, and ultimately, signaling bias. We found that mu agonists produced marked differences in G protein activation and β-arrestin2 recruitment among various C-terminal variants, leading to biased signaling at various level. Particularly, MOR-1O, an exon 7-associated variant, showed greater β-arrestin2 bias for most mu agonists than MOR-1, an exon 4-associated variant. Biased signaling of G protein-coupled receptors has been defined by evidences that different agonists can produce divergent signaling transduction pathways through a single receptor. Our findings that a single mu agonist can induce differential signaling through multiple 7TM splice variants provide a new perspective on biased signaling at least for Oprm1, which perhaps is important for our understanding of the complex mu opioid actions in vivo where all the 7TM splice variants co-exist.
Electronic supplementary material
The online version of this article (10.1007/s10571-020-00973-5) contains supplementary material, which is available to authorized users.
Keywords: Mu opioid receptor, Biased signaling, Beta-arrestin, G-protein, Splicing
Introduction
Most clinically used opioid drugs such as morphine and fentanyl act primarily through the mu opioid receptor. Extensive alternative pre-mRNA splicing of the single-copy mu opioid receptor gene (OPRM1) generates a series of splice variants or receptor isoforms, which is evolutionarily conserved from rodent to human (Pan 2005; Pasternak et al. 2020; Pasternak and Pan 2013). These splice variants have been categorized into three major types based on the predicted transmembrane domains (TM): (1) Full-length 7 TM Carboxyl (C)-terminal variants that have identical receptor structure and only differ each other at intracellular C-terminal sequences due to alternative 3′ splicing; (2) Truncated 6TM variants that lack the first TM due to alternative 5′ splicing; and (3) Truncated single TM variants that contain only the first TM due to exon skipping or insertion (Pan 2005; Pasternak et al. 2020; Pasternak and Pan 2013). In vivo studies using Oprm1 exon-specific knockout (KO) mouse models demonstrated that the truncated 6TM variants mediate the analgesic actions of a subset of mu opioids such as heroin (Pan et al. 2009) and a novel class of opioid analgesic such as 3′-iodobenzoyl-6β-naltrexamide (IBNtxA) that are potent in several pain models, particularly inflammation and neuropathic pain, and lack many side-effects associated with traditional opiates (Majumdar et al. 2011). The truncated single TM variants did not bind any opioids, but they can increase expression of the 7TM MOR-1 at the protein level through a molecular chaperone mechanism in the endoplasmic reticulum, leading to enhanced morphine analgesia (Xu et al. 2013).
Accumulating evidence supports the pharmacological importance of the full-length 7TM C-terminal variants. Several in vitro cell models demonstrate functional differences in mu agonist-induced G protein coupling, phosphorylation, internalization and post-endocytic sorting (Abbadie and Pasternak 2001; Bolan et al. 2004; Koch et al. 2001, 1998; Pan et al. 2005a; Pasternak et al. 2004; Tanowitz and Hislop 2008), as well as region- and cell-specific expression (Abbadie et al. 2000a, 2000b; Xu et al. 2015, 2014). Interestingly, two isoforms of calcium channel Cav2.2 were differentially regulated by the Oprm1 7TM C-terminal splice variants (Gandini et al. 2019). Dysregulation of the OPRM1 splice variant mRNAs has been documented in the medial prefrontal cortex of male human heroin abusers and heroin self-administering male rats (Brown et al. 2020), HIV-infected individuals (Dever et al. 2014, 2012), the spinal cord of male rats chronically treated with morphine (Verzillo et al. 2014), and multiple brain regions of morphine tolerant mouse models (Xu et al. 2015). More importantly, in vivo functions of the C-terminal tails in several morphine actions were demonstrated in gene-targeting mouse models with two inbred mouse backgrounds (Xu et al. 2017).
Biased signaling through G protein and β-arrestin2 has been extensively studied in MOR-1, the predominant mu opioid receptor of Oprm1 gene, and also proposed as a useful tool to screen or design analgesic drugs without side effects associated with traditional opiates (Grim et al. 2020). Schmid et al. showed a strong correlation between the respiratory suppression/antinociception therapeutic window in a series of compounds based on their bias for G protein signaling or β-arrestin2 recruitment (Schmid et al. 2017). However, the co-existence of multiple OPRM1 full-length 7TM C-terminal variants including MOR-1, which share the same binding pocket, raises questions regarding the role of these splice variants in biased signaling by mu agonists. In the current study, we have explored mu agonist-induced biased signaling through G protein and β-arrestin2 against a range of full-length Oprm1 splice variants to obtain a better understanding of biased signaling at multiple 7TM splice variant level.
Materials and Methods
Materials
[35S]GTPγS (1250 Ci/mmol) was purchased from PerkinElmer (Boston, MA).[125I]IBNtxA was synthesized as described previously (Majumdar et al. 2011). Opiates and opioid peptides were a generous gift from the Research Technology Branch of the National Institute on Drug Abuse Drug Supply Program (Rockville, MD).
Cell culture and Plasmid Constructs
Chinese Hamster Ovary (CHO) cells (ATCC, CCL-61) stably expressing MOR-1 or MOR-1O were described previously (Bolan et al. 2004; Pan et al. 1999). CHO cells stably expressing the full-length 7TM C-terminal variants tagged with a β-Gal ProLink™ peptide (PK) at the C-terminus were established by following the manufacturer’s protocol (Eurofins DiscoverX). All the cells were maintained in F-12 media with 10% fetal calf serum (Sigma) and Penicillin/Streptavidin and grown at 37 °C in a 5% CO2, 95% air humidified atmosphere. The media for CHO cells from Eurofins DiscoverX was also supplemented with 800 μg/ml G418 and 300 μg/ml Hygromycin. The 7TM C-terminal variant cDNAs were PCR-amplified and subcloned into a ProLink™ Expression vector with appropriate restriction enzymes. The sequences of the constructs were confirmed by Sanger DNA sequencing. The resulting constructs were transfected into a CHO cell line stably expressing a β-Arrestin2-Enzyme acceptor (EA) fusion protein. Cell lines stably expressing individual 7TM C-terminal variants were generated by selecting with 800 μg/ml G418 and screening with PathHunter® β-arrestin2 recruitment assay following the manufacturer’s instruction (Eurofins DiscoverX).
Opioid Receptor Binding Assays
[125I]IBNtxA binding were performed using membranes from CHO cells as described previously (Majumdar et al. 2011). Briefly, [125I]IBNtxA binding was carried out at 25 °C for 90 min in binding buffer containing 50 mM potassium phosphate, pH 7.4, and 5 mM magnesium sulfate. The incubation was then rapidly filtered with glass fiber filter paper pre-soaked in 0.5% polyethyleneimine and washed three times with 3 mL of ice-cold filtering buffer (50 mM Tris–HCl, pH 7.4). Bound radioactivity on the glass fiber filter was counted on a WIZARD 1470 Automatic Gamma Counter (PerkinElmer). Specific binding was defined as the difference between total binding and nonspecific binding, defined by 1 µM levallorphan. Protein concentration was determined with the Lowry method. In saturation assays, six concentrations of [125I]IBNtxA (0.01–0.5 nM) were used. KD and Bmax values were calculated by nonlinear regression analyses (Prism 8). In competition assays, 0.1–0.2 nM of [125I]IBNtxA were used against six concentrations of unlabeled drugs (0.1–10,000 nM). IC50 values were calculated by nonlinear regression analyses (Prism 8). Ki values were calculated by Ki = IC50/(1 + A/ KD), where A is the nM concentration of [125I]IBNtxA and KD value is obtained from saturation study.
[35S]GTPγS Binding Assay
60 µg of cell membrane protein were incubated in the presence of various concentrations (0.01–30 µM) of the indicated mu opioids and opioid peptides for 60 min at 30 °C in the assay buffer (50 mM Tris/HCL, pH 7.7, 3 mM MgCl2, 0.2 mM EGTA, 10 mM NaCl) containing ~ 0.05 mM [35S]GTPγS and 60 µM GDP, as described previously (Bolan et al. 2004; Pan et al. 2005a). 10 µM DAMGO was included in each dose response curve as a reference for normalization. The incubation was then filtered through glass fiber filter paper and washed three times with ice cold filtering buffer. Basal binding was assessed in the presence of GDP and absence of drug. Bound radioactivity on the glass fiber filter was extracted in 3 mL of Liquiscint scintillation fluid overnight before being counted on a Packard Tri-Carb TR-2900 liquid scintillation counter (PerkinElmer). EC50 and % stimulation values over basal level (% Emax) were calculated by nonlinear regression analysis (GraphPad Prism 8).
Eurofins DiscoverX PathHunter® Β-arrestin 2 Recruitment Assay
The PathHunter® Β-arrestin 2 recruitment assay was performed according to the manufacturer’s protocol (Eurofins DiscoverX). CHO cells stably expressing a β-arrestin2-EA and PK-tagged C-terminal variant were plated at 2500 cells/ well in a 384 well plate. After culturing for 18–20 h, the cells were treated with the indicated drugs with various concentration (0.01–30 µM) for 90 min at 37 °C and β-arrestin-2 recruitment was measured using the PathHunter® detection kit (Eurofins DiscoverX) and read for chemiluminescence on a M1000 Pro Microplate reader (Tecan). 10 µM DAMGO was included in each dose response curve as a reference for normalization. EC50 and % recruitment values over basal level (% Emax) were calculated by nonlinear regression analysis (GraphPad Prism 8).
Bias Factor Calculation
Biased factors were calculated using data of concentration response curve from [35S]GTPγS binding and β-arrestin 2 recruitment assays by the Black and Leff operational model with formula: Bias Factor = 10ΔΔlog(τ/Ka), where ΔΔlog(τ/Ka) = Δlog(τ/Ka)G-protein − Δlog(τ/Ka)β-arrestin 2, and Δlog(τ/Ka) = log(τ/Ka)ligand − log(τ/Ka)DAMGO (the reference); τ: coupling efficiency; Ka: reciprocal of the conditional affinity; (τ/Ka): transduction ratios (or transduction coefficient) (Kenakin et al. 2012; van der Westhuizen et al. 2014).
Western Blot Analysis
HEK-293 cells (ATCC, CRL-3216) stably expressing a N-terminus hemagglutinin (HA) -tagged mouse MOR-1 or MOR-1O were assessed for agonist-induced ERK1/2 phosphorylation. Cells were serum-starved at 37 °C under 5% CO2 for 30 min, treated with PBS, DAMGO, buprenorphine and fentanyl at 1 μM for 5 min and lysed on ice in lysis buffer (20 mM Tris–HCl, pH 7.5, 150 mM NaCl, 2 mM EDTA, 0.1% SDS, 1% NP-40, 0.25% deoxycholate, 1 mM of each sodium orthovanadate, phenylmethylsulfonyl fluoride and NaF, and Complete Mini, EDTA-free protease inhibitor cocktail tablet (Roche Diagnostics, Indianapolis, IN)). Protein levels of lysates were determined with the use of the detergent-compatible protein assay system (Bio-Rad Laboratories, Hercules, CA). 20 μg of proteins were mixed with SDS sample buffer containing 0.15 M dithiothreitol (DTT) and heated at 100 °C for 10 min, separated on a 10% SDS polyacrylamide gel and transferred onto PVDF membranes. The membranes were blocked in a block solution containing TTBS (10 mM Tris/HCl, pH7.4, 150 mM NaCl, and 0.05% Tween 20) and 5% nonfat dried milk at room temperature for 1 h and incubated with a rabbit anti-phospho-ERK1/2 antibody ((1:1500 dilution, Catalog #: 4370 (D13.14.4E), Cell Signaling)) or a mouse anti-total ERK1/2 antibody ((1:1000 dilution, Catalog #: 4696 (L34F12), Cell Signaling)) in block solution at 4 °C overnight. After washing with TTBS, the membranes were incubated with.
Peroxidase-conjugated mouse anti-rabbit IgG antibody (1:10,000 dilution, Catalog #: 211–032-171, Lot #: 113,621, Jackson ImmunoResearch) or goat-anti-mouse IgG antibody (1: 10,000 dilution, Catalog #: 115–035-174. Lot #: 114,091, Jackson ImmunoResearch) in TTBS buffer at room temperature for 1 h. After washing with TTBS buffer, signals were developed by using Luminata Forte Western HRP substrate (Millipore), imagined with ChemiDoc MP (Bio-Rad), and quantified using ImageLab 6.2.
Statistical Analysis
All statistical analysis was carried out using GraphPad Prism 8. A one-way ANOVA or two-way ANOVA was performed with Bonferroni’s multiple comparisons test. Data represented the means ± S.D. of indicated sample size. Statistical significance was set at p < 0.05.
Results
Mu Agonists Differentially Induce β–arrestin2 Signaling at C-terminal Splice Variants
To assess potential differences in mu agonist-induced β-arrestin2 recruitment among the 7TM C-terminal splice variants, we used the PathHunter® β-arrestin2 platform (Eglen and Singh 2003) to establish CHO cell lines stably expressing the EA-tagged β-arrestin2 and PK-tagged individual 7TM C-terminal variant. Either β-arrestin2-EA or 7TM variant-PK alone is inactive. However, association of β-arrestin2-EA with 7TM variant-PK brings EA and PK together to reconstitute β-galactosidase enzyme activity, which can be measured by the chemiluminescence at the presence of special substrate to quantitatively determine mu agonist-induced β-arrestin2 recruitment at 7TM C-terminal variants. We established the PathHunter® β-arrestin2 CHO cell lines for six 7TM C-terminal variants, including mouse MOR-1, MOR-1A, MOR-1B1, MOR-1C, MOR-1E and MOR-1O, as well as MOR-1TR, a truncated mu receptor without any C-terminal sequences encoded by alternative exons downstream exon 3 (Fig. 1).
Fig. 1.

Schematic structure of Oprm1 full-length 7TM C-terminal splice variants. The top panel is a drawing that shows structures of the mu opioid receptor encoded by exons 1–3. The transmembrane domains are indicated by cylinders. The right of the bottle panel lists the amino acid sequences encoded by alternative exons downstream of exon 3 whose composition is shown by corresponding colors on the left. The predicted phosphorylation sites are indicated by red letters. The underlined sequences in MOR-1C and MOR-1O are the phosphorylation code for high-affinity β-arrestin binding based on crystal structures of several GPCRs (Zhou et al. 2017)
To evaluate whether the PK fragment fusion at the C terminus of the 7TM variants could influence opioid binding, we performed opioid receptor binding assays using [125I]IBNtxA, a synthetic opioid that has high affinity for mu opioid receptor (Majumdar et al. 2011, 2012). Saturation studies revealed that all seven PK-tagged 7TM variants bound [125I]IBNtxA with high affinity, as indicated by their KD values in the subnanomolar range (Table 1). In parallel saturation studies, we observed that the KD values of untagged MOR-1 and MOR-1O expressed in similar CHO cells were indistinguishable from those PK-tagged partners (Table 1), indicating that the PK fragment fusion did not alter the binding affinity for [125I]IBNtxA. Competition studies showed that four mu drugs, including DAMGO, fentanyl, β-endorphin and methadone, competed [125I]IBNtxA binding against untagged or PK-tagged MOR-1 or MOR-1O with similar affinities, respectively, as indicated by their Ki values (Table 2). Although there was a small (less than twofold) but significant difference in the Ki values for fentanyl between untagged and PK-tagged MOR-1, it appeared that overall, the PK fragment fusion did not influence the binding affinity for these mu drugs.
Table 1.
Saturation studies with [125I]IBNtxA
| Variant | KD (nM) | Bmax (pmol/mg protein) |
|---|---|---|
| MOR-1 (untagged) | 0.13 ± 0.03 | 4.52 ± 0.94 |
| MOR-1-PK | 0.10 ± 0.01 | 5.79 ± 0.55 |
| MOR-1A-PK | 0.01 ± 0.01 | 3.96 ± 0.32 |
| MOR-1B1-PK | 0.12 ± 0.03 | 2.85 ± 0.31 |
| MOR-1C-PK | 0.19 ± 0.02 | 4.18 ± 0.24 |
| MOR-1E-PK | 0.08 ± 0.04 | 2.31 ± 0.61 |
| MOR-1O (untagged) | 0.20 ± 0.07 | 2.48 ± 0.34 |
| MOR-1O-PK | 0.24 ± 0.11 | 1.07 ± 0.30 |
| MOR-TR-PK | 0.10 ± 0.02 | 2.21 ± 1.02 |
[125I]IBNtxA binding was performed in membranes isolated from CHO cells stably expressing the indicated cDNA constructs. The binding parameters were established by nonlinear regression analysis (Prism 8). Results are the mean ± S.D. of at least three independent determinations. Significant difference of the KD values among the variants analyzed by one-way ANOVA was p = 0.0152. Post hoc Bonferroni’s test showed that MOR-1E-PK differed from MOR-1O-PK, p < 0.05. Significant difference of the Bmax values among the variants by one-way ANOVA was p < 0.0001. Post hoc Bonferroni’s test revealed that MOR-1A-PK differed from MOR-1O-PK (p < 0.001) and MOR-1-PK (p < 0.05), and that MOR-1B1-PK differed from MOR-1-PK (p < 0.001), and that MOR-1C-PK differed from MOR-1E-PK (p < 0.05), MOR-1O-PK (p < 0.001) and MOR-TR-PK (p < 0.05), and that MOR-1E-PK differed from MOR-1-PK (p < 0.0001) and MOR-1 (p < 0.01), and that MOR-1O-PK differed from MOR-1-PK and MOR-1 (p < 0.001), and that MOR-1-PK differed from MOR-TR and MOR-1O (p < 0.0001), and that MOR-1 differed from MOR-TR-PK (p < 0.01) and MOR-1O (p < 0.05)
Table 2.
Competition studies with [125I]IBNtxA
| Drug | Ki (nM) | |||
|---|---|---|---|---|
| MOR-1 | MOR-1-PK | MOR-1O | MOR-1O-PK | |
| DAMGO | 5.45 ± 2.67 | 3.96 ± 0.31 | 4.59 ± 4.84 | 8.46 ± 3.17 |
| Fentanyl | 4.83 ± 0.21 | 8.89 ± 2.34a | 2.86 ± 0.56 | 2.67 ± 1.16 |
| Β-endorphin | 6.22 ± 1.49 | 10.41 ± 5.81 | 13.32 ± 6.45 | 38.16 ± 22.32 |
| Methadone | 128 ± 60 | 117 ± 4.39 | 71 ± 1.16 | 57 ± 8.27 |
Competition studies against [125I]IBNtxA (0.1–0.2 nM) were performed with indicated mu agonists using six concentrations (0.1–10,000 nM) and Ki value calculation, as described in Materials and Methods. Results are the means ± SD of three independent determinations. Student t test with two-tailed analysis between untagged and PK-tagged variants was used
aCompared to MOR-1, p < 0.05
Using the established PathHunter® CHO cell lines, we examined the ability of nine mu opioids and opioid peptides to recruit β–arrestin2 at the 7TM C-terminal variants. Choosing these mu agonists is based on their wide-ranging biases on activating β-arrestin2 recruitment or G protein coupling against the original MOR-1 (Williams et al. 2013). The results revealed significant differences in in both their potency, as determined by the EC50 values, and efficacy, as indicated by % Emax among the 7TM C-terminal variants (Fig. 2 and Table 3). Comparing efficacies of an agonist among the variants may be problematic because of different levels of receptor expression, as shown in [125I]IBNtxA saturation studies. To resolve this issue, we included 10 µM DAMGO as a reference in each dose–response study and normalized all the Emax values with that of DAMGO so that the inherent biases due to differences in receptor expression level can be relatively eliminated.
Fig. 2.


Mu agonist-induced β-arrestin2 recruitment and G protein activation at Oprm1 full-length 7TM C-terminal splice variants. A PathHunter® β-arrestin2 assay (Eurofins DiscoverX) and [35S]GTPγS binding assay were performed using CHO cell lines stably expressing β-arrestin2-EA and indicated PK-tagged 7TM C-terminal variants, as described in Materials and Methods. In both PathHunter® β-arrestin2 and [35S]GTPγS binding assays, 10 µM DAMGO was included in each dose–response curve as a reference so all the Emax values were normalized with that of 10 µM DAMGO. The ED50 values and % Emax values were analyzed by non-linear regression (Prism 8) and listed on Table 3. Results are from three independent experiments
Table 3.
Mu agonist-induced G-protein activation and β-arrestin 2 recruitment among 7TM C-terminal variants
| Ligands | G-protein activation | Β-Arrestin 2 recruitment | ||
|---|---|---|---|---|
| % Emax | EC50 (nM) | % Emax | EC50 (nM) | |
| DAMGO | ||||
| MOR-1 | 101 ± 6 | 17 ± 11 | 102 ± 3 | 112 ± 32 |
| MOR-1A | 101 ± 2 | 39 ± 26 | 110 ± 6 | 190 ± 43 |
| MOR-1B1 | 101 ± 3 | 110 ± 45 | 103 ± 1 | 270 ± 88 |
| MOR-1C | 99 ± 3 | 195 ± 134 | 94 ± 4 | 355 ± 162 |
| MOR-1E | 104 ± 21 | 29 ± 7 | 104 ± 4 | 484 ± 426 |
| MOR-1O | 99 ± 1 | 157 ± 11 | 101 ± 7 | 120 ± 10 |
| MOR-TR | 100 ± 11 | 48 ± 8 | 116 ± 1 | 138 ± 13 |
| Morphine | ||||
| MOR-1 | 115 ± 12 | 25 ± 12 | 16 ± 1 | 156 ± 35 |
| MOR-1A | 90 ± 16 | 26 ± 1 | 15 ± 1 | 125 ± 4 |
| MOR-1B1 | 91 ± 10 | 100 ± 67 | 19 ± 3 | 332 ± 193 |
| MOR-1C | 92 ± 7 | 53 ± 31 | 17 ± 2 | 195 ± 27 |
| MOR-1E | 100 ± 4 | 20 ± 4 | 31 ± 4 | 327 ± 80 |
| MOR-1O | 64 ± 2 | 123 ± 42 | 31 ± 10 | 122 ± 97 |
| MOR-TR | 70 ± 13 | 41 ± 14 | 39 ± 2 | 317 ± 96 |
| β-Endorphin | ||||
| MOR-1 | 106 ± 12 | 118 ± 10 | 59 ± 11 | 343 ± 149 |
| MOR-1A | 95 ± 15 | 112 ± 56 | 49 ± 23 | 518 ± 276 |
| MOR-1B1 | 81 ± 4 | 141 ± 44 | 62 ± 1 | 622 ± 67 |
| MOR-1C | 81 ± 8 | 111 ± 14 | 39 ± 2 | 873 ± 313 |
| MOR-1E | 90 ± 9 | 23 ± 8 | 53 ± 3 | 289 ± 48 |
| MOR-1O | 82 ± 5 | 192 ± 42 | 40 ± 18 | 151 ± 57 |
| MOR-TR | 92 ± 8 | 691 ± 57 | 75 ± 9 | 450 ± 75 |
| Endomorphin-1 | ||||
| MOR-1 | 97 ± 13 | 44 ± 14 | 63 ± 9 | 121 ± 42 |
| MOR-1A | 103 ± 9 | 86 ± 40 | 111 ± 8 | 739 ± 451 |
| MOR-1B1 | 98 ± 4 | 113 ± 51 | 88 ± 8 | 119 ± 32 |
| MOR-1C | 91 ± 4 | 116 ± 47 | 72 ± 4 | 214 ± 46 |
| MOR-1E | 108 ± 15 | 42 ± 26 | 91 ± 13 | 520 ± 315 |
| MOR-1O | 83 ± 3 | 282 ± 126 | 79 ± 5 | 109 ± 35 |
| MOR-TR | 104 ± 18 | 107 ± 67 | 62 ± 8 | 83 ± 34 |
| Endomorphin-2 | ||||
| MOR-1 | 94 ± 12 | 90 ± 22 | 53 ± 8 | 189 ± 61 |
| MOR-1A | 120 ± 8 | 131 ± 34 | 90 ± 916 | 567 ± 265 |
| MOR-1B1 | 102 ± 22 | 367 ± 218 | 69 ± 5 | 339 ± 108 |
| MOR-1C | 92 ± 8 | 111 ± 38 | 46 ± 9 | 159 ± 28 |
| MOR-1E | 107 ± 6 | 101 ± 31 | 66 ± 8 | 446 ± 336 |
| MOR-1O | 61 ± 12 | 335 ± 135 | 61 ± 7 | 459 ± 137 |
| MOR-TR | 90 ± 11 | 55 ± 9 | 75 ± 8 | 71 ± 17 |
| Met-Enk-Arg-Phe | ||||
| MOR-1 | 94 ± 4 | 16 ± 9 | 60 ± 8 | 317 ± 108 |
| MOR-1A | 93 ± 7 | 13 ± 5 | 131 ± 17 | 1107 ± 58 |
| MOR-1B1 | 90 ± 6 | 33 ± 26 | 84 ± 11 | 1104 ± 318 |
| MOR-1C | 103 ± 16 | 69 ± 11 | 187 ± 54 | 974 ± 1369 |
| MOR-1E | 95 ± 9 | 8 ± 2 | 82 ± 7 | 1789 ± 1566 |
| MOR-1O | 89 ± 12 | 82 ± 27 | 53 ± 10 | 356 ± 138 |
| MOR-TR | 71 ± 1 | 73 ± 6 | 107 ± 23 | 80 ± 62 |
| Methadone | ||||
| MOR-1 | 128 ± 24 | 24 ± 20 | 58 ± 8 | 238 ± 46 |
| MOR-1A | 114 ± 5 | 27 ± 18 | 67 ± 1 | 205 ± 62 |
| MOR-1B1 | 102 ± 17 | 178 ± 84 | 98 ± 1 | 259 ± 55 |
| MOR-1C | 158 ± 34 | 438 ± 89 | 65 ± 21 | 352 ± 205 |
| MOR-1E | 110 ± 9 | 13 ± 8 | 54 ± 6 | 312 ± 118 |
| MOR-1O | 95 ± 8 | 92 ± 50 | 75 ± 3 | 80 ± 23 |
| MOR-TR | 112 ± 9 | 215 ± 17 | 75 ± 3 | 80 ± 23 |
| Fentanyl | ||||
| MOR-1 | 93 ± 21 | 22 ± 2 | 65 ± 27 | 40 ± 9 |
| MOR-1A | 123 ± 23 | 23 ± 6 | 64 ± 13 | 39 ± 13 |
| MOR-1B1 | 87 ± 6 | 129 ± 77 | 92 ± 12 | 41 ± 9 |
| MOR-1C | 89 ± 8 | 59 ± 17 | 49 ± 3 | 48 ± 8 |
| MOR-1E | 97 ± 7 | 26 ± 7 | 53 ± 4 | 79 ± 18 |
| MOR-1O | 110 ± 5 | 163 ± 41 | 83 ± 4 | 31 ± 8 |
| MOR-TR | 75 ± 11 | 135 ± 103 | 70 ± 8 | 35 ± 6 |
| Buprenorphine | ||||
| MOR-1 | 71 ± 22 | 7 ± 7 | N.S | N.S |
| MOR-1A | 67 ± 3 | 0.3 ± 0.2 | N.S | N.S |
| MOR-1B1 | 29 ± 9 | 144 ± 93 | N.S | N.S |
| MOR-1C | 16 ± 2 | 0.3 ± 0.2 | N.S | N.S |
| MOR-1E | 44 ± 5 | 2 ± 1 | N.S | N.S |
| MOR-1O | 25 ± 7 | 56 ± 36 | N.S | N.S |
| MOR-TR | 50 ± 20 | 270 ± 268 | N.S | N.S |
G protein activation and β-arrestin2 recruitment were measured by [35S]GTPγS binding and the PathHunter® β-arrestin2 recruitment assays, respectively, as described in Materials and Methods. 10 µM DAMGO was included in each dose response curve as a reference for normalization. EC50 and % recruitment values over basal level (% Emax) were calculated by nonlinear regression analysis (GraphPad Prism 8). Results are the means ± SD of three independent determinations. Significant differences of the EC50 and % Emax values analyzed by one-way ANOVA were listed on Tables S1–S4
DAMGO, a full mu agonist, showed nearly full efficacy with all the variants, while buprenorphine failed to stimulate β-arrestin-2 recruitment at any of the variants including MOR-1, as reported previously (Grinnell et al. 2016). However, several other mu agonists, including endomorphin-1, endormorphin-2, [Met5]enkephalin-Arg6,Phe7 (Met-Enk-Arg-Phe) methadone and fentanyl, demonstrated widely varying efficacies. For example, Methadone and fentanyl induced β–arrestin2 recruitment with nearly full efficacy against MOR-1B1, whereas their efficacies against MOR-1E were quite low. Similarly, endormorphin1 was fully efficacious against MOR-1A, but partially efficacious against MOR-1. Overall, morphine had lower efficacy against all the variants, consistent with the precious reports (McPherson et al. 2010; Molinari et al. 2010). However, morphine showed significantly higher efficacies in MOR-1E, MOR-1O and MOR-TK than other variants. Comparisons of agonists for a specific variant also showed wide differences in efficacy among the agonists. For example, the range-order of efficacies against MOR-1C was morphine (17%), β-endorphin (39%), endormorphin2 (46%), fentanyl (49%), methadone (65%), endormorphin1 (72%), DAMGO (94%) and Met-Enk-Arg-Phe (187%).
The potency of the agonists in β–arrestin2 recruitment also varied among the variants. For example, endormorphin1, Met-Enk-Arg-Phe, methadone and fentanyl were more potent in MOR-1O than in MOR-1E. β-endorphin was over fivefold more potent in MOR-1O than in MOR-1C, whereas DAMGO was over fourfold more potent in MOR-1 than MOR-1E. Also, Met-Enk-Arg-Phe was 5.6-fold less potent in MOR-1E than MOR-1. There was no correlation of the Emax values and the EC50 values (data not shown).
To assess the contributions of the common sequence among the variants, we generated a truncated MOR (MOR-TR) in which translation was terminated at the 3′ end of exon 3, eliminating any of the C-terminus encoded by alternative exons downstream of exon 3. This truncation had mixed effects depending upon both the agonist and the variant being compared (Fig. 2 & Table 3). For example, endomorphin-1 was a partial agonist at MOR-TR (67%) and became a full agonist at MOR-1A (111%) with additional four amino acids encoded by exon 3b, while it had similar efficacy as MOR-1 (63%) with extra 12 amino acids encoded by exon 4. On the other hand, Met-Enk-Arg-Phe was a nearly full agonist at MOR-TR (107%) and a partial agonist at MOR-1 (60%) and MOR-1O (53%).
Mu Agonists Differentially Stimulate G-protein Signaling at C-terminal Splice Variants
We next examined the ability of the same mu agonists in G protein activation with [35S]GTPγS binding assay using the same PathHunter® CHO cell lines stably expressing β-arrestin2-EA and PK-tagged 7TM C-terminal variants. To see if the PK-tag can influence mu agonist-induced G protein activation, we compared some of our [35S]GTPγS binding data using the PK-tagged variants in the current study with those from CHO cells stably expressing untagged C-terminal variants described previously (Bolan et al. 2004; Pan et al. 2005b). We observed general consistencies in both efficacy and potency between these two sets of data, suggesting that the PK-tag at the C terminus did not significantly alter the ability of the agonist in G protein activation (Table 4).
Table 4.
Comparison of [35S]GTPγS binding data from CHO cells expressing the original untagged and PK-tagged Oprm1 7TM C-terminal variants
| Morphine | Β-Endorphin | Endomorphin-1 | Endomorphin-2 | Fentanyl | ||||||
|---|---|---|---|---|---|---|---|---|---|---|
| 7TM variant | % Emax | EC50 (nM) | % Emax | EC50 (nM) | % Emax | EC50 (nM) | % Emax | EC50 (nM) | % Emax | EC50 (nM) |
| MOR-1 (untagged)a | 102 ± 9 | 23 ± 3 | 97 ± 3 | 64 ± 12 | 98 ± 14 | 26 ± 7 | 124 ± 14 | 72 ± 19 | 145 ± 28 | 16 ± 3 |
| MOR-1-PK | 115 ± 12 | 25 ± 12 | 106 ± 12 | 118 ± 10 | 97 ± 13 | 44 ± 14 | 94 ± 12 | 90 ± 22 | 93 ± 21 | 22 ± 2 |
| MOR-1A (untagged)a | 91 ± 3 | 19 ± 7 | 83 ± 5 | 111 ± 47 | 69 ± 3 | 42 ± 23 | 76 ± 5 | 97 ± 49 | 105 ± 40 | 60 ± 5 |
| MOR-1A-PK | 90 ± 16 | 26 ± 1 | 95 ± 15 | 112 ± 56 | 103 ± 9 | 86 ± 40 | 120 ± 8 | 131 ± 34 | 123 ± 23 | 23 ± 6 |
| MOR-1B1 (untagged)b | 104 ± 66 | 100 ± 65 | 69 ± 36 | 113 ± 81 | 68 ± 33 | 57 ± 40 | 90 ± 1 | 197 ± 164 | N/A | N/A |
| MOR-1B1-PK | 91 ± 10 | 100 ± 67 | 81 ± 4 | 141 ± 44 | 98 ± 4 | 113 ± 51 | 102 ± 22 | 367 ± 217 | 87 ± 6 | 129 ± 77 |
| MOR-1C (untagged)a | 75 ± 7 | 23 ± 9 | 44 ± 5 | 123 ± 33 | 68 ± 26 | 88 ± 35 | 62 ± 26 | 122 ± 80 | 86 ± 42 | 37 ± 29 |
| MOR-1C-PK | 92 ± 7 | 53 ± 31 | 81 ± 8 | 111 ± 14 | 91 ± 4 | 116 ± 48 | 92 ± 8 | 111 ± 38 | 89 ± 8 | 59 ± 17 |
| MOR-1E (untagged)a | 116 ± 7 | 41 ± 23 | 130 ± 5 | 113 ± 9 | 85 ± 16 | 80 ± 7 | 86 ± 14 | 52 ± 45 | 90 ± 5 | 37 ± 28 |
| MOR-1E-PK | 100 ± 4 | 20 ± 4 | 90 ± 9 | 23 ± 8 | 108 ± 15 | 42 ± 26 | 107 ± 6 | 101 ± 31 | 97 ± 7 | 26 ± 7 |
Again, we normalized all Emax values in each dose–response curve with the 10 µM DAMGO’s Emax value to eliminate the bias from different levels of receptor expressions. The results revealed marked differences in the ability of the agonists on stimulating [35S]GTPγS binding with both their potency (EC50 values) and efficacy (% Emax) among the variants (Fig. 2 and Table 3). For example, DAMGO was over tenfold more potent in MOR-1 than MOR-1C, while β-endorphin was over sixfold less potent in MOR-1B1 than MOR-1E. Methadone was more efficacious at MOR-1C than MOR-1O, but their potencies were opposite. Comparing the profiles between MOR-1 and MOR-1O is quite interesting. several agonists, including morphine, β-endorphin, endomorphin-2 and methadone, were far less potent and efficacious against mMOR-1O than mMOR-1. On the other hand, DAMGO, endomorphin-1, Met-Enk-Arg-Phe and fentanyl had similar efficacies at both MOR-1 and MOR-1O even though they all were much more potent at MOR-1 than MOR-1O.
There were clear differences between G protein activation and β-arrestin2 recruitment for some agonists. For example, buprenorphine-stimulated [35S]GTPγS binding at all the variants, at least partially, contrasting its failure in β-arrestin2 recruitment at any of the variants. Unlike overall lower efficacies in β-arrestin2 recruitment, morphine was fully efficacious against all the variants except for MOR-1O and MOR-TR in G protein activation. The truncated MOR (MOR-TR) also showed diverse responses to different agonists. For example, DAMGO and endomorphin-1 were full agonists at MOR-TR, while morphine, Met-Enk-Arg-Phe and fentanyl were partial agonists at MOR-TR.
Mu Agonists Induce Differential Signaling Bias at Various C-terminal Splice Variants
Using the operational model of Black and Leff (Kenakin et al. 2012; van der Westhuizen et al. 2014), we quantified ligand bias or agonist bias by comparing the relative activities of an agonist in [35S[GTPγS binding assay to those in β-arrestin2 recruitment assay for each variant and obtained bias factors for all the agonists at the various variants. This allows to mathematically determine if an agonist is G protein signaling biased or β-arrestin2 signaling biased against a specific variant. Using concentration response curves for each signaling pathway, we compared the log(τ/Ka) value of each test agonist for each pathway to the log(τ/Ka) of a reference agonist (DAMGO) for both G protein activation and β-arrestin2 recruitment. Using the same reference in both assays reduces the system bias (Kenakin and Christopoulos 2013; Kenakin et al. 2012). We were not able to quantify bias factor for buprenorphine because it only activated G-protein pathways and no any activities in β-arrestin2 recruitment.
The calculated bias factors of the drugs among the variants were illustrated in a set of heatmaps using different normalization methods. The negative (blue) values indicate β-arrestin2 bias whereas the positive bias (red) values indicate G protein bias. When normalized to DAMGO at mMOR-1 as 1 (Fig. 3a), we observed marked differences among the variants and among the agonists. The most negative bias factor was − 44.3 for fentanyl against MOR-1O, while the most positive bias factor was 24.5 for Met-Enk-Arg-Phe against MOR-1E. All the agonists were β-arrestin2 bias against MOR-1O at different levels. Similarly, all the agonist, except for Met-Enk-Arg-Phe, showed β-arrestin2 bias against MOR-1C and MOR-1B1. In addition, all the agonists, excluding methadone, were β-arrestin2 bias against MOR-TR. On the other hand, five of eight agonists displayed G protein bias against MOR-1E. MOR- TR appeared like mMOR-1O, suggesting that the additional amino acids beyond the common part of the C-terminal tail inhibits its ability to recruit β-arrestin2.
Fig. 3.

Heatmap of biased factors. Biased factors were calculated using the Black and Leff Operational Model by using different normalization methods, as described in Materials and Methods. a Normalized with respect to DAMGO at MOR-1 for a comparison between drugs and variants. b Normalized with respect to each drug at mMOR-1 for a comparison across variants. c Normalized with respect to DAMGO at each variant for a comparison across drugs. The negative (blue) values indicate β-arrestin2 bias whereas the positive bias (red) values indicate G protein bias
When each agonist was normalized to MOR-1 (Fig. 3b), all the agonists excluding morphine and endomorphin-2 had greater G protein bias against MOR-1E than MOR-1. On the other hand, all the agonists except for endomorphin-2 showed greater β-arrestin2 bias against MOR-1O than MOR-1. Similarly, most agonists showed more β-arrestin2 bias against MOR-1B1 and MOR-TR than MOR-1.
To compare differences among agonists at a specific variant, we normalized each variant to DAMGO (Fig. 3c). Compared to DAMGO, endomorphin-1 and endomorphin-2 were β-arrestin2 biased at mMOR-1. Endomorphin-1 and endomorphin-2 also showed β-arrestin2 bias for most of the other variants except for endomorphin-2 at mMOR-1O and endomorphin-1 at MOR-1A, both of which showed a slight G-protein bias. Relative to DAMGO, Met-Enk-Arg-Phe was G protein biased against all the variants except for MOR-TR. Methadone also showed an interesting pattern in this comparison, showing a modest G-protein bias for all variants excluding mMOR-1B1 and mMOR-1C. Morphine was notable for its far greater β-arrestin2 bias against mMOR-1E.
Mu Agonists Induce Differential ERK1/2 Activation at MOR-1 and MOR-1O
Either β-arrestin2 signaling or G protein signaling can lead ERK1/2 activation, which has been linked to receptor desensitization and opioid tolerance. Our observation that MOR-1O has greater β-arrestin2 bias than MOR-1 by the most agonists raised questions regarding their ERK1/2 activation profile. We then examined ERK1/2 phosphorylation, an indicator of ERK1/2 activation, using Western blot analysis in HEK293 cells expressing MOR-1 and MOR-1O treated with several mu agonists, including DAMGO, fentanyl and buprenorphine. The ratio of phosphorylated ERK1/2 (pERK1/2) and total ERK1/2 (tERK1/2) was used as measurement of ERK1/2 phosphorylation level. We observed that buprenorphine induced significantly higher level of ERK1/2 phosphorylation in MOR-1, when compared to no drug group (Fig. 4a, b). On the other hand, the ERK1/2 phosphorylation level in MOR-1O by buprenorphine has a trend of increase, but it was not statistically significant. Notably, buprenorphine induced much higher level of ERK1/2 phosphorylation in MOR-1 than MOR-1O. Since buprenorphine had similar G protein-biased profiles against MOR-1 in both CHO cells (above studies) (Schmid et al. 2017) and HEK293 cells (Ehrlich et al. 2019; Pedersen et al. 2020), our data suggested that buprenorphine-induced ERK1/2 phosphorylation at MOR-1 in HEK293 cells was mediated mainly through G protein mechanism. Although there was no data of buprenorphine-induced G protein coupling and β-arrestin2 recruitment at MOR-1O using HEK293 cells, we speculate that buprenorphine-induced ERK1/2 phosphorylation at MOR-1O in HEK293 cells is also acted through G protein mechanism, which needs to be further examined.
Fig. 4.
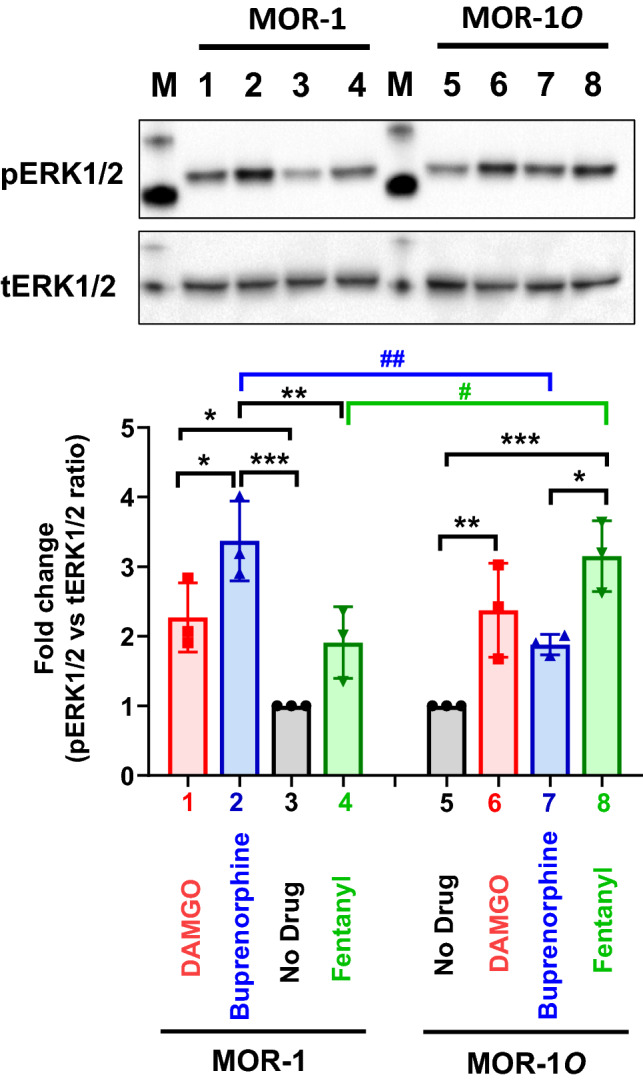
Mu agonist induced ERK1/2 activation in HEK293 cells expressing MOR-1 and MOR-1O receptor. Western blot. Whole cell lysate from HEK293 cells expressing indicated variants with treatment of mu agonists (1 µM, 5 min) were used in Western blot analysis, as described in Materials and Methods. Lanes 3 & 5: No drug control; Lanes 1 & 6: DAMGO; Lanes 2 & 7: buprenorphine; Lanes 4 & 8: fentanyl. pERK1/2: phosphorylated ERK1/2; tERK: total ERK1/2. One representative from three independent experiments is shown. Quantification of Western blot. Band intensities on the images obtained in ChemiDoc MP (Bio-Rad) were quantified using ImageLab 6.2. The ratios of pERK1/2 and tERK1/2 were normalized with No drug control so No drug is always as 1. Results are the means ± S.D. of three independent determinations. Significant differences were analyzed by two-way ANOVA with Bonferroni’s post hoc test. * & #: p < 0.05; ** & ##: p < 0.01; ***: p < 0.001
Yet, we observed the opposite effects of fentanyl at MOR-1 and MOR-1O. When compared to no drug group, fentanyl induced much higher level of ERK1/2 phosphorylation in MOR-1O, while it failed to significantly increase ERK1/2 phosphorylation in MOR-1 (Fig. 4a, b). Fentanyl induced higher level of ERK1/2 phosphorylation in MOR-1O than MOR-1. We hypothesize that fentanyl-induced ERK1/2 phosphorylation at MOR-1O in HEK293 cells was mainly contributed by β-arrestin2 mechanism based on our observation that fentanyl had far greater β-arrestin2 bias in MOR-1O than MOR-1 in CHO cells (Fig. 3a). However, further studies using HEK293 cells are needed to validate the hypothesis since biased signaling is cell type-dependent. In addition, DAMGO induced ERK1/2 phosphorylation of both MOR-1 and MOR-1O at a similar level (Fig. 4a, b).
Discussion
Increasing in vitro and in vivo evidence suggest the functional relevance of different 7TM full-length C-terminal variants generated by alternative 3′ splicing of Oprm1 gene in mu opioid pharmacology (Pan 2005; Pasternak et al. 2020; Pasternak and Pan 2013). The current study provides further evidence that different C-terminal sequences have dramatic influence on biased signaling for various mu agonists in terms of G protein activation and β-arrestin2 recruitment, highlighting the importance of the C-terminal variants on biased signaling.
Structurally, all these 7TM C-terminal variants are same with exception of their intracellular C-terminal tails. They all share an identical binding pocket and bind mu drugs with similar affinities. However, the marked changes of G protein activation and β-arrestin2 recruitment among these 7TM C-terminal variants for various mu agonists raise questions regarding their underlying mechanisms. There are several possibilities. First, many phosphorylation sites for different protein kinases have been predicted from alternative C-terminal tail sequences, which may potentially impact on G protein or β-arrestin2 signaling. Koch et al. showed that in HEK293 cells, mu agonists induced differential phosphorylation among several 7TM C-terminal variants, leading to their differences in receptor internalization and desensitization (Koch et al. 2001). When normalized to DAMGO at each variant, MOR-1E had the greatest β-arrestin2 bias by morphine. Interestingly, morphine induced higher level of phosphorylation at MOR-1E than MOR-1 and MOR-1C (Koch et al. 2001), which may likely contribute to its β-arrestin2 bias, although it needs to be validated. Additionally, Chakrabarti et al. reported that chronic morphine led to increase of MOR-B2 and MOR-C1 phosphorylation, which influenced their association with Gs in rats (Chakrabarti et al. 2020).
Second, it has been shown that several receptor intracellular regions or motifs that are shared by all the 7TM C-terminal variants play important roles in G protein coupling or β-arrestin2 binding. For example, the third intracellular loop in MOR-1 involved in G protein coupling and calmodulin binding (Chavkin et al. 2001). Threonine 180 located at the second intracellular loop was found to involve β-arrestin2 binding (Celver et al. 2001). Two phosphorylation motifs, 354TSST357 and 375STANT379, in exon 3-encoded intracellular C-terminal sequences were indicated to involve mu agonist-induced signaling including β-arrestin2 binding (Mann et al. 2015; Williams et al. 2013). It is likely that different C-terminal tails with a range of lengths can differentially interact with these intracellular regions or motifs, sterically influencing overall β-arrestin2 binding or G protein activation. Third, our previous studies showed that there were subtle, but significant differences in binding affinities for some mu agonists, particularly endogenous opioid peptides, among the 7TM C-terminal variants (Hurle et al. 1999; Pan et al. 2005a, 1999; Pasternak et al. 2004). We speculate that these differences are due to subtle changes of overall receptor structures by the C-terminal tails. Similarly, the different C-terminal tail sequences may alter mu agonist-induced receptor configurations favoring either G protein activation or β-arrestin2 binding. Unfortunately, the recent crystal structures of mu opioid receptor at antagonist or agonist configuration used the truncated receptor without C-terminal or N-terminal sequences (Koehl et al. 2018; Manglik et al. 2012). It will be interesting to further investigate the potential impact of the C-terminal tails on receptor structures using new technologies such as high-resolution cryogenic electron microscopy.
Our observation that exon 7-associated MOR-1O showed greater β-arresin2 bias for most mu agonists than exon 4-associated MOR-1 is particularly interesting. Truncating exon 7-encoded C-terminal tails in C57BL/6 J mice led to reduced morphine tolerance and reward, contrasting to truncation of exon 4-encoded C-terminal tails that facilitated morphine tolerance with no effect on morphine reward (Xu et al. 2017). These data suggest that exon 7-encoded C-terminal tails promote morphine tolerance and reward, while exon 4-encoded C-terminal tails inhibit morphine tolerance. More intriguingly, several phenotypes in the exon 7 truncation mouse mimicked those observed in a β-arresin2 KO mouse (Bohn et al. 2000, 2003, 2002; Raehal et al. 2005), suggesting the physical and functional interactions of exon 7-encoded sequences with β-arresin2. The data from the current study provide a strong foundation to support such interactions. Furthermore, the exon 7-encoded C-terminal tail sequences in MOR-1O and MOR-1C contain a consensus phosphorylation code, PxPxxE or PxxPxxE, for high-affinity arrestin binding (underlined sequences in Fig. 1) that was proposed based on homology modeling with the recent crystal structures of several GPCRs (Zhou et al. 2017). This may explain why the exon 7-associated variants, particularly MOR-1O, showed far greater β-arrestin2 bias for several mu agonists than MOR-1 that lacks this phosphorylation code in our study. Our preliminary observation that when the phosphorylation code was replaced by alanine in MOR-1O, DAMGO-induced β-arrestin2 recruitment was diminished confirms the hypothesis (data not shown). On the other hand, MOR-1C, another exon 7-associated 7TM C-terminal variant, is more β-arresin2 biased than MOR-1 for several most mu agonists, but showed less β-arresin2 bias than MOR-1O. Both MOR-1C and MOR-1O had same 30 amino acid sequences encoded by exon 7 at the C-terminus. MOR-1C contains additional 22 amino acids encoded by exons 8 and 9. It is likely that the additional 22 amino acids sequences suppressed β-arresin2 binding, although speculated.
The current study examines mu agonist-induced signaling in each individual 7TM variant using in vitro cell models. However, most of these 7TM C-terminal variants in brain are differentially co-expressed in various regions at different levels (Xu et al. 2015, 2014). Thus, in vivo biased signaling of a mu agonist can be considered as a result from overall or overlapping effect of the agonist on multiple variants expressed in various brain regions. It will be interesting to further explore the roles of the 7TM C-terminal variants in biased signaling in vivo. In addition, there are 22 7TM full-length C-terminal variants in the mouse Oprm1 gene. The current study only examined six of them, opening questions regarding the roles of other 7TM C-terminal variants in biased signaling.
OPRM1 alternative splicing is conserved from rodent to human. The human OPRM1 gene has 12 7TM C-terminal splice variants that share similar C-terminal tail sequences or splicing patterns (Pasternak et al. 2020; Pasternak and Pan 2013). For example, the human MOR-1B1 has identical five amino acids, KIDLF, encoded by exon 5a at the C-terminus, as the mouse MOR-1B1, except for having additional nine amino acids beyond KIDLF. The human MOR-1A has four amino acids, VRSL, encoded by exon 3b, which are similar to VCAF of the mouse MOR-1A. The human exon O, a homolog of the mouse exon 7, in the human MOR-1O encodes thirty amino acids that share 67% identity with the mouse exon 7 in the mouse MOR-1O, MOR-1C and MOR-1U (Doyle et al. 2007; Xu et al. 2017). Although the current study uses the mouse variants, our results raise questions whether the human OPRM1 7TM C-terminal variants have similar functions as their mouse partners in biased signaling.
Our results should be interpreted cautiously due to some limitations. Either G protein activation or β-arresin2 recruitment is cell type-dependent. Different cell types may have divergent profiles of G protein activation or β-arresin2 recruitment. For example, the CHO cells we used express all the G protein subunits but lack Gia1. Using anther cell line with a different G protein subunit composition may yield different results. In addition, the PK-tagged receptor constructs for β-arresin2 recruitment assay may have some unwanted effect on signaling, although we demonstrated that it had no effect on receptor binding affinity and G protein activation. Additionally, both G protein activation and β-arresin2 recruitment are time-dependent. In our assays, we only measured them at the end time point after treating agonists for 60 min in [35S]GTPγS binding assay and 90 min in the PathHunter® β-arresin2 recruitment assay. Although the accumulated signals are collected, the data will not show any dynamic changes, which can be measured by using other methods such as the Transfluor imaging assay (Barak et al. 1997), bioluminescent energy transfer (BRET) assay (Bertrand et al. 2002; Hamdan et al. 2005) and NanoLuc Binary Technology (Dixon et al. 2016). Despite these limitations, our study provides obvious evidence on the functional relevance of the C-terminal variants in biased signaling at least under our assay conditions.
Conclusion
The current study explores biased signaling in six Oprm1 7TM C-terminal splice variants including MOR-1 and reveals marked differences in mu agonist-induced G protein activation and β-arrestin2 recruitment among the variants and among the agonists, leading to mathematical prediction of biased signaling. Particularly, MOR-1O, an exon 7-associated 7TM C-terminal variant, showed greater β-arrestin2 bias for most mu agonists than MOR-1, an exon 4-associated variant. Biased signaling of GPCRs has been defined by evidences that different agonists can produce divergent signaling transduction pathways through a single receptor. Our findings that a single mu agonist can induce differential signaling through multiple 7TM splice variants provide a new perspective on biased signaling at least for Oprm1, which perhaps is important for our understanding of the complex mu opioid actions in vivo where all the 7TM splice variants co-exist.
Electronic supplementary material
Below is the link to the electronic supplementary material.
Acknowledgements
This work was supported, in part, by Grants from the National Institute on Drug Abuse of the National Institutes of Health, DA042888, DA046714 and DA007242, the Mayday Foundation and the Peter F. McManus Charitable Trust to YXP, and a core Grant from the National Cancer Institute (CA008748) to Memorial Sloan Kettering Cancer Center.
Author Contributions
AN, GWP and YXP conceived and designed the study. AN, AH, JX, DIB and YXP performed experiments. AN, AH and YXP analyzed data. AN, GWP and YXP wrote the manuscript. All authors read and approved the final manuscript.
Compliance with Ethical Standards
Conflict of interest
YXP is a co-scientific founder of Sparian Biosciences. All other authors declare that there is no conflict of interest.
Footnotes
The original online version of this article was revised: typo in co-author name Amanda Hunkele has been corrected.
Publisher's Note
Springer Nature remains neutral with regard to jurisdictional claims in published maps and institutional affiliations.
Change history
10/31/2020
A Correction to this paper has been published: 10.1007/s10571-020-00990-4
References
- Abbadie C, Pan Y-X, Drake CT, Pasternak GW (2000a) Comparative immunhistochemical distributions of carboxy terminus epitopes from the mu opioid receptor splice variants MOR-1D, MOR-1 and MOR-1C in the mouse and rat central nervous systems. Neuroscience 100:141–153 [DOI] [PubMed] [Google Scholar]
- Abbadie C, Pan Y-X, Pasternak GW (2000b) Differential distribution in rat brain of mu opioid receptor carboxy terminal splice variants MOR-1C and MOR-1-like immunoreactivity: evidence for region-specific processing. J Comp Neurol 419:244–256 [DOI] [PubMed] [Google Scholar]
- Abbadie C, Pasternak GW (2001) Differential in vivo internalization of MOR-1 and MOR-1C by morphine. NeuroReport 12:3069–3072 [DOI] [PubMed] [Google Scholar]
- Barak LS, Ferguson SS, Zhang J, Caron MG (1997) A beta-arrestin/green fluorescent protein biosensor for detecting G protein-coupled receptor activation. J Biol Chem 272:27497–27500. 10.1074/jbc.272.44.27497 [DOI] [PubMed] [Google Scholar]
- Bertrand L et al (2002) The BRET2/arrestin assay in stable recombinant cells: a platform to screen for compounds that interact with G protein-coupled receptors (GPCRS). J Recept Signal Transduct Res 22:533–541. 10.1081/rrs-120014619 [DOI] [PubMed] [Google Scholar]
- Bohn LM, Gainetdinov RR, Lin FT, Lefkowitz RJ, Caron MG (2000) Mu-opioid receptor desensitization by beta-arrestin-2 determines morphine tolerance but not dependence. Nature 408:720–723 [DOI] [PubMed] [Google Scholar]
- Bohn LM, Gainetdinov RR, Sotnikova TD, Medvedev IO, Lefkowitz RJ, Dykstra LA, Caron MG (2003) Enhanced rewarding properties of morphine, but not cocaine, in beta(arrestin)-2 knock-out mice. J Neurosci 23:10265–10273 [DOI] [PMC free article] [PubMed] [Google Scholar]
- Bohn LM, Lefkowitz RJ, Caron MG (2002) Differential mechanisms of morphine antinociceptive tolerance revealed in (beta)arrestin-2 knock-out mice. J Neurosci 22:10494–10500 [DOI] [PMC free article] [PubMed] [Google Scholar]
- Bolan EA, Pan YX, Pasternak GW (2004) Functional analysis of MOR-1 splice variants of the mouse mu opioid receptor gene. Oprm Synapse 51:11–18 [DOI] [PubMed] [Google Scholar]
- Brown TG, Xu J, Hurd YL, Pan YX (2020) Dysregulated expression of the alternatively spliced variant mRNAs of the mu opioid receptor gene, OPRM1, in the medial prefrontal cortex of male human heroin abusers and heroin self-administering male rats. J Neurosci Res. 10.1002/jnr.24640 [DOI] [PMC free article] [PubMed] [Google Scholar]
- Celver JP, Lowe J, Kovoor A, Gurevich VV, Chavkin C (2001) Threonine 180 is required for G-protein-coupled receptor kinase 3- and beta -arrestin 2-mediated desensitization of the {micro}-opioid receptor in xenopus oocytes. J Biol Chem 276:4894–4900 [DOI] [PubMed] [Google Scholar]
- Chakrabarti S, Liu NJ, Gintzler AR (2020) Phosphorylation of unique C-terminal sites of the mu-opioid receptor variants 1B2 and 1C1 influences their Gs association following chronic morphine. J Neurochem 152:449–467. 10.1111/jnc.14863 [DOI] [PMC free article] [PubMed] [Google Scholar]
- Chavkin C, McLaughlin JP, Celver JP (2001) Regulation of opioid receptor function by chronic agonist exposure: constitutive activity and desensitization. Mol Pharmacol 60:20–25 [DOI] [PubMed] [Google Scholar]
- Dever SM et al (2014) Differential expression of the alternatively spliced OPRM1 isoform mu-opioid receptor-1K in HIV-infected individuals. AIDS 28:19–30. 10.1097/QAD.0000000000000113 [DOI] [PMC free article] [PubMed] [Google Scholar]
- Dever SM, Xu R, Fitting S, Knapp PE, Hauser KF (2012) Differential expression and HIV-1 regulation of mu-opioid receptor splice variants across human central nervous system cell types. J Neurovirol 18:181–190. 10.1007/s13365-012-0096-z [DOI] [PMC free article] [PubMed] [Google Scholar]
- Dixon AS et al (2016) NanoLuc complementation reporter optimized for accurate measurement of protein interactions in cells. ACS Chem Biol 11:400–408. 10.1021/acschembio.5b00753 [DOI] [PubMed] [Google Scholar]
- Doyle GA et al (2007) Identification of five mouse mu-opioid receptor (MOR) gene (Oprm1) splice variants containing a newly identified alternatively spliced exon. Gene 395:98–107 [DOI] [PMC free article] [PubMed] [Google Scholar]
- Eglen RM, Singh R (2003) Beta galactosidase enzyme fragment complementation as a novel technology for high throughput screening. Comb Chem High Throughput Screen 6:381–387. 10.2174/138620703106298473 [DOI] [PubMed] [Google Scholar]
- Ehrlich AT et al (2019) Biased signaling of the Mu opioid receptor revealed in native neurons. iScience 14:47–57. 10.1016/j.isci.2019.03.011 [DOI] [PMC free article] [PubMed] [Google Scholar]
- Gandini MA, Souza IA, Raval D, Xu J, Pan YX, Zamponi GW (2019) Differential regulation of Cav2.2 channel exon 37 variants by alternatively spliced mu-opioid receptors. Mol Brain 12:98. 10.1186/s13041-019-0524-6 [DOI] [PMC free article] [PubMed] [Google Scholar]
- Grim TW, Acevedo-Canabal A, Bohn LM (2020) Toward directing opioid receptor signaling to refine opioid therapeutics. Biol Psychiatry 87:15–21. 10.1016/j.biopsych.2019.10.020 [DOI] [PMC free article] [PubMed] [Google Scholar]
- Grinnell SG et al (2016) Mediation of buprenorphine analgesia by a combination of traditional and truncated mu opioid receptor splice variants. Synapse 70:395–407. 10.1002/syn.21914 [DOI] [PMC free article] [PubMed] [Google Scholar]
- Hamdan FF, Audet M, Garneau P, Pelletier J, Bouvier M (2005) High-throughput screening of G protein-coupled receptor antagonists using a bioluminescence resonance energy transfer 1-based beta-arrestin2 recruitment assay. J Biomol Screening 10:463–475. 10.1177/1087057105275344 [DOI] [PubMed] [Google Scholar]
- Hurle MA, Sanchez A, Garcia-Sancho J (1999) Effects of k- and m-opioid receptor agonists on Ca2+ channels in neuroblastoma cells: involvement of the orphan opioid receptor. Eur J Pharmacol 379:191–198 [DOI] [PubMed] [Google Scholar]
- Kenakin T, Christopoulos A (2013) Signalling bias in new drug discovery: detection, quantification and therapeutic impact. Nat Rev Drug Discov 12:205–216. 10.1038/nrd3954 [DOI] [PubMed] [Google Scholar]
- Kenakin T, Watson C, Muniz-Medina V, Christopoulos A, Novick S (2012) A simple method for quantifying functional selectivity and agonist bias. ACS Chem Neurosci 3:193–203. 10.1021/cn200111m [DOI] [PMC free article] [PubMed] [Google Scholar]
- Koch T, Schulz S, Pfeiffer M, Klutzny M, Schroder H, Kahl E, Hollt V (2001) C-terminal splice variants of the mouse mu-opioid receptor differ in morphine-induced internalization and receptor resensitization. J Biol Chem 276:31408–31414 [DOI] [PubMed] [Google Scholar]
- Koch T, Schulz S, Schroder H, Wolf R, Raulf E, Hollt V (1998) Carboxyl-terminal splicing of the rat mu opioid receptor modulates agonist-mediated internalization and receptor resensitization. J Biol Chem 273:13652–13657 [DOI] [PubMed] [Google Scholar]
- Koehl A et al (2018) Structure of the mu-opioid receptor-G(i) protein complex. Nature 558:547. 10.1038/s41586-018-0219-7 [DOI] [PMC free article] [PubMed] [Google Scholar]
- Majumdar S et al (2011) Truncated G protein-coupled mu opioid receptor MOR-1 splice variants are targets for highly potent opioid analgesics lacking side effects. Proc Natl Acad Sci USA 108:19778–19783. 10.1073/pnas.1115231108 [DOI] [PMC free article] [PubMed] [Google Scholar]
- Majumdar S et al (2012) Synthesis and evaluation of aryl-naloxamide opiate analgesics targeting truncated exon 11-associated mu opioid receptor (MOR-1) splice variants. J Med Chem 55:6352–6362. 10.1021/jm300305c [DOI] [PMC free article] [PubMed] [Google Scholar]
- Manglik A et al (2012) Crystal structure of the mu-opioid receptor bound to a morphinan antagonist. Nature 485:321–U170. 10.1038/nature10954 [DOI] [PMC free article] [PubMed] [Google Scholar]
- Mann A, Illing S, Miess E, Schulz S (2015) Different mechanisms of homologous and heterologous mu-opioid receptor phosphorylation. Br J Pharmacol 172:311–316. 10.1111/bph.12627 [DOI] [PMC free article] [PubMed] [Google Scholar]
- McPherson J et al (2010) mu-opioid receptors: correlation of agonist efficacy for signalling with ability to activate internalization. Mol Pharmacol 78:756–766. 10.1124/mol.110.066613 [DOI] [PMC free article] [PubMed] [Google Scholar]
- Molinari P et al (2010) Morphine-like opiates selectively antagonize receptor-arrestin interactions. J Biol Chem 285:12522–12535. 10.1074/jbc.M109.059410 [DOI] [PMC free article] [PubMed] [Google Scholar]
- Pan YX (2005) Diversity and complexity of the mu opioid receptor gene: alternative pre-mRNA splicing and promoters. DNA Cell Biol 24:736–750 [DOI] [PubMed] [Google Scholar]
- Pan YX et al (1999) Identification and characterization of three new alternatively spliced mu-opioid receptor isoforms. Mol Pharmacol 56:396–403 [DOI] [PubMed] [Google Scholar]
- Pan YX, Xu J, Bolan E, Moskowitz HS, Xu M, Pasternak GW (2005a) Identification of four novel exon 5 splice variants of the mouse mu-opioid receptor gene: functional consequences of C-terminal splicing. Mol Pharmacol 68:866–875 [DOI] [PubMed] [Google Scholar]
- Pan L, Xu J, Yu R, Xu MM, Pan YX, Pasternak GW (2005b) Identification and characterization of six new alternatively spliced variants of the human mu opioid receptor gene. Oprm Neuroscience 133:209–220 [DOI] [PubMed] [Google Scholar]
- Pan YX, Xu J, Xu M, Rossi GC, Matulonis JE, Pasternak GW (2009) Involvement of exon 11-associated variants of the mu opioid receptor MOR-1 in heroin, but not morphine, actions. Proc Natl Acad Sci 106:4917–4922 [DOI] [PMC free article] [PubMed] [Google Scholar]
- Pasternak DA, Pan L, Xu J, Yu R, Xu MM, Pasternak GW, Pan YX (2004) Identification of three new alternatively spliced variants of the rat mu opioid receptor gene: dissociation of affinity and efficacy. J Neurochem 91:881–890 [DOI] [PubMed] [Google Scholar]
- Pasternak GW, Childers SR, Pan YX (2020) Emerging insights into mu opioid pharmacology. Handb Exp Pharmacol 258:89–125. 10.1007/164_2019_270 [DOI] [PubMed] [Google Scholar]
- Pasternak GW, Pan YX (2013) Mu opioids and their receptors: evolution of a concept. Pharmacol Rev 65:1257–1317. 10.1124/pr.112.007138 [DOI] [PMC free article] [PubMed] [Google Scholar]
- Pedersen MF et al (2020) Biased agonism of clinically approved mu-opioid receptor agonists and TRV130 is not controlled by binding and signaling kinetics. Neuropharmacology 166:107718. 10.1016/j.neuropharm.2019.107718 [DOI] [PubMed] [Google Scholar]
- Raehal KM, Walker JK, Bohn LM (2005) Morphine side effects in beta-arrestin 2 knockout mice. J Pharmacol Exp Ther 314:1195–1201. 10.1124/jpet.105.087254 [DOI] [PubMed] [Google Scholar]
- Schmid CL et al (2017) Bias factor and therapeutic window correlate to predict safer opioid analgesics. Cell 171:1165. 10.1016/j.cell.2017.10.035 [DOI] [PMC free article] [PubMed] [Google Scholar]
- Tanowitz M, Hislop JN (2008) Alternative splicing determines the post-endocytic sorting fate of G-protein-coupled receptors. J Biol Chem 283:35614–35621. 10.1074/jbc.M806588200 [DOI] [PMC free article] [PubMed] [Google Scholar]
- van der Westhuizen ET, Breton B, Christopoulos A, Bouvier M (2014) Quantification of ligand bias for clinically relevant beta2-adrenergic receptor ligands: implications for drug taxonomy. Mol Pharmacol 85:492–509. 10.1124/mol.113.088880 [DOI] [PubMed] [Google Scholar]
- Verzillo V, Madia PA, Liu NJ, Chakrabarti S, Gintzler AR (2014) Mu-opioid receptor splice variants: sex-dependent regulation by chronic morphine. J Neurochem 130:790–796. 10.1111/jnc.12768 [DOI] [PMC free article] [PubMed] [Google Scholar]
- Williams JT et al (2013) Regulation of mu-opioid receptors: desensitization, phosphorylation, internalization, and tolerance. Pharmacol Rev 65:223–254. 10.1124/pr.112.005942 [DOI] [PMC free article] [PubMed] [Google Scholar]
- Xu J, Faskowitz AJ, Rossi GC, Xu M, Lu Z, Pan YX, Pasternak GW (2015) Stabilization of morphine tolerance with long-term dosing: Association with selective upregulation of mu-opioid receptor splice variant mRNAs. Proc Natl Acad Sci USA 112:279–284. 10.1073/pnas.1419183112 [DOI] [PMC free article] [PubMed] [Google Scholar]
- Xu J et al (2017) Alternatively spliced mu opioid receptor C termini impact the diverse actions of morphine. J Clin Investig 127:1561–1573. 10.1172/JCI88760 [DOI] [PMC free article] [PubMed] [Google Scholar]
- Xu J et al (2014) Differential expressions of the alternatively spliced variant mRNAs of the micro opioid receptor gene, OPRM1, in brain regions of four inbred mouse strains. PLoS ONE 9:e111267. 10.1371/journal.pone.0111267 [DOI] [PMC free article] [PubMed] [Google Scholar]
- Xu J et al (2013) Stabilization of the mu-opioid receptor by truncated single transmembrane splice variants through a chaperone-like action. J Biol Chem 288:21211–21227. 10.1074/jbc.M113.458687 [DOI] [PMC free article] [PubMed] [Google Scholar]
- Zhou XE et al (2017) Identification of phosphorylation codes for arrestin recruitment by G protein-coupled receptors. Cell 170(457–469):e413. 10.1016/j.cell.2017.07.002 [DOI] [PMC free article] [PubMed] [Google Scholar]
Associated Data
This section collects any data citations, data availability statements, or supplementary materials included in this article.