

Abstract
RNA binding proteins (RBPs) are increasingly appreciated as being essential for normal hematopoiesis and have a critical role in the progression of hematological malignancies. However, their functional consequences and clinical significance in diffuse large B‐cell lymphoma (DLBCL) remain unknown. Here, we conducted a systematic analysis to identify RBP‐related genes affecting DLBCL prognosis based on the Gene Expression Omnibus database. By univariate and multivariate Cox proportional hazards regression (CPHR) methods, six RBPs‐related genes (CMSS1, MAEL, THOC5, PSIP1, SNIP1, and ZCCHC7) were identified closely related to the overall survival (OS) of DLBCL patients. The RBPs signature could efficiently distinguished low‐risk from high‐risk patients and could serve as an independent and reliable factor for predicting OS. Moreover, Gene Set Enrichment Analysis revealed 17 significantly enriched pathways between high‐ versus low‐risk group, including the regulation of autophagy, chronic myeloid leukemia, NOTCH signaling pathway, and B cell receptor signaling pathway. Then we developed an RBP‐based nomogram combining other clinical risk factors. The receiver operating characteristic curve analysis demonstrated high prognostic predictive efficiency of this model with the area under the curve values were 0.820 and 0.780, respectively, in the primary set and entire set. In summary, our RBP‐based model could be a novel prognostic predictor and had the potential for developing treatment targets for DLBCL.
Keywords: diffuse large B‐cell lymphoma, GEO, prognosis, prognostic model, RNA‐binding proteins
We found that six RNA binding proteins are significantly related to the overall survival of diffuse large B‐cell lymphoma (DLBCL) patients, which could potentially be served as prognostic biomarkers. Gene Set Enrichment Analysis provided insight into the underlying mechanisms in the occurrence and development of DLBCL, which laid the foundation for further basic studies.
1. INTRODUCTION
Diffuse large B‐cell lymphoma (DLBCL) is an aggressive form of non‐Hodgkin lymphoma with variations in gene expression profiles and genetic alterations displaying the difference in clinical course and response to therapy. 1 In the past two decades, rituximab plus CHOP (R‐CHOP) immunochemotherapy (rituximab plus cyclophosphamide, doxorubicin, vincristine, and prednisone) significantly extended the survival and increased the patient cure rate, with 50%–70% of patients being cured using this approach. 2 However, the efficacy of salvage options for the refractory/relapse DLBCL patients is diminished. The ability to identify a very poor risk group with low probability of cure following R‐CHOP at diagnosis is a major unmet clinical need. 3 , 4
Gene expression profiling studies have demonstrated that distinct B‐cell differentiation stages are not only regulated by transcription factors but also affected by post‐transcriptional regulatory mechanisms, including RNA binding proteins (RBPs). 1 , 5 RNAs have been identified as oncogenic drivers and tumor suppressors in every major cancer type. 6 , 7 , 8 RBPs modulate multiple cancer traits and regulate a multitude of cellular processes, including subcellular localization, translational repression and stability, and the control of cell proliferation. 8 , 9 Perturbations in RBP‐RNA networks activity have been causally associated with cancer development. 7 , 10 Because of its pleotropic effects, an increasing number of studies have point to the crucial role of RBPs in hematopoietic malignancies. 8 , 11 , 12 However, whether RBPs can independently act as a biomarker that can predict the clinical outcomes of therapeutic strategies in DLBCL remains unknown. Meanwhile, a deeper understanding of the normal role of RBPs complex networks would provide a unique opportunity to unveil better interventions for the treatment of R/R DLBCL.
In this study, we extracted RNA sequencing and clinical data from the Gene Expression Omnibus (GEO) database and constructed a 6‐RBP‐based gene signature to predict the prognostic risk of DLBCL. Then, we developed a composite prognostic nomogram combining the RBP‐based prognostic signature with clinical risk factors, which demonstrated higher predictive efficiency than their separation. Overall, our data suggest that RBPs play pivotal roles in DLBCL and the RBP‐based model could be used as reliable prognostic predictors for DLBCL survival.
2. MATERIALS AND METHODS
2.1. Data acquisition
The public gene expression profiling and clinical data were available in the GEO database (https://www.ncbi.nlm.nih.gov/geo/). Two DLBCL related datasets GSE10846 and GSE11318, which used the GPL570 platform, were obtained in a normalized expression matrix file format. To clarify the association between gene expression signatures and overall survival (OS) of DLBCL patients, samples without accurate survival data were filtered out. Thus, DLBCL data for a total of 412 patients from the GSE10846 and 199 patients from the GSE11318 were included in this study. A total of 1542 RBP‐related genes had been reported previously and were analyzed in this study. 9
2.2. Screening of OS‐related RBP in DLBCL patients
The matrix of 1542 RBP‐related gene expression was first extracted. The univariate Cox proportional hazards regression (CPHR) and the Kaplan–Meier (K–M) analysis were performed by “survival” R package. Genes with p ≤ 0.01 and with their expression logical consistency with the prognostic effects were considered as candidate prognostic RBP‐related genes.
2.3. Identification and assessment of the RBP‐related gene signature
To minimize the number of genes more closely related to OS, the least absolute shrinkage and selection operator (LASSO) Cox regression was performed by “glmnet” R package. Then, multivariate CPHR (stepwise model) analysis was applied by “survival” R package to construct a prognostic model. Prognostic risk score was calculated by following formula: risk score = Exp1*Coef1 + Exp2*Coef2 + Exp3*Coef3 + … Expn*Coefn. Exp is the expression level of hub‐gene, and Coef is the regression coefficients of the corresponding gene derived from the multivariate CPHR. Median risk score was used as a cut‐off value to divided patients into low‐ and high‐risk groups.
2.4. Gene Set Enrichment Analysis
To explore the KEGG pathways that may be related to high‐ or low‐risk patients, we performed Gene Set Enrichment Analysis (GSEA) between the high‐ and low‐risk groups based on identified gene signature. GSEA_v4.1.0 (http://www.gsea‐msigdb.org/gsea/index.jsp) was used for analysis according to default parameters and c2.cp.kegg.v6.2.symbols.gmt was used as a reference gene list. The pathways with p < 0.05 and normalized enrichment score |NES| ≥ 1 were considered significant.
2.5. Construction and validation of the prognostic nomogram
We further performed univariate and multivariate CPHR analysis of conventional clinical risk factors and RBP‐related signature to identify independent prognostic factor of OS in the GSE10846 dataset. A prognostic nomogram combining gene signature and OS‐related clinical factors was established by “rms” R package. Calibration curves and concordance index(C‐index) were used to evaluate the abilities of the nomogram.
2.6. Statistical analysis
Kaplan–Meier survival curves and log‐rank test were performed by utilizing “survival” and “survminer” R package to demonstrated survival differences between the two groups. Time‐dependent receptor operating characteristic (ROC) analysis was performed by “survivalROC” R package to assess the accuracy of the prognostic model. p < 0.05 was indicated statistically significant.
3. RESULTS
3.1. Identification of OS‐related RBP
As the workflow of this study presented in Figure 1, we defined 412 patients from the GSE10846 as the “entire set,” 208 of them were randomly assigned as the “primary set.” The patients in the primary set were used as a training cohort, and the patients in the entire set and GSE11318 were used as validation cohort (Table 1).
FIGURE 1.
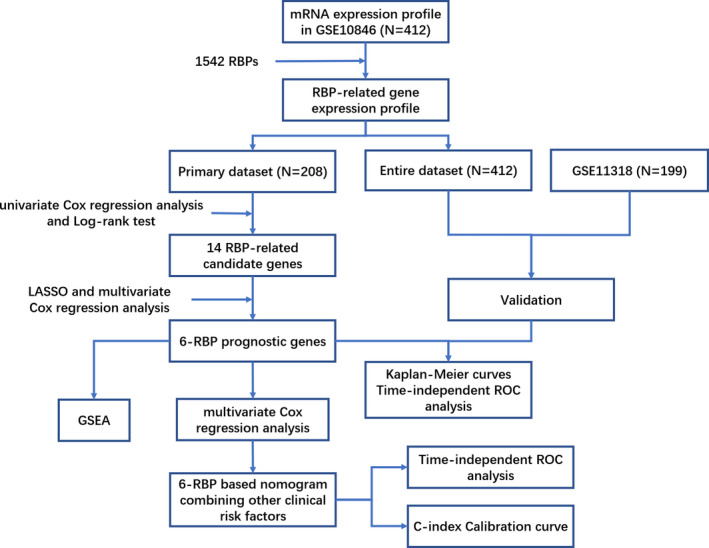
Flowchart of the present study
TABLE 1.
Baseline clinical features of diffuse large B‐cell lymphoma patients involved in this study
| Features | GSE10846 dataset (n = 412) | GSE11318 dataset (n = 199) | |
|---|---|---|---|
| Primary set (n = 208) | Entire set (n = 412) | ||
| Gender | |||
| Male | 108 | 222 | 109 |
| Female | 91 | 172 | 90 |
| NA | 9 | 18 | |
| Age | |||
| ≤60 | 91 | 188 | 69 |
| <60 | 117 | 224 | 93 |
| NA | 37 | ||
| Subtype | |||
| GCB | 86 | 182 | 70 |
| Non‐GCB | 122 | 230 | 129 |
| ECOG | |||
| ≤1 | 148 | 295 | 122 |
| >1 | 51 | 93 | 39 |
| NA | 9 | 24 | 38 |
| Stage | |||
| I–II | 89 | 188 | 75 |
| III–IV | 115 | 217 | 87 |
| NA | 4 | 7 | 37 |
| Treatment | |||
| CHOP | 83 | 180 | 162 |
| R‐CHOP | 125 | 232 | |
| NA | 37 | ||
Abbreviations: CHOP, cyclophosphamide, doxorubicin, vincristine, and prednisone; ECGO, eastern cooperative oncology group score; GCB, germinal center B‐cell‐like; NA, not available; R‐CHOP, rituximab plus CHOP.
To identify OS‐related RBP in DLBCL patients, 1542 RBP‐related genes were subjected to univariate CPHR and the K–M survival analysis in the training set. We set the p ≤ 0.01 as the screening criteria, and 14 RBP‐related candidate genes were identified associating with OS (Figure S1A). We then performed a LASSO regression analysis (Figure S1B) and multivariate CPHR analysis (stepwise model) on these 14 genes to build a best‐fit prognostic signature. Six RBP‐related genes (CMSS1, MAEL, THOC5, PSIP1, SNIP1, and ZCCHC7) were finally selected to predict OS in DLBCL patients (Figure 2A). The K–M curves of six genes could clearly distinguish two groups (all p < 0.05), consistent with the results of Cox regression analysis (Figure 2B). The risk score of the prognostic signature was established as following formula: Risk score = (0.683 × Exp[CMSS1]) + (−0.386 × Exp[MAEL]) + (−0.556 × Exp[PSIP1]) + (0.821 × Exp[SNIP1]) + (0.511 × Exp[THOC5]) + (−0.324 × Exp[ZCCHC7]).
FIGURE 2.
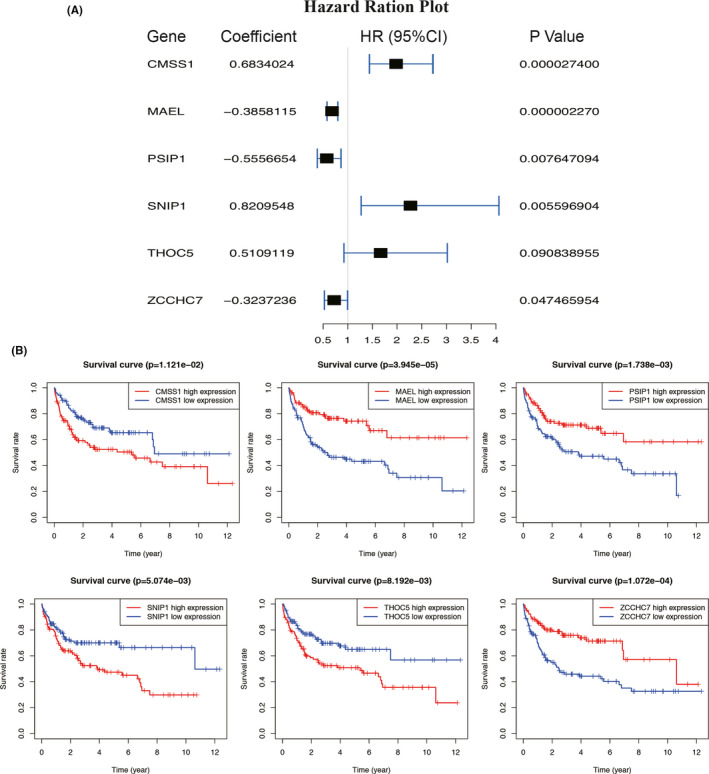
Identification of Six RNA binding protein (RBP)‐related genes associating with overall survival. (A) Forest plot of six prognostic RBPs in diffuse large B‐cell lymphoma based on the multivariate Cox regression analysis. (B) Kaplan–Meier analysis of six RBP‐related genes. CI, confidence interval. p < 0.05 was considered statistically significant
3.2. Assessment and validation of the six‐RBP prognostic signature
Based on the median risk score, DLBCL patients in the training set (primary set, N = 208) were divided into high‐ and low‐risk groups. The K–M survival analysis showed that the DLBCL patients with high‐risk score had a poor prognosis than those with low‐risk score (p = 1.52e−13) (Figure 3A). The time‐dependent ROC curves demonstrated that the area under the curve (AUC) of the six‐RBP signature reached 0.798 and 0.744 at 3 and 5 years, respectively (Figure 3B). The risk scores, survival status, and heatmap of six‐RBP expression are shown in Figure 3C.
FIGURE 3.
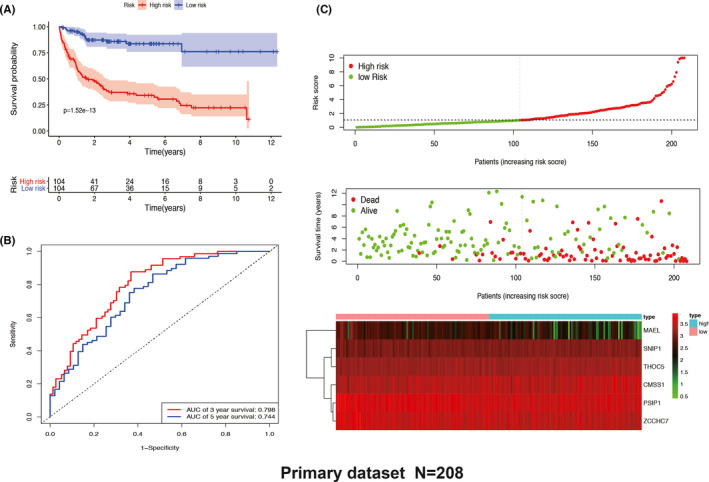
Six‐RNA binding protein (RBP) signature‐based risk score analysis of primary dataset in GSE10846. (A) Kaplan–Meier analysis of patients with high‐ and low‐risk score. (B) Time‐dependent receiver operating characteristic curve analysis for evaluating the 3‐ and 5‐year predictive performance based on the six‐RBP gene signature. (C) Six‐RBP signature‐based risk score distribution, overall survival status, and heatmap of gene expression. AUC, area under the curve
We further validated the six‐RBP prognostic signature in the entire set (n = 412) (Figure 4A) and GSE11318 dataset (n = 199) (Figure 4B). The distribution of risk score and survival status in the entire set and GSE11318 were consistent with the results showing above. The K–M survival analysis showed that high‐risk score associated with poor survival time in the primary set (p = 6.328e−15) and GSE11318 (p = 2.237e−04). The six‐RBP prognostic signature achieved the AUC of 0.735 at 3 years and 0.711 at 5 years in the entire set and achieved the AUC of 0.65 at 3 years and 0.656 at 5 years in the GSE11318 dataset.
FIGURE 4.
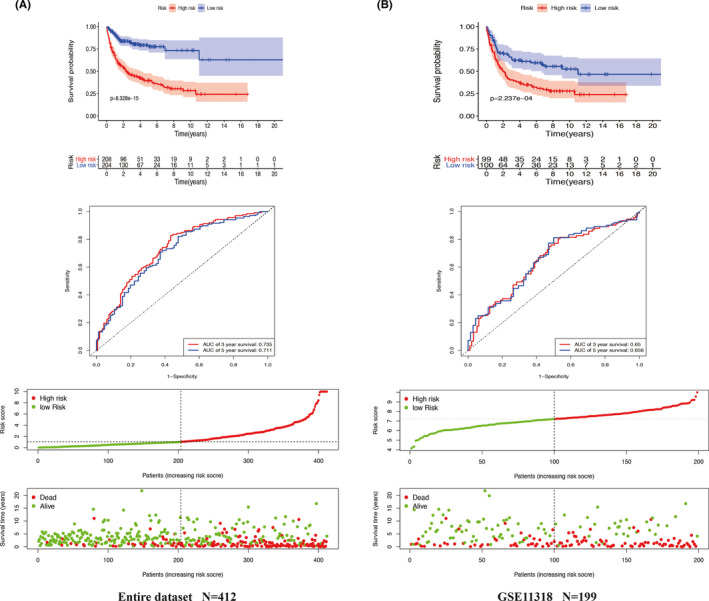
Validation of Six‐RNA binding protein (RBP) gene signature in the entire dataset of GSE10846 and in the GSE11318 dataset. The six‐RBP gene signature‐based Kaplan–Meier analysis for overall survival (OS), time‐dependent receiver operating characteristic curve analysis for predicting 3‐ and 5‐year OS, risk score distribution, and OS status analysis of patients in the entire dataset of GSE10846 (A) and in the GSE11318 dataset (B)
Because rituximab‐based regimens are cost‐prohibitive for many patients, we then validated the six‐RBP signature based on different treatments (CHOP or R‐CHOP). The results showed that our established six‐RBP signature could also efficiently differentiate high‐ versus low‐risk patients (p = 1.485e−05 in CHOP; p = 7.594e−09 in R‐CHOP) and accurately predict OS (AUC = 0.707 in CHOP; AUC = 0.769 in R‐CHOP) (Figure S2).
3.3. Gene Set Enrichment Analysis
To explore the potential influence of six‐RBP signature on the expression profile of DLBCL, GSEA analysis was applied in the GSE10846 cohort (high‐ vs. low‐risk group). A total of 17 KEGG pathways were identified (Table S1), among which the regulation of autophagy, chronic myeloid leukemia (CML), NOTCH signaling pathway, and B cell receptor signaling pathway are close related to lymphoma or hematological malignancies (Figure 5).
FIGURE 5.
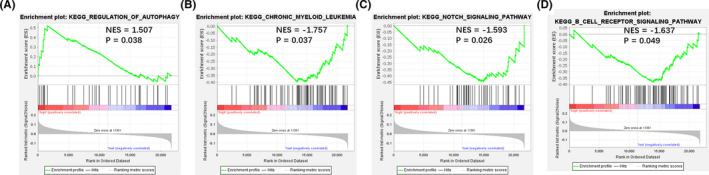
Gene set enrichment analysis (GSEA) between high‐ and low‐risk score groups in GSE10846. (A) Regulation of autophagy. (B) Chronic myeloid leukemia. (C) NOTCH signaling pathway. (D) B cell receptor signaling pathway
3.4. Univariate and multivariate CPHR of six‐RBP prognostic signature
To determine whether our prognostic signature act as an independent prognostic factor, univariate and multivariate CPHR analyses were performed in primary and entire sets. The risk score of six‐RBP and clinical factors, including gender, age, DLBCL subtype (germinal center B‐cell‐like [GCB] or non‐GCB), eastern cooperative oncology group score (ECOG), and stage, were used as covariates. Results showed that the six‐RBP signature, age, DLBCL subtype, ECOG score, and stage were significantly associated with OS (all p < 0.05), confirming that the six‐RBP signature could be an independent prognostic predictor of DLBCL patients (Table 2).
TABLE 2.
Univariate and multivariate Cox analysis of six‐RNA binding protein signature and clinical factors in the GSE10846 dataset
| Feature | Univariate COX | Multivariate COX | ||
|---|---|---|---|---|
| HR (95% CI) | p | HR (95% CI) | p | |
| Entire dataset | ||||
| Gender (male vs. female) | 0.970 (0.707–1.331) | 0.849 | 0.961 (0.705–1.311) | 0.801 |
| Age (>60 vs. ≤60 years) | 1.733 (1.233–2.436) | 0.002 | 2.019 (1.446–2.820) | <0.001 |
| Subtype (non‐GCB vs. GCB) | 1.527 (1.060–2.198) | 0.023 | 2.384 (1.695–3.352) | <0.001 |
| ECOG (>1 vs. ≤1) | 1.885 (1.339–2.654) | <0.001 | 2.874 (2.076–3.979) | <0.001 |
| Stage (III–IV vs. I–II) | 1.525 (1.084–2.146) | 0.015 | 1.875 (1.356–2.592) | <0.001 |
| Risk score (high vs. low) | 2.863 (1.933–4.240) | <0.001 | 4.008 (2.774–5.790) | <0.001 |
| Primary dataset | ||||
| Gender (male vs. female) | 0.898 (0.572–1.410) | 0.641 | 0.867 (0.566–1.328) | 0.512 |
| Age (>60 vs. ≤60 years) | 1.540 (0.942–2.517) | 0.085 | 1.921 (1.210–3.048) | 0.006 |
| Subtype (non‐GCB vs. GCB) | 1.476 (0.893–2.440) | 0.129 | 2.445 (1.504–3.977) | <0.001 |
| ECOG (>1 vs. ≤1) | 1.886 (1.182–3.004) | 0.008 | 3.127 (2.015–4.852) | <0.001 |
| Stage (III–IV vs. I–II) | 1.841 (1.128–3.004) | 0.015 | 1.928 (1.223–3.039) | 0.005 |
| Risk score (high vs. low) | 4.578 (2.564–8.175) | <0.001 | 6.307 (3.604–11.035) | <0.001 |
Abbreviations: 95% CI, 95% confidence interval; ECGO, eastern cooperative oncology group score; GCB, germinal center B‐cell‐like; HR, hazard ratio.
3.5. Construction of the prognostic nomogram
A prognostic nomogram combining six‐RBP signature and OS‐related clinical factors was constructed to predict the probability of 1‐, 3‐, ‐and 5‐year OS in DLBCL patients (patients lacking complete clinical information were excluded) (Figure 6A). Patients with higher score indicated a poor outcome and six‐RBP signature contributed most to the survival. Concordance index (C‐index) of nomogram was 0.74 (95% CI = 0.703–0.777) for the entire dataset and 0.774 (95% CI = 0.727–0.821) for the primary dataset (Figure S3A). Calibration plots showed a similar performance for predicting 1‐, 3‐, and 5‐year survival as compared to the ideal model in entire (Figure 6B) and primary datasets (Figure S3B).
FIGURE 6.
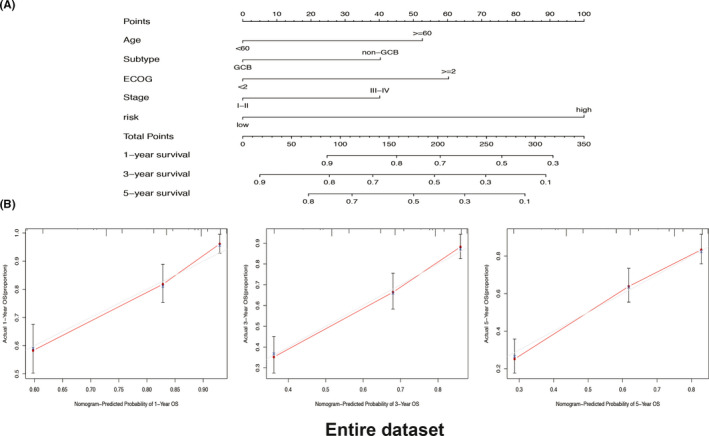
Construction and validation of a six‐RNA binding protein (RBP) signature‐based predictive nomogram in the entire dataset (N = 388) of GSE10846. (A) The six‐RBP signature‐based nomogram combining clinical risk factors for predicting 1‐, 3‐, and 5‐year survival of diffuse large B‐cell lymphoma patients. (B) Calibration curves of the nomogram for predicting 1‐, 3‐, and 5‐year survival
To compare the predictive power of compound nomogram and six‐RBP signature or clinical risk factors separately, we performed time‐dependent ROC curves analysis. For 3‐year survival prediction, AUC values of compound nomogram in the primary set (Figure 7A) and entire set (Figure 7B) were 0.820 and 0.780, respectively, which showed an obviously better predictive performance when comparing to the six‐RBP signature or clinical risk factors only. Similar performance was also observed in predicting 5‐year survival (Figure S4A,B). To sum up, our six‐RBP signature‐based nomogram had high prognostic predictive efficiency for DLBCL patients.
FIGURE 7.
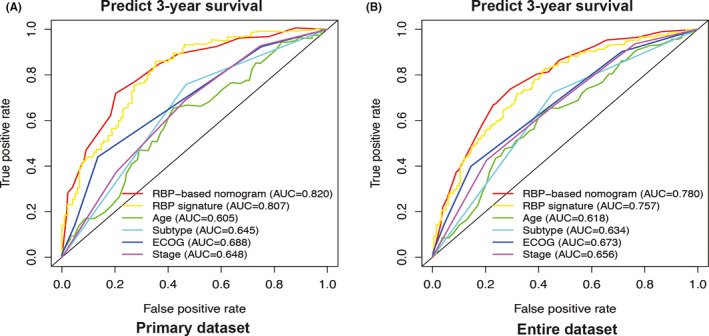
Estimate the prognostic accuracy of the six‐RNA binding protein (RBP) signature‐based nomogram to predict 3‐year survival in diffuse large B‐cell lymphoma (DLBCL) patients. Time‐dependent receiver operating characteristic curve analysis for clinical risk factors only, the six‐RBP signature, and six‐RBP signature combined with clinical risk factors for prediction 3‐year survival of DLBCL patients in the primary dataset (N = 199) and entire dataset (N = 388) of GSE10846
4. DISCUSSION
The significant heterogeneity of DLBCL is still remained challenging for clinicians in developing individualized treatments, patients with poor outcomes undoubtedly will suffer from great financial, health, and psychological problems. 1 Therefore, there is an urgent need for methods to better predict the prognosis of DLBCL patients and provide more effective interventions according to prediction results. RBPs regulatory networks mainly impact cancer development by altering various cancer‐associated downstream targets. 7 Once these networks were disturbed, they may cooperate with other primary carcinogenic hits to accelerate progression and increase the aggressiveness of tumor. 10 , 13 Recently increasing studies have demonstrated the important roles of RBP in hematological malignancy. hnRNP K had been identified as a bona fide oncogene and mitigating hnRNP K‐mediated c‐Myc activation could be a novel strategy for DLBCL patients. 8 Recurrent mutations in SRSF2 globally affected the RNA binding and splicing process, such as the hnRNP family of protein, resulting in poor clinical outcomes in myelodysplastic syndromes. 12 Considering the importance of RBPs regulatory networks in cancer progression and hematological malignancy, it is essential to clarify the association between RBP and DLBCL and to develop a RBPs‐related risk assessment system to predict the prognosis of DLBCL patients.
In this study, we primarily focused on the genomic pathogenesis of the RBPs in association with the development of DLBCL and patients' OS. Further bioinformatic analysis helped to elucidate the RBPs regulatory networks, as well as to identify the biological functions of these RBPs‐associated genes. We found that six RBPs, including CMSS1, MAEL, THOC5, PSIP1, SNIP1, and ZCCHC7, are significantly related to OS of DLBCL patients, which could potentially be served as prognostic biomarkers. DLBCL patients with high‐risk score had a poor prognosis than those with low‐risk score. ROC curve analysis of the six‐RBP signature showed a high AUC value in predicting 3‐ and 5‐year survival, respectively (0.798 and 0.744 in primary set, 0.735 and 0.711 in the entire set), confirming the reliability of gene signature. More importantly, we performed multivariate CPHR analysis and demonstrated that the six‐RBP signature can be used as a novel independent indicator for the prognosis of DLBCL patients.
RNA binding protein have the ability to bind and regulate a myriad of transcripts. Among the identified six RBP, THOC5, SNIP1, PSIP1, and ZCCHC7 were served as translation regulators. THOC5 is involved in the regulation of transcription factor expression and the processing and transport of mRNA, which has an important role in hematopoietic stem cells for survival. 14 , 15 , 16 , 17 THOC5 couples macrophage colony‐stimulating factor receptor signaling and contributes to macrophage and monocyte differentiation, suggesting the potential roles in the development of lymphoma. 18 , 19 , 20 Moreover, THOC5 phosphorylation is elevated in stem cells of CML patients, which may represent a novel strategy for CML therapy. 15 SNIP1 enhances c‐MYC transcription by regulating c‐MYC stability and is overexpressed in many tumors. 21 , 22 Dysregulation of c‐MYC is essential in the pathogenesis of a number of B‐cell lymphomas, including DLBCL. 23 SNIP1 also plays an important role in DNA damage response, cell viability, and proliferation during tumorigenesis. 24 The SNIP1 expression in DLBCL has not been directly addressed, future studies will help to clarify the association between SNIP1 and DLBCL. Studies also demonstrated an important role of PSIP1 in tumorigenicity by regulating the transcription of genes that control the cell cycle and tumor metastasis. 25 , 26 , 27 PSIP1 was also confirmed to be the target gene of miR‐155 in B‐cell lymphoma. 28 Of note, miR‐155 was frequently upregulated in B‐cell lymphoproliferative diseases (such as aggressive activated B‐cell‐like subtype of DLBCL), indicating the important roles of PSIP1 in DLBCL. 29 ZCCHC7 was found to have a putative role in human B cell development in adult bone marrow. 30 Downregulation of ZCCHC7 was correlated with acute lymphoblastic leukemia (ALL) children at a high risk to relapse, 31 similar to our data that low expression level of ZCCHC7 associated with poor outcome. Of note, recent studies reported that ZCCHC7 was the partner gene of MYC rearrangements in DLBCL. 32 MAEL is a novel cancer/testis‐associated gene, which is not only aberrantly expressed in various cancer tissues but also characterized as a tumor‐promoting factor through activating Akt and regulating the phosphorylation of nuclear factor kappa B. 33 , 34 The functions of CMSS1 were seldom studied; however, the upregulation of CMSS1 was an observer in immortalized cells, cancer cells, and non‐small‐cell lung cancer tissues. 35 Furthermore, GSEA analysis identified six‐RBP signature correlated signaling pathway and revealed that 17 pathways were enriched between high‐ versus low‐risk group, including the regulation of autophagy, CML, NOTCH signaling pathway, and B cell receptor signaling pathway. We suggested that the expression of six‐RBP might exert regulatory roles in these pathways. Of interest, the activation of autophagy was associated with high‐risk patients who had poor outcomes. Inhibition of autophagy might be the potential therapeutic target for DLBCL patients. Growing evidence supports that enhanced autophagy protects tumor cells from adverse conditions such as hypoxia and radiotherapy. 36 Autophagy inhibition may be beneficial to patients with lymphoma. 37 , 38 Recently, Gayle et al provide evidence that the disruption of lysosomal homeostasis and inhibition of the autophagy flux could be a novel approach to treat B‐cell non‐Hodgkin lymphoma. 39 NOTCH signaling pathway has been reported aberrantly activated in hematological malignancies, such as DLBCL and T‐cell ALL. 2 , 5 , 40 Moreover, NOTCH pathway mutations significantly altered downstream target genes, emphasizing the roles of this pathway in DLBCL. 5 Our analysis provided insight into the underlying mechanisms in the occurrence and development of DLBCL, which laid the foundation for further basic studies and might benefit from exploring novel intervention strategies.
We further constructed a compound prognostic nomogram combining RBP‐based gene signature with clinical factors. The nomogram model (AUC = 0.820 in primary set, AUC = 0.780 in the entire set) was superior to the RBP‐based gene signature and the clinical factors. Our newly developed model improved the prognostic predictive efficiency, which could be used to individualize the survival probability for patients and has the potential translation into clinical practice in the future.
There were some potential limitations in our study. Although our research is based on massive cohorts from the GEO databases to establish and validate RBPs‐related prognostic model, the present study nevertheless features a retrospective design. Thus, a well‐designed, prospective, international, multicenter clinical trial is needed to confirm our findings in the future. GSEA analysis will obtain different results if using different gene signatures on the basis of risk score for classification, the biological significance of identified pathways needs more studies to verify. Besides, more efforts should be channeled to investigate the molecular mechanism of the identified RBPs‐related genes during DLBCL progression.
In summary, we constructed for the first time a RBPs‐related risk prediction model, which had great potential on its application to predict DLBCL patients' survival. The present study also provides a potential biomarker for DLBCL screening and diagnosis, facilitating patient counseling and decision making. However, more studies are warranted to illuminate the contribution to the prognosis of DLBCL.
CONFLICT OF INTEREST
All authors declare no conflict of interest.
ETHICAL APPROVAL
This study does not contain any studies with human participants or animals performed by any of the authors, all analyses were based on public GEO databases.
AUTHOR CONTRIBUTIONS
Yizi He designed the study and revised the manuscript; Yongzhi Xie, Ximei Luo, Haiqing He, and Tao Pan collected, arranged, and analyzed the data; Yongzhi Xie provides the first draft of the manuscript. All authors reviewed and approved the final manuscript.
Supporting information
Fig S1
Fig S2
Fig S3
Fig S4
Table S1
Supplementary Material
ACKNOWLEDGEMENTS
This study is funded by the National Natural Science Foundation of China (82000200).
DATA AVAILABILITY STATEMENT
The datasets analyzed in this study can be found in the GEO database (https://www.ncbi.nlm.nih.gov/geo).
REFERENCES
- 1. Miao Y, Medeiros LJ, Li Y, Li J, Young KH. Genetic alterations and their clinical implications in DLBCL. Nat Rev Clin Oncol. 2019;16:634‐652. [DOI] [PubMed] [Google Scholar]
- 2. Schmitz R, Wright GW, Huang DW, et al. Genetics and pathogenesis of diffuse large B‐cell lymphoma. N Engl J Med. 2018;378:1396‐1407. [DOI] [PMC free article] [PubMed] [Google Scholar]
- 3. Cucco F, Barrans S, Sha C, et al. Distinct genetic changes reveal evolutionary history and heterogeneous molecular grade of DLBCL with MYC/BCL2 double‐hit. Leukemia. 2020;34:1329‐1341. [DOI] [PMC free article] [PubMed] [Google Scholar]
- 4. Herman SEM. The future of kinase inhibitors for DLBCL? Blood. 2018;131:2278‐2280. [DOI] [PMC free article] [PubMed] [Google Scholar]
- 5. Karube K, Enjuanes A, Dlouhy I, et al. Integrating genomic alterations in diffuse large B‐cell lymphoma identifies new relevant pathways and potential therapeutic targets. Leukemia. 2018;32:675‐684. [DOI] [PMC free article] [PubMed] [Google Scholar]
- 6. Pereira B, Billaud M, Almeida R. RNA‐binding proteins in cancer: old players and new actors. Trends Cancer. 2017;3:506‐528. [DOI] [PubMed] [Google Scholar]
- 7. Carotenuto P, Pecoraro A, Palma G, Russo G, Russo A. Therapeutic approaches targeting nucleolus in cancer. Cells. 2019;8:1090. [DOI] [PMC free article] [PubMed] [Google Scholar]
- 8. Gallardo M, Malaney P, Aitken MJL, et al. Uncovering the role of RNA‐binding protein hnRNP K in B‐cell lymphomas. J Natl Cancer Inst. 2020;112:95‐106. [DOI] [PMC free article] [PubMed] [Google Scholar]
- 9. Gerstberger S, Hafner M, Tuschl T. A census of human RNA‐binding proteins. Nat Rev Genet. 2014;15:829‐845. [DOI] [PMC free article] [PubMed] [Google Scholar]
- 10. Brinegar AE, Cooper TA. Roles for RNA‐binding proteins in development and disease. Brain Res. 2016;1647:1‐8. [DOI] [PMC free article] [PubMed] [Google Scholar]
- 11. Song Y, Gao F, Peng Y, Yang X. Long non‐coding RNA DBH‐AS1 promotes cancer progression in diffuse large B‐cell lymphoma by targeting FN1 via RNA‐binding protein BUD13. Cell Biol Int. 2020;44:1331‐1340. [DOI] [PubMed] [Google Scholar]
- 12. Liang Y, Tebaldi T, Rejeski K, et al. SRSF2 mutations drive oncogenesis by activating a global program of aberrant alternative splicing in hematopoietic cells. Leukemia. 2018;32:2659‐2671. [DOI] [PMC free article] [PubMed] [Google Scholar]
- 13. Newman R, McHugh J, Turner M. RNA binding proteins as regulators of immune cell biology. Clin Exp Immunol. 2016;183:37‐49. [DOI] [PMC free article] [PubMed] [Google Scholar]
- 14. Saran S, Tran DDH, Ewald F, et al. Depletion of three combined THOC5 mRNA export protein target genes synergistically induces human hepatocellular carcinoma cell death. Oncogene. 2016;35:3872‐3879. [DOI] [PubMed] [Google Scholar]
- 15. Griaud F, Pierce A, Gonzalez Sanchez MB, et al. A pathway from leukemogenic oncogenes and stem cell chemokines to RNA processing via THOC5. Leukemia. 2013;27:932‐940. [DOI] [PubMed] [Google Scholar]
- 16. Moon S, Chung YD. p53 and PI3K/AKT signalings are up‐regulated in flies with defects in the THO complex. Mol Cells. 2013;35:261‐268. [DOI] [PMC free article] [PubMed] [Google Scholar]
- 17. Pierce A, Carney L, Hamza HG, et al. THOC5 spliceosome protein: a target for leukaemogenic tyrosine kinases that affects inositol lipid turnover. Br J Haematol. 2008;141:641‐650. [DOI] [PubMed] [Google Scholar]
- 18. Tran DD, Saran S, Dittrich‐Breiholz O, et al. Transcriptional regulation of immediate‐early gene response by THOC5, a member of mRNA export complex, contributes to the M‐CSF‐induced macrophage differentiation. Cell Death Dis. 2013;4:e879. [DOI] [PMC free article] [PubMed] [Google Scholar]
- 19. Carney L, Pierce A, Rijnen M, et al. THOC5 couples M‐CSF receptor signaling to transcription factor expression. Cell Signal. 2009;21:309‐316. [DOI] [PubMed] [Google Scholar]
- 20. Murga‐Zamalloa C, Rolland DCM, Polk A, et al. Colony‐stimulating factor 1 receptor (CSF1R) activates AKT/mTOR signaling and promotes T‐cell lymphoma viability. Clin Cancer Res. 2020;26:690‐703. [DOI] [PMC free article] [PubMed] [Google Scholar]
- 21. Larsson L‐G. SNIP1: Myc's new helper in transcriptional activation. Mol Cell. 2006;24:811‐812. [DOI] [PubMed] [Google Scholar]
- 22. Fujii M, Lyakh LA, Bracken C, et al. SNIP1 is a candidate modifier of the transcriptional activity of c‐Myc on E box‐dependent target genes. Mol Cell. 2006;24:771‐783. [DOI] [PubMed] [Google Scholar]
- 23. Nguyen L, Papenhausen P, Shao H. The role of c‐MYC in B‐cell lymphomas: diagnostic and molecular aspects. Genes. 2017;8:116. [DOI] [PMC free article] [PubMed] [Google Scholar]
- 24. Bracken CP, Wall SJ, Barré B, Panov KI, Ajuh PM, Perkins ND. Regulation of cyclin D1 RNA stability by SNIP1. Can Res. 2008;68:7621‐7628. [DOI] [PMC free article] [PubMed] [Google Scholar]
- 25. Geiger R, Rieckmann JC, Wolf T, et al. L‐Arginine modulates T cell metabolism and enhances survival and anti‐tumor activity. Cell. 2016;167:829‐842.e13. [DOI] [PMC free article] [PubMed] [Google Scholar]
- 26. El Ashkar S, Schwaller J, Pieters T, et al. LEDGF/p75 is dispensable for hematopoiesis but essential for MLL‐rearranged leukemogenesis. Blood. 2018;131(1):95–107. [DOI] [PMC free article] [PubMed] [Google Scholar]
- 27. Singh DK, Gholamalamdari O, Jadaliha M, et al. PSIP1/p75 promotes tumorigenicity in breast cancer cells by promoting the transcription of cell cycle genes. Carcinogenesis. 2017;38:966‐975. [DOI] [PMC free article] [PubMed] [Google Scholar]
- 28. Slezak‐Prochazka I, Kluiver J, de Jong D, et al. Inhibition of the miR‐155 target NIAM phenocopies the growth promoting effect of miR‐155 in B‐cell lymphoma. Oncotarget. 2016;7:2391‐2400. [DOI] [PMC free article] [PubMed] [Google Scholar]
- 29. Sandhu SK, Croce CM, Garzon R. Micro‐RNA expression and function in lymphomas. Adv Hematol. 2011;2011:1‐12. [DOI] [PMC free article] [PubMed] [Google Scholar]
- 30. Hystad ME, Myklebust JH, Bø TH, et al. Characterization of early stages of human B cell development by gene expression profiling. J Immunol. 2007;179:3662‐3671. [DOI] [PubMed] [Google Scholar]
- 31. Núñez‐Enríquez JC, Bárcenas‐López DA, Hidalgo‐Miranda A, et al. Gene expression profiling of acute lymphoblastic leukemia in children with very early relapse. Arch Med Res. 2016;47:644‐655. [DOI] [PubMed] [Google Scholar]
- 32. Chong LC, Ben‐Neriah S, Slack GW, et al. High‐resolution architecture and partner genes of MYC rearrangements in lymphoma with DLBCL morphology. Blood Adv. 2018;2:2755‐2765. [DOI] [PMC free article] [PubMed] [Google Scholar]
- 33. Li P, Chen X, Qin G, et al. Maelstrom directs myeloid‐derived suppressor cells to promote esophageal squamous cell carcinoma progression via activation of the Akt1/RelA/IL8 signaling pathway. Cancer Immunol Res. 2018;6:1246‐1259. [DOI] [PubMed] [Google Scholar]
- 34. Li X‐D, Zhang J‐X, Jiang L‐J, et al. Overexpression of maelstrom promotes bladder urothelial carcinoma cell aggressiveness by epigenetically downregulating MTSS1 through DNMT3B. Oncogene. 2016;35:6281‐6292. [DOI] [PubMed] [Google Scholar]
- 35. Jung HM, Choi SJ, Kim JK. Expression profiles of SV40‐immortalization‐associated genes upregulated in various human cancers. J Cell Biochem. 2009;106:703‐713. [DOI] [PubMed] [Google Scholar]
- 36. Zheng Z, Wang L, Cheng S, Wang Y, Zhao W. Autophagy and lymphoma. Adv Exp Med Biol. 2020;1207:615‐623. [DOI] [PubMed] [Google Scholar]
- 37. Amaravadi RK, Yu D, Lum JJ, et al. Autophagy inhibition enhances therapy‐induced apoptosis in a Myc‐induced model of lymphoma. J Clin Investig. 2007;117:326‐336. [DOI] [PMC free article] [PubMed] [Google Scholar]
- 38. Alinari L, Mahoney E, Patton J, et al. FTY720 increases CD74 expression and sensitizes mantle cell lymphoma cells to milatuzumab‐mediated cell death. Blood. 2011;118:6893‐6903. [DOI] [PMC free article] [PubMed] [Google Scholar]
- 39. Gayle S, Landrette S, Beeharry N, et al. Identification of apilimod as a first‐in‐class PIKfyve kinase inhibitor for treatment of B‐cell non‐Hodgkin lymphoma. Blood. 2017;129:1768‐1778. [DOI] [PMC free article] [PubMed] [Google Scholar]
- 40. Puente XS, Pinyol M, Quesada V, et al. Whole‐genome sequencing identifies recurrent mutations in chronic lymphocytic leukaemia. Nature. 2011;475:101‐105. [DOI] [PMC free article] [PubMed] [Google Scholar]
Associated Data
This section collects any data citations, data availability statements, or supplementary materials included in this article.
Supplementary Materials
Fig S1
Fig S2
Fig S3
Fig S4
Table S1
Supplementary Material
Data Availability Statement
The datasets analyzed in this study can be found in the GEO database (https://www.ncbi.nlm.nih.gov/geo).