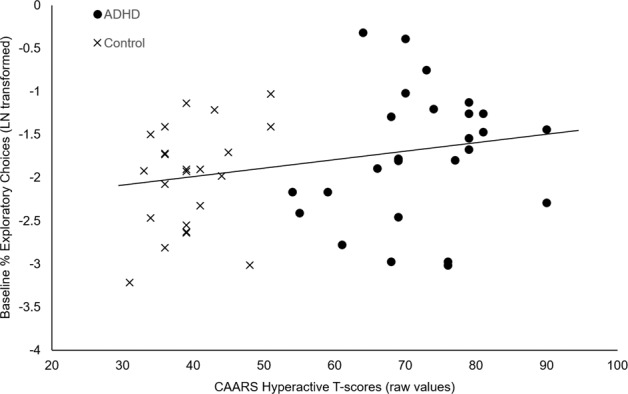
Fig. 3. Scatterplot between CAARS hyperactive T-score (raw data values) and baseline 6ABT percent exploratory choices (LN transformed data).

Multiple regression analysis indicated a significant association between hyperactive T-scores and exploratory choices, controlling for age and inattentive T-scores (β = 0.031, standard error = 0.013, p = 0.019).
