Abstract
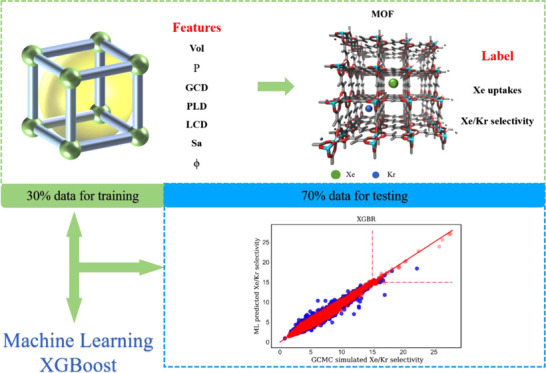
The inert gases Xe and Kr mainly exist in the used nuclear fuel (UNF) with the Xe/Kr ratio of 20:80, which it is difficult to separate. In this work, based on the G-MOFs database, high-throughput computational screening for metal–organic frameworks (MOFs) with high Xe/Kr adsorption selectivity was performed by combining grand canonical Monte Carlo (GCMC) simulations and machine learning (ML) technique for the first time. From the comparison of eight classical ML models, it is found that the XGBoost model with seven structural descriptors has superior accuracy in predicting the adsorption and separation performance of MOFs to Xe/Kr. Compared with energetic or electronic descriptors, structural descriptors are easier to obtain. Note that the determination coefficients R2 of the generalized model for the Xe adsorption and Xe/Kr selectivity are very close to 1, at 0.951 and 0.973, respectively. In addition, 888 and 896 MOFs have been successfully predicted by the XGBoost model among the top 1000 MOFs in adsorption capacity and selectivity by GCMC simulation, respectively. According to the feature engineering of the XGBoost model, it is shown that the density (ρ), porosity (ϕ), pore volume (Vol), and pore limiting diameter (PLD) of MOFs are the key features that affect the Xe/Kr adsorption property. To test the generalization ability of the XGBoost model, we also tried to screen MOF adsorbents on the CO2/CH4 mixture, it is found that the prediction performance of XGBoost is also much better than that of the traditional machine learning models although with the unbalanced data. Note that the dimension of features of MOFs is low while the quantity of MOF samples in database is very large, which is suitable for the prediction by model such as XGBoost to search the global minimum of cost function rather than the model involving feature creation. The present study represents the first report using the XGBoost algorithm to discover the MOF adsorbates.
1. Introduction
The noble gases xenon (Xe) and krypton (Kr) are widely used in industrial production and daily life due to their special physical and chemical properties. For instance, Xe can be used in commercial lighting,1,2 medical imaging,3 anesthesia,4,5 and neuroprotection,6,7 while Kr is widely used in the electronics industry, electric light source industry, as well as in gas lasers and plasma streams. The content of xenon and krypton in the atmosphere just covers a minor proportion, and they mainly exist in used nuclear fuel (UNF) with a Xe/Kr ratio of 20:80. The radioisotopes of 135Xe and 85Kr in the process of UNF reprocessing are significant gas fission nuclides,8 with strong radiation and important applications in nuclear fuel cycling9 and nuclear environmental monitoring. Note that Xe/Kr selective adsorption separation is also a key step in the reprocessing of the UNF.
At present, the inert gases Xe and Kr are generally produced through separation by large-scale air separation equipment, using cryogenic distillation separation according to the difference in the boiling points of Xe and Kr (the boiling points of Xe and Kr are 161.7 and 115.8 K, respectively). The large energy consumption and high cost greatly limit the applications of Xe and Kr, and the development of a novel separation method of Xe–Kr binary gas mixture under mild conditions has always been the focus. Compared to cryogenic distillation, the utilization of solid adsorbents to achieve gas adsorption and separation is environmentally more friendly and economical. However, the separation of Xe and Kr using traditional solid adsorbents such as zeolite and activated charcoal10−12 has poor adsorption selectivity and capacity, so scientists have been committed to the development of new adsorption materials.
Compared with traditional adsorption materials, metal–organic frameworks (MOFs) are nano-multifunctional pore materials emerged in the past two decades, which have a lot of advantages such as highly diverse crystal structures and adjustability of structural properties.13 In recent years, increasingly more works on the adsorption and separation of Xe and Kr14 have shown that MOF materials are much superior compared to traditional zeolite and activated charcoal in the adsorption and separation of Xe–Kr binary mixture.
High-throughput screening is an effective method to obtain high-performance materials, and it is also an effective method to deeply understand the structure–adsorption property relationship of candidate adsorption materials. Generally, high-throughput computational screening is carried out by molecular simulations in a database with a large number of material samples to rapidly predict the adsorption property on gases.15 So far, nearly 70 000 different MOFs have been synthesized, and there are also thousands of MOFs that have been predicted theoretically but have not yet been synthesized.16−19 In 2016, using molecular simulation and high-throughput screening among 120 000 MOFs, Banerjee et al.20 found that the Xe uptake and Xe/Kr selectivity of SBMOF-1 are very large at 1.39 and 16.00 mmol/g, respectively. In 2018, Gong et al.21 designed and synthesized Z11CBF-1000-2, with an improved Xe/Kr selectivity of 19.70, but the adsorption capacity of Xe is just 0.02 mmol/g. Due to the variety of MOFs and the large number of samples, high-throughput screening for high-quality MOFs is also an expensive and time-consuming process.
In recent years, with the coming of the era of Big Data, the importance of data-driven machine learning (ML) technique has been recognized by most of the people. Unlike traditional calculation methods, ML is based on statistics rather than solving physical equations, which can predict material properties quickly at a low cost.22 So far, ML-related models constructed by simple structural features of MOFs can predict material adsorption property quickly. For example, the Snurr group23 utilized mix logistic regression (MLR), least absolute shrinkage and selection operator (LASSO), and ridge models to establish the relationship between geometric structures of MOFs and hydrogen storage capacity and found that the LASSO model has a better description on the hydrogen storage in MOFs; with 20 000 different nanoporous materials on the selective adsorption of Xe/Kr as training data, Smit et al.24 utilized the random forest (RF) decision tree model to screen for the high-performance nanoporous separation materials in the testing set with 655 000 samples. However, the calculated mean-square error (MSE) is large, i.e., 1.41; in 2020, the Luo group25 predicted the adsorption of MOFs on H2 using the deep neural networks (DNN) model, whose transfer leads to an increase in the determination coefficient to 0.98 for the screening of MOF adsorption on CH4, but this transfer ML model failed to screen for Xe/Kr-separated MOFs, with the determination coefficient dropped from 0.92 to 0.41.
In this work, we tried to screen for the MOF selective adsorption of Xe/Kr based on the G-MOFs database (Material Genomic MOFs Database) self-assembled using MGPNM program.26 This database is available at: https://figshare.com/s/ec378d7315581e48f1e4. Note that for the first time the G-MOFs database is used for the screening for MOF selective adsorption of Xe/Kr. The relationship between MOF features and Xe/Kr selective adsorption property was established using ML algorithms, including ridge regression,27 LASSO,28 Elastic Net,29 Bayesian regression,30 support vector machine (SVM),31 artificial neural network (ANN),32 RF,33 and XGBoost.34 Finally, the XGBoost model with just structural descriptors successfully predicted 38 top MOFs of larger Xe/Kr adsorption selectivity and Xe uptake than recently reported SBMOF-120 and Z11CBF-1000-2,21 which overcomes the defects of random forest24 and transfer machine learning model.25 In addition, to test the generalization ability of the XGBoost model, we also tried to screen for MOF adsorbents on a more complex CO2/CH4 mixture and found that the prediction performance of XGBoost is also much better than that of the traditional machine learning models.
2. Computational Details
In this work, the high-throughput screening for MOFs selective adsorption of Xe/Kr was performed among the G-MOFs database. Note that totally 303 991 structures in G-MOFs are self-assembled using 17 different metal clusters and 9 functional groups connected by 32 different organic linkers with the Material Genomics program MGPN.26 To date, 162 thoroughly different MOF structures have been synthesized experimentally in G-MOFs.26
2.1. Grand Canonical Monte Carlo (GCMC) of Adsorption Simulation
Grand canonical Monte Carlo (GCMC)35,36 method with the μVT ensemble was applied to simulate the adsorption of Xe and Kr on MOFs. The absorbates are regarded as rigid molecules during the adsorption process at 298 K and 1 bar, with a 20:80 ratio of Xe/Kr as the real UNF environment. Several different types of motion of molecules are considered, including translation, regrowth, deletion, and exchange. The adsorption process involves only the nonbonding interactions, and the interaction between adsorbates and MOFs is calculated using the Lennard-Jones (LJ) potential in eq 1.
 |
1 |
where  and σij = σi + σj/2,
with σi and εi being the diameters with depth of i, with the cutoff distance of the LJ interaction at 14.0
Å. For every simulation process, totally 2 × 10⁷ cycles were performed with the former 1 × 10⁷ cycles
used to equilibrate system and the latter one used to calculate the
related thermodynamic properties. The UFF37 force field was applied to describe the atoms of adsorbent, while
the TraPPE38 force field was used for the
krypton and xenon atoms, which have been successfully employed to
describe the adsorption of Kr and Xe on MOF materials.39 Our group40,41 also utilized such
force fields to describe UTSA-280 and Mg-SBMOF-1 on the Xe/Kr selective
adsorption. The high-throughput GCMC simulations in this work were
performed with the HT-CADSS26 program.
For the adsorption and separation process, adsorption selectivity is an important parameter to judge the separation property. For the two-component gas mixture of Xe and Kr, the selectivity SXe/Kr can be expressed by eq 2
| 2 |
where x and y are the mole fractions of the adsorption-phase and volume-phase components, respectively.
The thermal stabilities of top MOF materials were evaluated using Forcite module42 in the Materials Studio program.43 The entire annealing process is increased from 300 to 1800 K in the NVT ensemble, with five cycles in five picoseconds.
2.2. Machine Learning
2.2.1. Selection of Descriptors
Generally, ML model can predict objective property with continuous data of features. The structural parameters of MOFs including seven different features [large cavity diameter (LCD), pore limiting diameter (PLD), global cavity diameter (GCD), pore volume (Vol), density (ρ), specific surface area (Sa), and porosity (ϕ)] were calculated with the Zeo++ 0.344 software.
From the histograms of the relationship between adsorption property (Xe uptake and Xe/Kr selectivity) and physical parameters as plotted in Figure S1, it is shown that the seven structural parameters [LCD, PLD, GCD, Vol, ρ, Sa, and ϕ] of MOFs in the G-MOFs database have a wide continuous distribution as plotted in Figure S1a–g, respectively, which may be used as the input variable features of the ML model.
For the ML technique, the effectiveness and relevance of descriptors will directly determine the accuracy of the model. Generally, descriptors (features) should possess the following three characteristics:45 (1) correlation with the output to some extent; (2) the lowest possible dimension; and (3) easy to obtain. The suitable features can be selected by calculating the Pearson correlation coefficient46 according to eq 3
| 3 |
where xi and yi represent two different features, and x̅ and y̅ represent the mean values of different features, respectively. Note that the Pearson correlation coefficients of r is between −1 and 1. When r takes a negative value, the feature shows a negative correlation to target property; when it takes a positive value, the feature shows a positive correlation. The absolute value of r locates between 0.5 and 1, which represents a strong correlation, while that between 0.3 and 0.5 represents medium correlation; the absolute values of r between 0.1 and 0.3 as well as less than 0.1 denote weak correlation or no correlation.
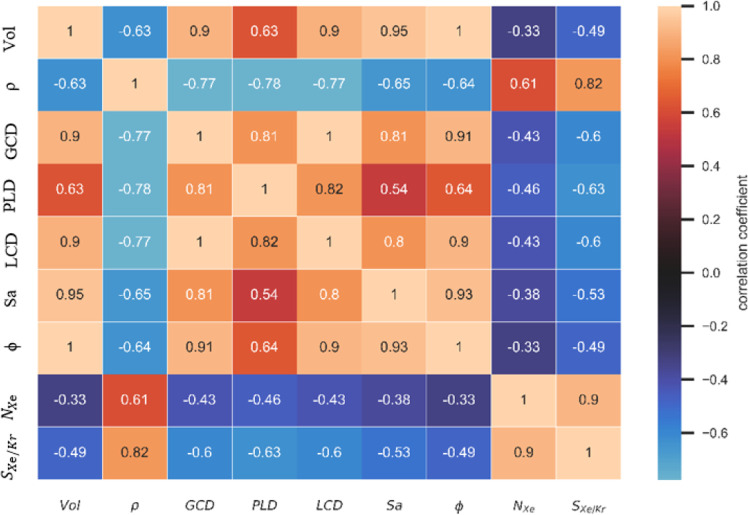
We initially tested the correlation between the physical parameters and the gas adsorption property of MOFs to screen for the features from the correlation diagram as shown in Figure 1. For the adsorption capacity of Xe or selectivity of Xe/Kr, the above-mentioned seven physical parameters have moderate correlation with the Pearson correlation coefficients of r greater than 0.33 to the adsorption capacity of Xe and strong correlation with r greater than 0.58 to Xe/Kr selectivity, which meet the requirement as descriptors as input data.
Figure 1.
Correlation diagram of material features and adsorption properties of Xe/Kr based on the G-MOFs database. Note that the color bars represent the size of the Pearson correlation coefficients.
2.2.2. Algorithm Selection and Evaluation
The data trained in the training set is a mapping from the structures to the adsorption property of the MOFs to find an objective function that can accurately predict the adsorption property in the testing set. Our dataset is composed of continuous input of physical parameters and output corresponding to the adsorption properties of MOFs including Xe uptake and Xe/Kr selectivity. Therefore, we tried to build supervised learning models using ridge regression, LASSO, Elastic Net, SVM, Bayes regression, ANN, RF, and XGBoost.
The criteria to evaluate the quality of the regression model are mean-square error (MSE), mean absolute error (MAE), root-mean-square error (RMSE), and determination coefficient R2 as expressed in eqs 4–6, respectively
| 4 |
where M represents the quantity of samples, ŷ represents the estimated value by the model, and MSE stands for the expectation of the square of the difference between the true value47 and the estimated value. The larger the MSE value, the worse the prediction.
| 5 |
where MAE represents the difference between the true value and the estimated value. The larger the MAE value, the worse the prediction.
where RMSE represents the difference between the true value and the estimated value under the root sign. The larger the RMSE value, the worse the prediction and the RMSE is more sensitive to outliers.
For adsorption capacity, the units of MSE, MAE, and RMSE are mmol2/g2, mmol/g, and mmol/g, respectively.
| 6 |
where ŷ represents the true value and y̅ denotes the average of the true value. Note that the numerator of the expression is the sum of the squared difference between the true value and the predicted value, while the denominator represents the difference between the true value and the average value. The closer is the determination coefficient R2 to 1, the better is the performance of the predicted result. When R2 in the testing set is much larger than that in the training set, the model is considered as overfitting, otherwise, it is an underfitting model; note that when the division of the testing set is classified properly, the R2 value in the training set is larger than that in the testing set. These three parameters were utilized to evaluate the performance of models, where R2 is the primary criterion, while MAE, MSE, and RMSE are the auxiliary ones.
The choice of different ML models has a great influence on the final prediction effect, but a few researchers elaborated on the advantage and disadvantage of different ML models, which brings inconvenience of their application.
3. Results and Discussion
3.1. Evaluation of Different Machine Learning Models
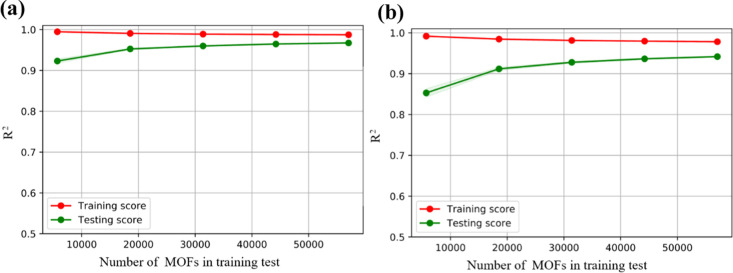
To verify the reliability of the different models, the GCMC simulations of Xe uptakes and Xe/Kr selectivity were performed on all MOF samples as plotted in Figure S2. It is found that almost all MOFs have the Xe/Kr selectivity over 1, indicating that most of the MOFs prefer to adsorb Xe rather than Kr, which is also in line with our purpose to discover the MOFs selective adsorption of Xe in UNF. Note that seven structural features were selected as descriptors for training from the calculations of Pearson correlation coefficient. The present strategy aims at minimizing the training set and maximizing the testing set to build the model. At the same time, it is of significance to extract the subset of the overall distribution from all of the samples as the training set, which thus can be used to represent the overall distribution. According to the learning curve in Figure 2, we found that accompanied by the increase of training set data, the R2 value on the testing set increases gradually, while the degree of overfitting of the model decreases gradually. When using 30% data as the training set, the degree of overfitting of the model to the adsorption properties is below 5%. According to the above strategy and the adsorption property calculated by GCMC, 30% of the samples are used as the training set and the remaining 70% of the samples are included in the testing set. Therefore, the sampling method ensures that our training set materials fully cover our seven-dimensional feature space. In this principle, eight different models including ridge regression, LASSO, Elastic Net, SVM, Bayesian regression, ANN, RF, and XGBoost with seven descriptors were tested by the fivefold cross-validation, grid search, and hyperparameter tuning in the training set, with the relevant data of R2, RMSE, MSE, and MAE listed in Table S1. The parity plots representing the predicted and simulated adsorption selectivity and capacity of MOFs data for the above models are shown in Figure S3a–h as (x – 1) and (x – 2), respectively.
Figure 2.
Adsorption properties learning curve with increased training set data volume. Red represents the R2 value of the training set, while green represents the R2 value of the testing set for (a) Xe/Kr selectivity and (b) Xe uptake.
As for the linear models, the R2 of LASSO and ridge regression are both close to 0.688, as listed in Table S1, indicating that the data possess few linear characteristics, as verified by the parity plots of Figure S3a,b, respectively. Note that the effect of improved LASSO and ridge regression models with the addition of L1 and L2 paradigms of the linear regression model is approximately equal to the Elastic Net model. However, the R2 value of the Elastic Net model is just 0.687, as shown in the parity plot of Figure S3c, indicating that the regularization coefficient has no great influence on the model. Tuning on the L1 and L2 paradigms has no apparent effectiveness on features. Thus, the linear model is not suitable for the G-MOFs database.
As for nonlinear models, the R2 value of the SVM regression model is just 0.660 with the relevant parity plots shown in Figure S3d. Note that this model performs very well on a small number of samples in high-dimensional space, which extremely depends on the selection of the kernel function. When the sample amount is relatively large, the effect of the model plummets. Note that the current dataset is characteristic of low dimension with a large data volume, thus leading to the poor performance of the SVM model; for the Bayesian regression model, the calculated R2 value is 0.687, as shown in Table S1 and the parity plots of Figure S3e. The Bayesian model can fit the data of small-scale samples well to obtain the probability distribution of the test data rather than specific values. However, when the data increases to a large amount such as more than 300 000 in G-MOFs, the model reduces the influence of the distribution to a linear one. Therefore, this model is not suitable for the large amount of data in the G-MOFs database.
As for the ANN model of deep learning, the determination coefficient R2 reaches 0.831 with the relevant parity plots shown in Figure S3f. Note that two hidden layers are used to train and build the ANN model after feature selection and adsorption performance mapping. It is shown that the model has high accuracy and weak dependence on the data structure. However, the training procedure of this model generates massive combined features and thus reduces the model interpretability, leading to difficulty in judging the effect of physical parameters on the adsorption property. As for the RF model, the determination coefficient R2 reaches 0.933 with the parity plots shown in Figure S3g. Note that the RF model consists of a large number of individual decision trees, where each tree will issue a category prediction, and the category with the most votes will be the prediction of our model. But when there are repetitive values in some feature of MOFs leading to a lot of noises in the dataset, RF cannot accurately predict the values of the objective function.
However, note that the determination coefficient R2 of the XGBoost model for Xe adsorption and Xe/Kr selectivity reaches 0.951 and 0.973, with MSE at just 0.003 and 0.065, MAE at just 0.029 and 0.147, and RMSE at just 0.055 and 0.255 in the testing set, respectively, as listed in Table S1 and shown in the parity plots of Figure S3h. For the XGBoost model, we carried out fivefold cross-validation and grid search to tune the hyperparameters. The main parameters optimized by XGBoost model are eta (0.1), max_depth (10), min_child_weight (0.5), and subsample (0.8). From the statistical point of view, the prediction performance of the XGBoost model is much superior to the above ones.
Note that XGBoost is an algorithm based on boosting tree, with a regularization term added to the optimization objective function, which is described according to eq 7
| 7 |
Among them, Ψ represents the objective function, yi represents the input value of the data, f(Xi) stands for prediction value, and N represents the number of features. In addition, to prevent the overfitting, the XGBoost model is performed using regularization with γ and λ as regularization coefficients controlling the complexity of the model and the output of the objective function. When γ and λ are both equal to 0, the model has only the same loss function as the objective function. Lm represents the number of leaf nodes and ωm represents the influence of the mth leaf node on the model. Note that the addition of a regularization coefficient will not improve the accuracy but prevents the model from overfitting in the iterative process.
The XGBoost model uses second-order Taylor approximation of the loss function and speeds up the process of searching for the global minimum through the first and second derivatives of loss function. The specific derivation can be found in the related literature.48
Compared with other ML models, the better performance of the XGBoost in predicting adsorption of MOFs is not only due to the addition of the regularization coefficient in the cost function and the second-order Taylor expansion of the cost function to overcome the overfitting but also with just the easily available structural descriptors we can achieve accurate prediction of adsorption properties. Note that these structural features do not have a very strong correlation with the adsorption properties, while Ridge, Lasso, Elastic Net, Bayesian, and ANN models cannot predict accurately without strong correlation characteristics.
In summary, the R2 value of the testing set of the XGBoost model for Xe adsorption and Xe/Kr selectivity prediction is close to 1 and much larger than those of the other models. MAE, MSE, and RMSE are also close to 0, which meets the requirement of an excellent regression model. Therefore, we finally chose the XGBoost model with seven structure descriptors to predict MOFs with selective adsorption property of Xe/Kr in the following.
3.2. Construction and Verification of XGBoost Model
The 30% and the remaining 70% MOF samples are selected as the training and testing sets, respectively, as listed in Table S1. We just included the seven structural descriptors including LCD, PLD, GCD, Vol, ρ, Sa, and ϕ.
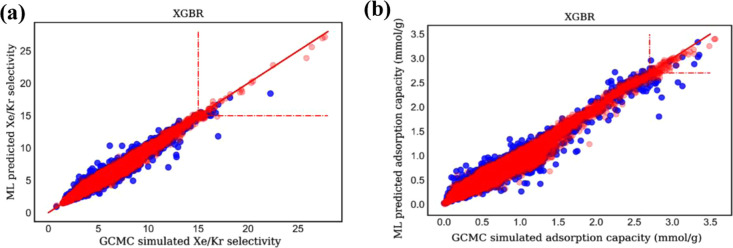
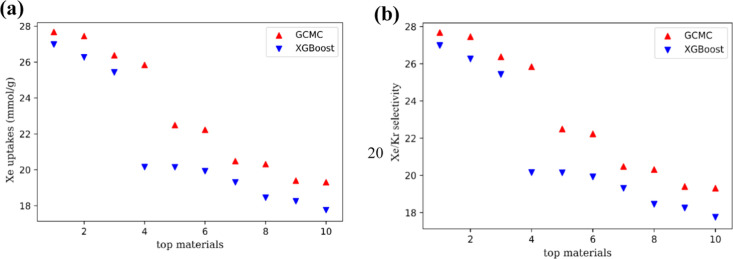
Through fivefold cross-validation, grid search, and hyperparameter tuning of the training set, it is found that when the XGBoost model is constructed with structural descriptors, the determination coefficients R2 of the adsorption capacity of Xe and the selectivity of Xe/Kr in the training set are 0.976 and 0.986, with RMSE at 0.032 and 0.182, respectively, while the determination coefficients are 0.951 and 0.973, with RMSE at 0.055 and 0.255 for the testing set, respectively. Obviously, there is also no overfitting or underfitting for the XGBoost model with the effect, as shown in the parity plots of Figure 3a,b, respectively. In addition, the predicted top 10 MOFs in Xe/Kr selectivity are completely consistent with those screened out by GCMC simulations, as shown in Table 1 and the parity plots of Figure 4a,b, respectively. Note that the top 2 MOFs in selectivity predicted by the model are the same as those by GCMC simulations in sequence, corresponding to Al2O6-fum_B_No3 and Al2O6-ADC_B-fum_B_No112. The adsorption property differences of these two MOFs between the GCMC simulations and prediction by the XGBoost model were compared as listed in Table 1 and Figure 4, respectively. Note that the simulated Xe/Kr selectivities of the two MOFs are 27.68 and 27.45, respectively, while the model predicted selectivities of the two MOFs to Xe/Kr are 26.98 and 26.26, with relative errors to those of GCMC simulations just 2.53 and 4.34%, respectively. In addition, the predicted adsorption capacities for Xe of the three MOFs are 2.49 and 2.44 mmol/g, with the relative errors at just 0.28 and 1.77%, respectively. To learn the stability of top 2 materials including Al2O6-fum_B_No3 and Al2O6-ADC_B-fum_B_No112, we carried out simulation annealing and found that at 1600 K, they still keep the stable structures without collapse. The calculated Henry coefficients of these top 2 materials for Xe are 24.77 and 26.23 mmol g–1 bar–1, respectively. The Henry selectivities for Xe/Kr are 22.76 and 27.36, indicating that these two materials have remarkable desorption properties.
Figure 3.
Parity plots for training and testing sets data from the G-MOFs database using XGBoost model for the (a) Xe/Kr selectivity and (b) Xe uptake at 1 bar and 298 K. Each dot represents one MOF structure from the G-MOFs database. The red and blue dots represent the training set and testing set data, respectively.
Table 1. Comparison of Xe/Kr Adsorption Property of Top 10 Materials between GCMC Simulations and XGBoost Model Predictiona.
| XGBoost |
GCMC |
RE (%) |
||||
|---|---|---|---|---|---|---|
| MOFs | Nxe | SXe/Kr | Nxe | SXe/Kr | Nxe | SXe/Kr |
| Al2O6-fum_B_No3 | 2.490 | 26.98 | 2.483 | 27.68 | 0.28 | 2.53 |
| Al2O6-ADC_B-fum_B_No112 | 2.437 | 26.26 | 2.481 | 27.45 | 1.77 | 4.34 |
| Al2O6-ADC_B-fum_B_No107 | 2.599 | 25.43 | 2.804 | 26.37 | 7.31 | 3.56 |
| Al2O6-ADC_B-fum_B_No102 | 2.544 | 20.15 | 2.837 | 25.84 | 10.33 | 22.02 |
| Al2O6-fum_B_No6 | 2.589 | 20.14 | 2.680 | 22.49 | 3.40 | 10.45 |
| Al2O6-ADC_B-fum_B_No100 | 2.377 | 19.92 | 2.617 | 22.23 | 9.17 | 10.39 |
| CuN4-SiF6-irmof20_No1 | 2.155 | 19.31 | 2.657 | 20.48 | 18.89 | 5.71 |
| ZnN4-SiF6-irmof20_No5 | 1.983 | 18.45 | 2.657 | 20.31 | 25.37 | 9.16 |
| Al2O6-fum_B-irmof6_B_No27 | 2.374 | 18.25 | 2.056 | 19.40 | 15.47 | 5.93 |
| Al2O6-BDC_B-fum_B_No125 | 2.269 | 17.76 | 2.172 | 19.31 | 4.47 | 8.03 |
Note that the uptakes of NXe are in mmol/g. RE = |(GCMC – XGBoost)|/GCMC × 100%.
Figure 4.
Schematic plots with comparison of top 10 materials between GCMC simulation and XGBoost prediction on (a) Xe/Kr selectivity and (b) Xe uptake.
From Table 2, it is found that 8 MOFs in the G-MOFs are better than Z11CBF-1000-2 and 38 MOFs are better than SBMOF-1 in both adsorption capacity and selectivity. Note that the Xe/Kr adsorption selectivities and Xe capacities of SBMOF-120 and Z11CBF-1000-221 are 16, 19.70 and 1.39, 0.02 mmol/g, respectively. Meanwhile, from GCMC simulations, we found that 30 of such 38 MOFs have been covered in the testing set. We referred Woo’s work,49 by comparing the top 1000 MOFs predicted by the XGBoost model with GCMC simulations, and found that XGBoost-predicted 888 MOFs are in the range of GCMC-simulated top 1000 ones in Xe adsorption capacity and the predicted 896 MOFs are among the GCMC-simulated top 1000 ones in Xe/Kr selectivity as listed in Table 3, both accounting for almost 90%. Therefore, the present XGBoost model with seven descriptors can accurately predict the high-performance MOFs selective Xe/Kr.
Table 2. Predicted MOFs Based on G-MOFs Have Better Performance on Selective Adsorption Separation Xe/Kr compared with SBMOF-1 and Z11CBF-1000-2a.
| adsorption
property |
|||
|---|---|---|---|
| MOFs | SXe/Kr | Nxe | SXe/Kr and NXe |
| SBMOF-1 | 38 | 1169 | 38 |
| Z11CBF-1000-2 | 8 | 190 191 | 8 |
Note that SXe/Kr represents Xe/Kr selectivity, while Nxe represents Xe adsorption.
Table 3. Number of Top XGBoost Prediction Property Out of N Thousand that in the GCMC Top 1000 Materials.
| 1000 | 2000 | 3000 | 4000 | 5000 | |
|---|---|---|---|---|---|
| S(Xe/Kr) | 896 | 974 | 996 | 999 | 1000 |
| N(Xe) | 888 | 972 | 993 | 996 | 1000 |
The XGBoost model was developed by the Guestrin group34 in 2016, which has quickly become well known in the ML-related competitions and now widely used in the fields of diagnosis and materials due to its fast and accurate characteristics. For example, the Ni group50 tried four different regression models, taking the atomic volume, mass density, unit cell volume, and lattice type of the crystal materials as features, and accurately predicted the thermal conductivity of the crystal materials; the Karanicolas group51 built a drug scoring function based on the XGBoost model, which is much higher than the traditional scoring function, and successfully found the novel targeted drugs for AChE. As the gas adsorbents, features of MOF sample are in low dimension, and it is suitable to use a model that can accurately search for the global minimum of the cost function, rather than the model involving feature creation. Note that covalent organic frameworks (COFs) and zeolites are also materials with low-dimensional structural features. We hope the present XGBoost model just with structural descriptors may assist the screen and design not only MOF adsorbents but also other porous material adsorbents such as covalent organic frameworks (COFs) and zeolites in future. Thus, the XGBoost model stands out from the comparison with different ML algorithms including transfer machine learning25 and random forest24 models due to its excellent performance, although which has not been reported in the field of discovery of materials for gas adsorption separation. Compared with screening for MOF adsorbents using features of AP-RDF49 and Qst,52 the present XGBoost model successfully found the high-performance MOF adsorbents just using structural descriptors.
3.3. Influence of Structural Features on Adsorption Performance
To understand the impact of different structural parameters of MOFs on the Xe/Kr adsorption property, we also compared the weight coefficients of different features on the Xe adsorption capacity and Xe/Kr selectivity in the XGBoost model by the histogram as plotted in Figure 5, and it is shown that the features that significantly affect both the Xe uptake and Xe/Kr selectivity are Vol, ρ, ϕ, and LCD.
Figure 5.
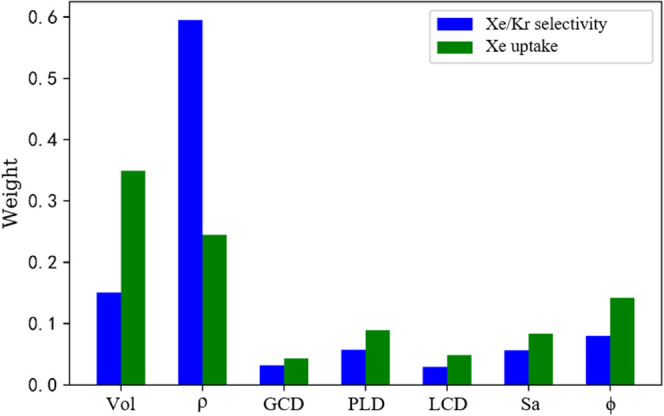
Histogram of the influence of seven structural features in the XGBoost model.
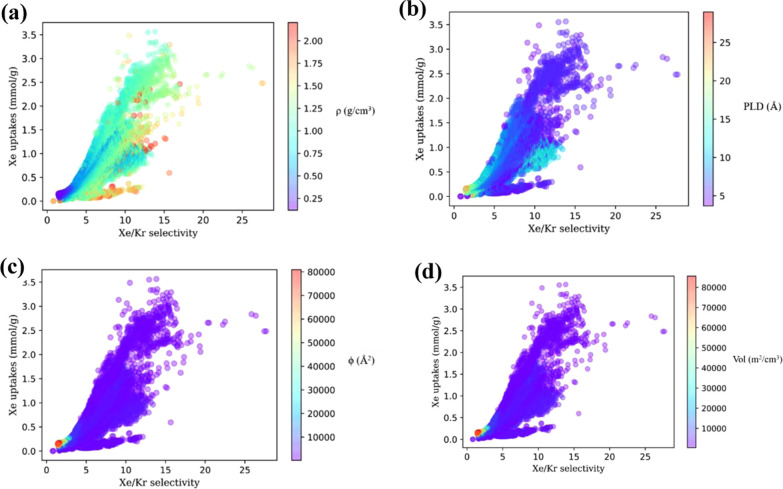
To explore the range of the four features corresponding to the optimal adsorption property, we plotted features–adsorption property relationship in parity plots, in Figure 6a–d. It is shown that the density (ρ) of the MOF corresponding to large Xe/Kr selectivity and Xe adsorption capacity is about 1.0, while the other three features are negatively correlated to the adsorption property.
Figure 6.
Schematic scatter plots of the four main structural features that influence the Xe uptake and Xe/Kr selectivity, including (a) ρ, (b) ϕ, (c) Vol, and (d) PLD of MOFs.
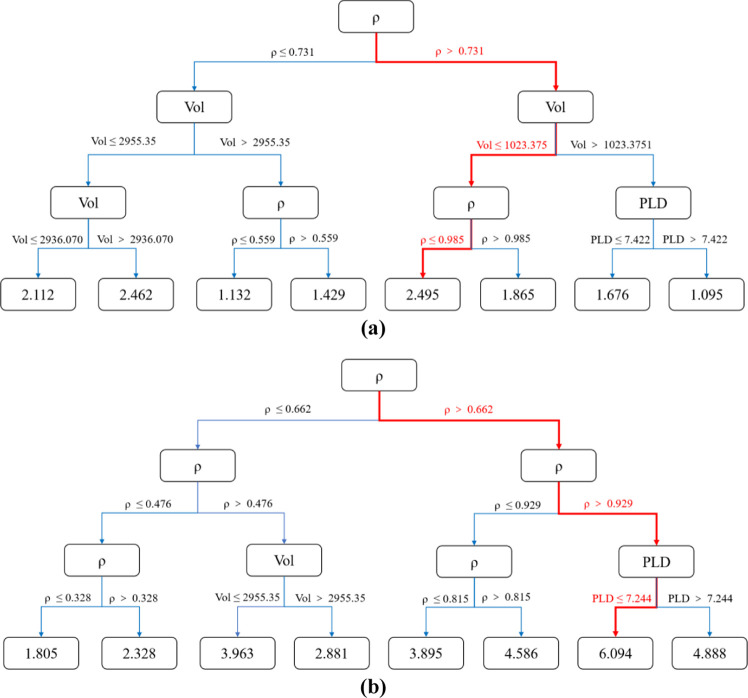
To find the specific ranges of the four features [including Vol, ρ, ϕ, and LCD] that affect the adsorption property, we utilized the regression decision tree53 scheme and three different datasets were used to train the decision tree model. The datasets of all MOFs are defined as Class A, while those of selectivity larger than 10 and uptakes larger than 1 mmol/g are defined as Class B, which represents promising materials with large Xe/Kr selectivity; after excluding Class B from Class A, the remaining section is defined as Class C, representing poor performing MOFs with low Xe/Kr selectivity and uptakes. Through fivefold cross-validation, grid search, and hyperparameter selection of regression tree model, the data of the three types of MOFs are analyzed as collected in Table S2, and we can find that deferent from Class A and B, there is no overfitting for Class C materials within the decision tree model, with the MSEs for the Xe uptakes and Xe/Kr selectivity at just 0.204 and 1.718, respectively. Therefore, we choose Class C as the dataset of the decision tree model. The regression model with a maximum depth of 3 is used to describe the data, and the maximum adsorption capacity and selectivity are selected as high-quality adsorption criteria through the corresponding tree model, as plotted in Figure 7. Note that the maximum average adsorption capacity for the tree with 376 samples is 2.495 mmol/g, corresponding to the volume (Vol) less than 1023.375 m2/cm3 and the density (ρ) between 0.731 and 0.985 g/cm3 as plotted in Figure 7a. In addition, when the density (ρ) of the materials is larger than 0.929 g/cm3 and the PLD is less than 7.244 Å, 15 281 samples with a large average selectivity of 6.094 were screened as plotted in Figure 7b.
Figure 7.
Influence of the four main structural features including ρ, ϕ, Vol, and PLD of MOFs on (a) Xe uptake and (b) Xe/Kr selectivity, under the decision tree model.
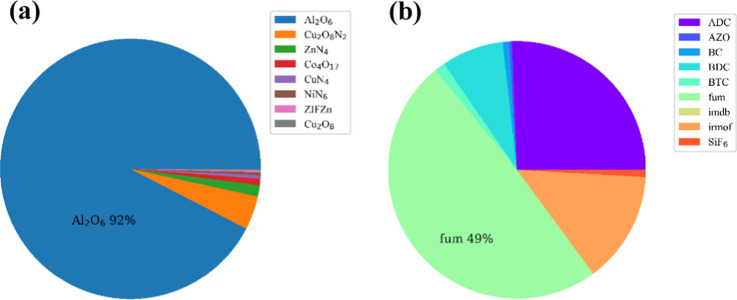
To investigate the effect of the different metal centers and organic ligands on the adsorption property, the GCMC-simulated top 500 MOFs in Xe adsorption capacity or Xe/Kr selectivity were screened out, and it is found that there is an intersectional part of 602 different materials with the proportions of the metal centers and organic ligands of each adsorption material represented in a pie chart, as shown in Figure 8a,b, respectively, where the weight of every metal center and ligand is set as 1.0 for statistics, while the weight of dual ligands is set as 0.5. In the G-MOFs database assembled by the HT-CADSS program, it is shown that almost all of the materials with good adsorption and separation property for Xe/Kr contain Al2O6 cluster and FUM ligand as shown in Figure 8a,b. It is noted that Al2O6-fum_B_No3 is combined by Al2O6 cluster and FUM ligand, corresponding to the largest Xe/Kr adsorption selectivity and Xe uptakes at 21.99 and 2.52 mmol/g.
Figure 8.
Pie chart of the structural characteristics of the top 500 MOFs in Xe uptake and Xe/Kr selectivity: (a) the proportion of different metal cluster and (b) the proportion of different organic ligands.
3.4. Model Generalization
To learn the application range of the XGBoost model, we decide to screen for adsorbent on other gas mixture in G-MOFs. Note that coal is usually gasified under high temperature and high pressure to produce a large amount of mixed gas, mainly composed of CO2 and CH4, with the gas content ratio of about 1:1.54 The capture of carbon dioxide before combustion can effectively improve the utilization of methane. Therefore, it is very important to find suitable MOF materials to selectively capture CO2 in CH4. The screening of MOFs adsorptive separation from Xe/Kr to CO2/CH4 is just a process from simple to complex mixture, which can further reflect the suitability of our ML model.
With the ratio of CO2/CH4 in mixture at 50:50, the adsorption on MOFs was simulated with GCMC method at 298 K and 1 bar using the same method as in Xe/Kr. Note that the best separation material in the G-MOFs database is Zn2O8-BTC_B-irmof7_A_No16,26 corresponding to the selectivity of CO2/CH4 at 50.5 and uptake of CO2 at 4.0 mmol/g, which is lower than SAJFEO with the CO2/CH4 selectivity at 210.33 and uptake of CO2 at 6.31 mmol/g.55 Through the data analysis as listed in Table S3, we found that the calculated adsorption properties in G-MOFs datasets are obviously imbalanced, especially for the adsorption selectivity of CO2/CH4. For the machine learning model, a good dataset is that the number of positive samples basically equals that of the negative ones. The imbalanced data refer to the large gaps of cost function among the large number of samples. In the data of MOFs selective adsorption of CO2/CH4, there are a few highly selective materials. This will be biased toward the low selectivity range, which is not beneficial to the prediction of materials. As for Xe/Kr adsorption selectivity, there is no obvious imbalance problem for the data in the G-MOFs database. The XGBoost model can define the ratio of different data and overcome the problem of imbalance from the perspective of adsorption characteristics. Based on the adsorption data of G-MOF to CO2/CH4, we initially tested the correlation between the physical parameters and the gas adsorption property on MOFs of CO2/CH4 with the correlation diagram as shown in Figure S4. For the adsorption capacity of CO2 or selectivity of CO2/CH4, seven physical parameters including LCD, PLD, GCD, Vol, ρ, Sa, and ϕ are moderately correlated to adsorption property with Pearson correlation coefficients of r greater than 0.3, which is the same as that of the Xe/Kr system.
The seven material features [including LCD, PLD, GCD, Vol, ρ, Sa, and ϕ] were also used as descriptors with samples in the training set:testing set at 30:70 to build the model, and the fivefold cross-validation and grid search method is used to tune the hyperparameters of the model. The prediction of the G-MOFs database of CO2/CH4 adsorption performance is depicted in the parity plots shown in Figure S5a,b, respectively. From Table S4, it is found that the determinant coefficients R2 XGBoost model for selectivity and uptake of CO2 are 0.6836 and 0.8817, respectively, which are much larger than those of other models, indicating that the prediction accuracy in the adsorption property of XGBoost is much better than traditional machine learning models, including Ridge, LASSO, Elastic Net, SVM, Bayesian, ANN, and RF, although the prediction performance is not as good as Xe/Kr adsorption separation.
4. Conclusions
In this work, a high-throughput screening for MOFs selective adsorption of Xe/Kr in the G-MOFs database with more than 300 000 materials was performed using GCMC simulations and machine learning technique for the first time. It is found that the XGBoost model with structural descriptors can successfully predict the top materials with the high adsorption selectivity of Xe/Kr.
Based on seven structural parameters [including LCD, PLD, GCD, Vol, ρ, Sa, and ϕ] of MOFs, eight machine learning models, including ridge regression, LASSO, Elastic Net, SVM, Bayesian regression, ANN, RF, and XGBoost, were tried to predict the adsorption and separation property for Xe/Kr within the G-MOFs database. Compared with energetic or electronic descriptors, structural descriptors are easier to obtain. With 30% of training set and 70% of testing set of the samples, it is found that the XGBoost is the optimal model in predicting the adsorption capacity of Xe and selectivity of Xe/Kr for MOFs. For example, the determination coefficient R2 in the testing set of Xe adsorption capacity and Xe/Kr selectivity are 0.951 and 0.973 for the testing set. In addition, the XGBoost model successfully predicted top 8 MOFs with higher adsorption capacity and selectivity than Z11CBF-1000-2, and 38 MOFs are better than SBMOF-1. For the top 2 MOFs in selectivity including Al2O6-fum_B_No3 and Al2O6-ADC_B-fum_B_No112, the predicted Xe/Kr selectivities are 26.97 and 26.26, respectively, which are close to the GCMC-simulated 27.68 and 27.45, respectively. In addition, the XGBoost feature engineering showed that four features, including ρ, ϕ, Vol, and PLD, mainly determine the high-performance MOFs selective adsorption of Xe/Kr. By verifying the model through a more complex CO2/CH4 mixture, we found that even if there exists the imbalanced problem of data, the prediction performance of XGBoost is still much better than those of the traditional machine learning models.
As gas adsorbents, features of MOF material are continuous data in low dimension, it is suitable to use a model like XGBoost that can accurately search for the global minimum of the cost function, rather than the model involving feature creation. This work represents the first machine learning study using the XGBoost model for the screening of MOF gas adsorbents, which is better than the other ML models including the formerly used transfer machine learning33 and random forest model.25 We hope the present XGBoost model just with structural descriptors may assist the screen and design not only MOF adsorbents for Xe/Kr in UNF but also other gas mixture adsorbents among porous materials such as covalent organic frameworks (COFs) and zeolites in future.
Acknowledgments
The authors thank financial support from the National Natural Science Foundation of China (nos. 21203094 and 21373112). This work was also supported by the grant (no. SZK2020Y03) from Shantou Polytechnic in Guangdong Province, China.
Supporting Information Available
The Supporting Information is available free of charge at https://pubs.acs.org/doi/10.1021/acsomega.1c00100.
Evaluation on the prediction effects of different models for Xe/Kr adsorption separation; cluster analysis of three categories of MOFs in Classes A, B, and C; statistical analysis of CO2/CH4 selectivity and adsorption uptake; optimum regression model of CO2/CH4 adsorption separation on MOFs; histogram of adsorption property distribution upon structural features; parity plots between Xe/Kr selectivity and Xe uptake; parity plots of Xe/Kr selectivities and Xe uptakes between GCMC simulations and different ML models; correlation diagram between material features and adsorption properties of CO2/CH4; and parity plots for the training and testing sets data using the XGBoost model (PDF)
The authors declare no competing financial interest.
Supplementary Material
References
- Denisova N.; Gavare Z.; Revalde G.; Skudra J.; Veilande R. A study of capillary discharge lamps in Ar–Hg and Xe–Hg mixtures. J. Phys. D: Appl. Phys. 2011, 44, 155201 10.1088/0022-3727/44/15/155201. [DOI] [Google Scholar]
- Bussiahn R.; Gortchakov S.; Lange H.; Uhrlandt D. Experimental and theoretical investigations of a low-pressure He-Xe discharge for lighting purpose. J. Appl. Phys. 2004, 95, 4627–4634. 10.1063/1.1704866. [DOI] [Google Scholar]
- Rossella F.; Rose H. M.; Witte C.; Jayapaul J.; SchröDer L. Design and Characterization of Two Bifunctional CryptophaneA-Based Host Molecules for Xenon Magnetic Resonance Imaging Applications. ChemPlusChem 2014, 79, 1463–1471. 10.1002/cplu.201402179. [DOI] [Google Scholar]
- Rasmussen J. H.; Mosfeldt M.; Pott F. C.; Belhage B. Xenon for induction of anaesthesia. Acta Anaesthesiol. Scand. 2009, 53, 549–550. 10.1111/j.1399-6576.2008.01876.x. [DOI] [PubMed] [Google Scholar]
- Derwall M.; Coburn M.; Rex S.; Hein M.; Fries M. Xenon: Recent developments and future perspectives. Minerva Anestesiol. 2008, 75, 37–45. [PubMed] [Google Scholar]
- Peng T.; Britton G. L.; Kim H.; Cattano D.; Aronowski J.; Grotta J.; Mcpherson D. D.; Huang S. L. Therapeutics, Therapeutic Time Window and Dose Dependence of Xenon Delivered via Echogenic Liposomes for Neuroprotection in Stroke. CNS Neurosci. Ther. 2013, 19, 773–784. 10.1111/cns.12159. [DOI] [PMC free article] [PubMed] [Google Scholar]
- Chakkarapani E.; Thoresen M.; Hobbs C. E.; Aquilina K.; Liu X.; Dingley J. A Closed-Circuit Neonatal Xenon Delivery System: A Technical and Practical Neuroprotection Feasibility Study in Newborn Pigs. Anesth. Analg. 2009, 109, 451–460. 10.1213/ane.0b013e3181aa9550. [DOI] [PubMed] [Google Scholar]
- Thallapally P. K.; Grate J. W.; Motkuri R. K. Facile xenon capture and release at room temperature using a metal–organic framework: a comparison with activated charcoal. Chem. Commun. 2012, 48, 347–349. 10.1039/C1CC14685H. [DOI] [PubMed] [Google Scholar]
- Faessler A. Nuclear matter under extreme conditions. Prog. Part. Nucl. Phys. 1984, 11, 155–169. 10.1016/0146-6410(84)90015-2. [DOI] [Google Scholar]
- Bazan R. E.; Bastos-Neto M.; Moeller A.; Dreisbach F.; Staudt R. Adsorption equilibria of O2, Ar, Kr and Xe on activated carbon and zeolites: single component and mixture data. Adsorption 2011, 17, 371–383. 10.1007/s10450-011-9337-3. [DOI] [Google Scholar]
- Jameson C. J.; Jameson A. K.; Lim H. M. Competitive Adsorption of Xenon and Krypton in Zeolite NaA: 129Xe Nuclear Magnetic Resonance Studies and Grand Canonical Monte Carlo Simulations. J. Chem. Phys. 1997, 107, 4364–4372. 10.1063/1.474778. [DOI] [Google Scholar]
- Munakata K.; Kanjo S.; Yamatsuki S.; Koga A.; Ianovski D. Adsorption of Noble Gases on Silver-mordenite. J. Nucl. Sci. Technol. 2003, 40, 695–697. 10.1080/18811248.2003.9715408. [DOI] [Google Scholar]
- Cohen S. M. Modifying MOFs: new chemistry, new materials. Chem. Sci. 2010, 1, 32–36. 10.1039/c0sc00127a. [DOI] [Google Scholar]
- Li J. R.; Tao Y.; Yu Q.; Bu X. H.; Sakamoto H.; Kitagawa S. Selective gas adsorption and unique structural topology of a highly stable guest-free zeolite-type MOF material with N-rich chiral open channels. Chem. – Eur. J. 2008, 14, 2771–2776. 10.1002/chem.200701447. [DOI] [PubMed] [Google Scholar]
- Mueller U.; Schubert M.; Teich F.; Puetter H.; Schierle-Arndt K.; Pastré J. Metal-organic frameworks-prospective industrial applications. J. Mater. Chem. 2006, 16, 626–636. 10.1039/B511962F. [DOI] [Google Scholar]
- Fanourgakis G. S.; Gkagkas K.; Tylianakis E.; et al. A Universal Machine Learning Algorithm for Large Scale Screening of Materials. J. Am. Chem. Soc. 2020, 142, 3814–3822. 10.1021/jacs.9b11084. [DOI] [PubMed] [Google Scholar]
- Fernandez C. A.; Liu J.; Thallapally P. K.; Strachan D. M. Switching Kr/Xe Selectivity with Temperature in a Metal-Organic Framework. J. Am. Chem. Soc. 2012, 134, 9046–9049. 10.1021/ja302071t. [DOI] [PubMed] [Google Scholar]
- Ghose S. K.; Li Y.; Yakovenko A.; Dooryhee E.; Ehm L.; Ecker L. E.; Dippel A. C.; Halder G. J.; Strachan D. M.; Thallapally P. K. Understanding the Adsorption Mechanism of Xe and Kr in a Metal-Organic Framework from X-ray Structural Analysis and First-Principles Calculations. J. Phys. Chem. Lett. 2015, 6, 1790–1794. 10.1021/acs.jpclett.5b00440. [DOI] [PubMed] [Google Scholar]
- Meek S. T.; Teich-McGoldrick S. L.; Perry J. J.; Greathouse J. A.; Allendorf M. D. Effects of Polarizability on the Adsorption of Noble Gases at Low Pressures in Monohalogenated Isoreticular Metal-Organic Frameworks. J. Phys. Chem. C 2012, 116, 19765–19772. 10.1021/jp303274m. [DOI] [Google Scholar]
- Banerjee D.; Simon C. M.; Plonka A. M.; Motkuri R. K.; Liu J.; Chen X.; Smit B.; Parise J. B.; Haranczyk M.; Thallapally P. K. Metal-organic framework with optimally selective xenon adsorption and separation. Nat. Commun. 2016, 7, 11831 10.1038/ncomms11831. [DOI] [PMC free article] [PubMed] [Google Scholar]
- Gong Y.; Tang Y.; Mao Z.; Wu X.; Liu Q.; Hu S.; Xiong S.; Wang X. Metal–organic framework derived nanoporous carbons with highly selective adsorption and separation of xenon. J. Mater. Chem. A 2018, 6, 13696–13704. 10.1039/C8TA02091D. [DOI] [Google Scholar]
- Zhou Q.; Lu S.; Wu Y.; Wang J. Property-Oriented Material Design Based on a Data-Driven Machine Learning Technique. J. Phys. Chem. Lett. 2020, 11, 3920–3927. 10.1021/acs.jpclett.0c00665. [DOI] [PubMed] [Google Scholar]
- Bucior B. J.; Bobbitt N. S.; Islamoglu T.; Goswami S.; Gopalan A.; Yildirim T.; Farha O. K.; Bagheri N.; Snurr R. Q. Energy-based descriptors to rapidly predict hydrogen storage in metal–organic frameworks. Mol. Syst. Des. Eng. 2019, 4, 162–174. 10.1039/C8ME00050F. [DOI] [Google Scholar]
- Simon C. M.; Mercado R.; Schnell S. K.; Smit B.; Haranczyk M. What Are the Best Materials To Separate a Xenon/Krypton Mixture?. Chem. Mater. 2015, 27, 4459–4475. 10.1021/acs.chemmater.5b01475. [DOI] [Google Scholar]
- Ma R.; Colon Y. J.; Luo T. A Transfer Learning Study of Gas Adsorption in Metal-Organic Frameworks. ACS Appl. Mater. Interfaces 2020, 12, 34041–34048. 10.1021/acsami.0c06858. [DOI] [PubMed] [Google Scholar]
- Lan Y.; Yan T.; Tong M.; Zhong C. Large-scale computational assembly of ionic liquid/MOF composites: synergistic effect in the wire-tube conformation for efficient CO2/CH4 separation. J. Mater. Chem. A 2019, 7, 12556–12564. 10.1039/C9TA01752F. [DOI] [Google Scholar]
- Calvetti D.; Morigi S.; Reichel L.; Sgallari F. Tikhonov regularization and the L-curve for large discrete ill-posed problems. J. Comput. Appl. Math. 2000, 123, 423–446. 10.1016/S0377-0427(00)00414-3. [DOI] [Google Scholar]
- Tibshirani R. Regression shrinkage and selection via the lasso: a retrospective. J. R. Stat. Soc., Ser. B 2011, 73, 273–282. 10.1111/j.1467-9868.2011.00771.x. [DOI] [Google Scholar]
- Ogutu J. O.; Schulz-Streeck T.; Piepho H. P. Genomic selection using regularized linear regression models: Ridge regression, lasso, elastic net and their extensions. BMC Proc. 2012, 6, S10 10.1186/1753-6561-6-S2-S10. [DOI] [PMC free article] [PubMed] [Google Scholar]
- Klon A. E.; Lowrie J. F.; Diller D. J. Improved Naive Bayesian Modeling of Numerical Data for Absorption, Distribution, Metabolism and Excretion (ADME) Property Prediction. J. Chem. Inf. Model. 2006, 5, 1945–1956. 10.1021/ci0601315. [DOI] [PubMed] [Google Scholar]
- Joachims T. Making large-scale SVM learning practical. Tech. Res. 1998, 8, 499–526. 10.17877/DE290R-5098. [DOI] [Google Scholar]
- Madani S. S. Electric Load Forecasting Using an Artificial Neural Network. IEEE Trans. Power Syst. 2013, 6, 442–449. [Google Scholar]
- Liaw A.; Wiener M. Classification and Regression with Random Forest. R News 2002, 23, 18–22. [Google Scholar]
- Chen T.; Guestrin C. XGBoost: A Scalable Tree Boosting System. Commun. ACM 2016, 785–794. [Google Scholar]
- Fernandez M.; Barnard A. S. Geometrical Properties Can Predict CO2 and N2 Adsorption Performance of Metal-organic Frameworks (MOFs) at Low Pressure. ACS Comb. Sci. 2016, 18, 243–252. 10.1021/acscombsci.5b00188. [DOI] [PubMed] [Google Scholar]
- Fernandez M.; Woo T. K.; Wilmer C. E.; Snurr R. Q. Large-Scale Quantitative Structure–Property Relationship (QSPR) Analysis of Methane Storage in Metal–Organic Frameworks. J. Phys. Chem. C 2013, 117, 7681–7689. 10.1021/jp4006422. [DOI] [Google Scholar]
- Braun E.; Zurhelle A. F.; Thijssen W.; Schnell S. K.; Lin L.-C.; Kim J.; Thompson J. A.; Smit B. Engineering, High-throughput computational screening of nanoporous adsorbents for CO2 capture from natural gas. Mol. Syst. Des. Eng. 2016, 1, 175–188. 10.1039/C6ME00043F. [DOI] [Google Scholar]
- Wilmer C. E.; Leaf M.; Lee C. Y.; Farha O. K.; Hauser B. G.; Hupp J. T.; Snurr R. Q. Large-scale screening of hypothetical metal–organic frameworks. Nat. Chem. 2012, 4, 83–89. 10.1038/nchem.1192. [DOI] [PubMed] [Google Scholar]
- Wilmer C. E.; Farha O. K.; Bae Y. S.; Hupp J. T.; Snurr R. Q. Structure-property relationships of porous materials for carbon dioxide separation and capture. Energy Environ. Sci. 2012, 5, 9849–9856. 10.1039/c2ee23201d. [DOI] [Google Scholar]
- Qian J.; Chen G.; Xiao S.; Li H.; Ouyang Y.; Wang Q. Switching Xe/Kr adsorption selectivity in modified SBMOF-1: a theoretical study. RSC Adv. 2020, 10, 17195–17204. 10.1039/D0RA02212H. [DOI] [PMC free article] [PubMed] [Google Scholar]
- Xiong X.; Chen G.; Xiao S.; Ouyang Y.; Li H.; Wang Q. New Discovery of Metal–Organic Framework UTSA-280: Ultrahigh Adsorption Selectivity of Krypton over Xenon. J. Phys. Chem. C 2020, 124, 14603–14612. 10.1021/acs.jpcc.0c02280. [DOI] [Google Scholar]
- Morris W.; Doonan C. J.; Yaghi O. M. Postsynthetic modification of a metal-organic framework for stabilization of a hemiaminal and ammonia uptake. Inorg. Chem. 2011, 50, 6853–6855. 10.1021/ic200744y. [DOI] [PubMed] [Google Scholar]
- Cheng J.; Yuan X.; Li Z.; Huang D.; Min Z.; Lei D.; Rui D. GCMC simulation of hydrogen physisorption on carbon nanotubes and nanotube arrays. Carbon 2004, 42, 2019–2024. 10.1016/j.carbon.2004.04.006. [DOI] [Google Scholar]
- Martin M. G.; Siepmann J. I. Transferable potentials for phase equilibria. 1. united-atom description of n-alkanes. J. Phys. Chem. B 1998, 102, 2569–2577. 10.1021/jp972543+. [DOI] [Google Scholar]
- Butler K. T.; Davies D. W.; Cartwright H.; Isayev O.; Walsh A. Machine learning for molecular and materials science. Nature 2018, 559, 547–555. 10.1038/s41586-018-0337-2. [DOI] [PubMed] [Google Scholar]
- Critchley H. D.; Wiens S.; Rotshtein P.; Ohman A.; Dolan R. J. Neural system supporting interoceptive awareness. Nat. Neurosci. 2004, 7, 189–195. 10.1038/nn1176. [DOI] [PubMed] [Google Scholar]
- Ando A. J. S. Species Distributions, Land Values, and Efficient Conservation. Science 1998, 279, 2126–2128. 10.1126/science.279.5359.2126. [DOI] [PubMed] [Google Scholar]
- Proceedings of the 22nd ACM SIGKDD International Conference on Knowledge Discovery and Data Mining, 2016.
- Dureckova H.; Krykunov M.; Aghaji M. Z.; Woo T. K. Robust Machine Learning Models for Predicting High CO2 Working Capacity and CO2/H2 Selectivity of Gas Adsorption in Metal Organic Frameworks for Precombustion Carbon Capture. J. Phys. Chem. C 2019, 123, 4133–4139. 10.1021/acs.jpcc.8b10644. [DOI] [Google Scholar]
- Wang X.; Zeng S.; Wang Z.; Ni J. Identification of Crystalline Materials with Ultra-Low Thermal Conductivity Based on Machine Learning Study. J. Phys. Chem. C 2020, 124, 8488–8495. 10.1021/acs.jpcc.9b11610. [DOI] [Google Scholar]
- Adeshina Y. O.; Deeds E. J.; Karanicolas J. Machine learning classification can reduce false positives in structure-based virtual screening. Proc. Natl. Acad. Sci. U.S.A. 2020, 117, 18477–18488. 10.1073/pnas.2000585117. [DOI] [PMC free article] [PubMed] [Google Scholar]
- Liang H.; Yang W.; Peng F.; Liu Z.; Liu J.; Qiao Z. Combining large-scale screening and machine learning to predict the metal-organic frameworks for organosulfurs removal from high-sour natural gas. APL Mater. 2019, 7, 091101 10.1063/1.5100765. [DOI] [Google Scholar]
- Quinlan J. R. Induction on decision tree. Mach. Learn. 1986, 1, 81–106. 10.1007/BF00116251. [DOI] [Google Scholar]
- Sumida K.; Rogow D. L.; Mason J. A.; McDonald T. M.; Bloch E. D.; Herm Z. R.; Bae T. H.; Long J. R. Carbon dioxide capture in metal-organic frameworks. Chem. Rev. 2012, 112, 724–781. 10.1021/cr2003272. [DOI] [PubMed] [Google Scholar]
- Altintas C.; Keskin S. Molecular Simulations of MOF Membranes and Performance Predictions of MOF/Polymer Mixed Matrix Membranes for CO2/CH4 Separations. ACS Sustainable Chem. Eng. 2019, 7, 2739–2750. 10.1021/acssuschemeng.8b05832. [DOI] [PMC free article] [PubMed] [Google Scholar]
Associated Data
This section collects any data citations, data availability statements, or supplementary materials included in this article.


