

Abstract
Among the changes that typify Alzheimer’s disease (AD) are neuroinflammation and microglial activation, amyloid deposition perhaps resulting from compromised microglial function and iron accumulation. Data from Genome Wide Association Studies (GWAS) identified a number of gene variants that endow a significant risk of developing AD and several of these encode proteins expressed in microglia and proteins that are implicated in the immune response. This suggests that neuroinflammation and the accompanying microglial activation are likely to contribute to the pathogenesis of the disease. The trigger(s) leading to these changes remain to be identified. In this study, we set out to examine the link between the inflammatory, metabolic and iron‐retentive signature of microglia in vitro and in transgenic mice that overexpress the amyloid precursor protein (APP) and presenilin 1 (PS1; APP/PS1 mice), a commonly used animal model of AD. Stimulation of cultured microglia with interferon (IFN)γ and amyloid‐β (Aβ) induced an inflammatory phenotype and switched the metabolic profile and iron handling of microglia so that the cells became glycolytic and iron retentive, and the phagocytic and chemotactic function of the cells was reduced. Analysis of APP/PS1 mice by magnetic resonance imaging (MRI) revealed genotype‐related hypointense areas in the hippocampus consistent with iron deposition, and immunohistochemical analysis indicated that the iron accumulated in microglia, particularly in microglia that decorated Aβ deposits. Isolated microglia prepared from APP/PS1 mice were characterized by a switch to a glycolytic and iron‐retentive phenotype and phagocytosis of Aβ was reduced in these cells. This evidence suggests that the switch to glycolysis in microglia may kick‐start a cascade of events that ultimately leads to microglial dysfunction and Aβ accumulation.
Keywords: amyloid‐β (Aβ), APP/PS1 mice, glycolysis, iron, microglia, neuroinflammation, phagocytosis
Introduction
Optimal brain function requires iron. Iron catalyzes several enzymes, is necessary for myelination, to support mitochondrial energy generation and it plays a role in cell cycling. Regulation of cell iron is therefore critical and both deficiency and iron excess have detrimental effects on brain function 33. Iron transport into and out of the cells is determined by the iron import protein, divalent metal transporter1 (DMT1), and the export protein, ferroportin 9 both of which are regulated by the iron regulatory protein 1 (IRP1) 39. A link between neuroinflammation and iron dysregulation in the brain has been described, particularly in Parkinson’s disease (PD). A significant body of research suggests that the pathogenesis of PD is, at least in part, driven by inappropriate microglial activation 32 and in an animal model of PD, areas of iron deposition were associated with marked microgliosis in the substantia nigra 51. Indeed, increased iron loading in microglia has also been reported 47 while maximal deposition has been described in the substantia nigra 19, where neurodegeneration is most profound. It has been proposed that increased iron may be a contributing factor to the pathogenesis of the disease 2, 38.
Inflammatory cytokines like interleukin (IL)‐6 50 and tumor necrosis factor (TNF)α 34 increase the expression of DMT1 in microglia and therefore promote iron sequestration in the cells. Iron sequestration is also promoted by a downregulation of cell surface expression of ferroportin, which is regulated by the 25‐amino acid liver‐derived peptide, hepcidin; the evidence indicates that hepcidin binds to and internalizes ferroportin and thereby decreases iron efflux from cells 46, 48. Both IL‐6 and TNFα increase the expression of hepcidin in microglia 42 and affect iron in cells by increasing influx and decreasing efflux. These findings establish a link between inflammation and iron handling. Our recent findings demonstrated that IFNγ‐induced changes in microglia included the production of inflammatory cytokines together with iron retention, perhaps driven by an upregulation in mRNA expression of ferritin and a downregulation of ferroportin 15 and this provides further evidence that iron accumulation occurs in activated microglia.
Increased iron staining has been found in proximity to amyloid‐β (Aβ) plaques in formalin‐fixed tissue from individuals with Alzheimer’s disease (AD), 22 and it has been reported that iron accumulation correlates with Aβ and tau pathology 43. Iron accumulation has also been observed in AD by magnetic resonance imaging (MRI) 4 but, at present, the impact of iron accumulation in AD remains unclear.
We have recently reported that IFNγ‐induced inflammatory changes and iron retention in microglia are accompanied by a metabolic switch toward glycolysis 15 and this indicated that the well‐described link between inflammation and glycolysis in macrophages 12 extended to microglia. These data are corroborated by the finding that immortalized microglia, triggered to adopt the so‐called M1 activation state, took up non‐transferrin‐bound iron 21.
Here we set out to determine whether the exposure of microglia to IFNγ and Aβ in vitro and in vivo triggers a phenotype that can be identified by an inflammatory, iron‐retentive and metabolic signature. We report that IFNγ and Aβ increased glycolysis and glycolytic enzymes, including PFKFB3 in microglia, and that iron retention in cells increased. These changes were accompanied by compromised function, specifically chemotaxis and phagocytosis. In a mouse model of AD, characterized by overexpression of amyloid precursor protein (APP) and presenilin 1 (PS1; APP/PS1 mice) and increased expression of IFNγ and Aβ, MRI analysis revealed accumulation of iron in brain that immunohistochemical analysis showed was microglia associated. These iron‐laden microglia decorated Aβ plaques and we found that they were PFKFB3+, and therefore glycolytic. The evidence suggests that glycolytic, iron‐retentive microglia lose their phagocytic capability perhaps reflecting the metabolic inefficiency of glycolysis. The possibility exists that this metabolic profile contributes to the accumulation of Aβ in AD.
Materials and Methods
Animals
Male and female transgenic APPswe/PS1dE9 mice (on a C57BL/6;C3H genetic background), littermate wild‐type mice and C57BL/6 mice were used in these experiments. They were sacrificed at 19–20 months of age. All the experiments were performed under license from the Health Products Regulatory Authority of Ireland in accordance with the EU regulations and with local ethical approval (Trinity College Dublin). Animals were housed under controlled conditions (20–22°C, food and water ad lib) and maintained under veterinary supervision.
MRI
MRI was conducted using a 7‐T small animal Bruker Biospin MRI system and we used susceptibility‐weighted imaging to assess iron deposition 13 as this method is considered to offer a significant benefit in terms of sensitivity 27. Animals were anesthetized (isoflurane 5% induction, 1%–2% maintenance) and placed on a cradle using ear bars to stabilize the head. A built‐in water pump‐driven temperature regulator (SA Instruments Inc., Stony Brook, NY, USA) was used to maintain rectal temperature at 37°C ± 1°C. A mechanical ventilator (Ugo Basile, Comerio, VA, Italy) was used to deliver adequate inflowing gas to the facemask and the respiration signal was monitored using custom hardware and software (SA Instruments Inc.). Respiratory rate was maintained at 60–70 breathes per minute throughout the session. To ensure accurate positioning, an initial, rapid pilot image was recorded followed by a T2 phase contrast scan triggered by respiratory rate [spatial resolution, 0.0625 × 0.0625 × 0.3 mm3; matrix, 256 × 256; FOV, 16 × 16; TR, 800 ms; TE (ms), 3.09, 7.09, 11.09, 15.09, 19.09, 23.09, 27.09, 31.09; flip angle, 50°; repetitions, 1; averages, 10; trigger delay, 150 ms; scan time, 25 m 36 s], high‐resolution susceptibility‐weighted image (SWI) for iron depositions (spatial resolution, 0.0417 × 0.0417 × 0.3 mm3; matrix, 384 × 384; FOV, 16 × 16; TR, 505.58 ms; TE, 11.99 ms; flip angle, 30°; repetitions, 1; averages, 6; scan time, 19 m 24 s), T1‐weighted image (spatial resolution, 0.0625 × 0.0625 × 0.3 mm3; matrix, 256 × 256; FOV, 16 × 16; TR, 225.74 ms; TE, 3.5 ms; flip angle, 30°; repetitions, 1; averages, 10; scan time, 6 m 28 s) and a continuous arterial spin labeling sequence for qualitative cerebral perfusion (spatial resolution, 0.164 × 0.25 × 1 mm3; matrix, 128 × 64; FOV, 20 × 16; TR, 3000 ms; TE, 12.95 ms; flip angle, 90°; repetitions, 1; averages, 24; scan time, 2 m 24 s). Areas of hypointensity in the susceptibility‐weighted images were quantified manually using Image J region of interest tool.
Tissue preparation
Mice were anesthetized with sodium pentobarbital (Euthanimal) and transcardially perfused with saline. The brain was dissected and one hemisphere was fixed in 4% paraformaldehyde for 24 h for later preparation of sections for immunohistochemical analysis. The second hemisphere was used for isolation of microglia.
Following fixation, the tissue was incubated in 30% sucrose for 48 h for cryoprotection and frozen in isopentane. Tissue was mounted in optimal cutting temperature (OCT) solution and 20μm coronal sections were taken using a cryostat. Sections were stored at −80°C in freezing solution (30% ethylene glycol, 30% sucrose in PBS) until required for immunohistochemistry. Sections were stained with Iba 1 to identify microglia, and for Aβ, iron and PFKFB3.
Preparation of microglia from WT and APP/PS1 mice
Tissue was homogenized using the gentle‐MACS Dissociator (Miltenyi Biotec, Woking, UK) in combination with the AdultBrain Dissociation Kit (Miltenyi Biotec, Woking, UK) according to the manufacturer’s instructions. The dissociated tissue was filtered, washed and centrifuged and the pellet containing the microglia was resuspended, stained with CD11b microbeads (Miltenyi Biotec, Woking, UK) and magnetically separated using the QuadroMACS separator (Miltenyi Biotec, Woking, UK) according to the manufacturer’s instructions. Samples were resuspended and the final microglial pellet was resuspended in phosphate‐buffered saline (PBS; 75 μL), cells were seeded in 48‐well plates (2.5 × 10⁴ cells/well; final volume 200 μL) and cultured in cDMEM supplemented with M‐CSF (100 ng/mL; R&D Systems, Abingdon, UK) and GM‐CSF (100 ng/mL; R&D Systems, Abingdon, UK). Microglia were allowed to acclimatize for 5 days and media was changed every second day. On day 5, cells were fixed with 4% paraformaldehyde (30 minute) and stored in PBS at 4°C until use. Some coverslips were incubated on day 5 with Aβ1‐40 (5 μM) for 2 h prior to fixation to investigate phagocytosis.
Preparation of microglia from neonatal mice
Microglia were prepared as previously described 6. Briefly, isolated mixed glia from the cortical tissue of C57BL/6 neonatal mice were cultured in T25 cm2 flasks in cDMEM supplemented with macrophage colony stimulating factor (M‐CSF; 100 ng/mL; R&D Systems, Abingdon, UK) and granulocyte macrophage colony stimulating factor (GM‐CSF; 100 ng/mL; R&D Systems, Abingdon, UK) for 10–12 days, after which time non‐adherent microglia were seeded in 24‐well plates (1 × 10⁵ cells/well) and cultured for a further 2 days. Medium was replaced with fresh cDMEM ± IFNγ (50 ng/mL; Enzo Life Sciences, Exeter, UK) and amyloid‐β [Aβ; 10 μM comprising Aβ1‐40 (4.2 μM) + Aβ1‐42 (5.8 μM)] for 24 h. We used this Aβ combination because cells are exposed to both peptides in vivo and previous experiments indicated that it triggered inflammatory changes 20 and synergized with LPS to trigger neuroinflammatory and metabolic changes 36. To prepare Aβ, lyophilized Aβ1‐40 and Aβ1‐42 peptides were dissolved in HPLC grade water to provide a 6 mg/mL stock solution, which was diluted to 1 mg/mL using sterile PBS and allowed to aggregate (24 h, 220 rpm, 37°C). This preparation contains both oligomers and fibrils as evidenced by enhanced Thioflavin T binding (data not shown). Separate experiments were conducted to assess phagocytosis and chemotaxis; cells were seeded in 48‐well plates (6 × 10⁴ cells/well) and cultured for 24 h. The medium was replaced with fresh cDMEM ± IFNγ (50 ng/mL; Enzo Life Sciences, Exeter, UK) and amyloid‐β [Aβ1‐40 (4.2 μM) and Aβ1‐42 (10 μM)] for 24 h and harvested for analysis as described below. In separate experiments, cells were incubated in the presence or absence of FeCl3 (100 μM; Sigma, Welwyn Garden City, UK) for 6 h to assess the effect of iron loading on glycolysis as assessed by PFKFB3.
PCR
mRNA expression of TNFα and iNOS was assessed in microglia from neonatal mice by RT‐PCR. RNA was isolated from microglia using the Nucleospin® RNAII KIT (Macherey‐Nagel, Duren, Germany) and cDNA was prepared using High‐Capacity cDNA RT kit according to the manufacturer’s instructions (Applied Biosystems, Warrington, UK). Real‐time PCR was performed with predesigned Taqman gene expression assays [TNFα (Mm0043258_m1); NOS2 (Mm00440502_m1; Applied Biosystems, Warrington, UK)] using an Applied Biosystems 7500 Fast Real‐Time PCR machine (Applied Biosystems, Schwerte, Germany). Samples were assayed as previously described 7 with β‐actin as the endogenous control to normalize gene expression data. Gene expression was calculated relative to the endogenous control samples and to the control sample giving an RQ value (2− DDCt, where CT is the threshold cycle).
Western immunoblotting
Microglia, or samples of the hippocampal homogenate in the case of IFNγ treatment, were prepared for western immunoblotting as previously described 8. Briefly, cells were incubated in lysis buffer (composition in mM: Tris‐HCl 10, NaCl 50, Na4P2O7.H2O 10, NaF 50, containing 1% each of Igepal, phosphatase inhibitor cocktail I and II, and protease inhibitor; Sigma, Welwyn Garden City, UK), equalized for protein, added to 4x SDS sample buffer (composition: Tris‐HCl 100 mM, pH 6.8, 4% SDS, 2% bromophenol blue, 20% glycerol; Sigma), boiled (95°C, 5 minute) and applied to 8%–12% SDS gels. Proteins were transferred to a nitrocellulose membrane, non‐specific binding was blocked (5% Marvel in TBS containing 0.05% Tween 20) and membranes were incubated overnight at 4°C with the antibodies raised against ferritin (1:1000), PFKFB1 (1:400), PFKFB3 (1:1000), hexokinase II (1:500), PKM2 (1:1000) (AbCam, Cambridge, MA, USA), HIF‐1α (1:1000; Novus Biologics, Abingdon, UK) and IFNγ (1:1000; R&D Systems, Abingdon, UK) (all IgG, raised in rabbit, diluted in 5% non‐fat dried milk/TBS‐T). Membranes were washed and incubated (room temperature, 2 h) with a secondary HRP‐linked anti‐rabbit antibody (1:5000 in 5% milk in TBS‐T). Immunoreactive bands were detected using WesternBright ECL chemiluminescent substrate (Advansta, Menlo Park, CA, USA). Images were captured using the Fujifilm LAS‐4000 imager and densitometry analysis was carried out using ImageJ (http://rsb.info.nih.gov/).
Metabolic analysis
The SeaHorse Extracellular Flux (XF24) Analyser (SeaHorse Bioscience, North Billerica, MA, USA) was used to carry out real‐time metabolic analysis of the cells. Microglia (1 × 10⁵ cells/well) were seeded (100 μL/well) on SeaHorse cell culture microplates and treated with IFNγ (50 ng/mL) +Aβ (10 µM) for 24 h as described above. The sensor cartridge was hydrated by adding SeaHorse XF Calibrant solution (1 mL; SeaHorse BioScience, North Billerica, MA, USA) to each well of the utility plate and left overnight in a CO2‐free incubator at 37°C. Prior to the assay, cells were washed twice with the appropriate assay medium (1 mL) according to the manufacturer’s instructions, and assay media added to give a final volume of 500 μL/well and the plate was incubated in a CO2‐free incubator (37°C, 1 h). For the mitochondrial stress test, oligomycin (20 μM; AbCam, Cambridge, UK), carbonyl cyanide‐4‐(trifluoromethoxy)phenylhydrazone (20 μM; FCCP; Sigma‐Aldrich, Gillingham, Dorset, UK) and antimycin A (40 μM; Sigma‐Aldrich, Gillingham, Dorset, UK) were loaded into the appropriate ports for sequential delivery. For the glycolytic flux test, glucose (10 mM), oligomycin (20 μM) and 2‐deoxy‐d‐glucose (2‐DG; 500 mM; all Sigma‐Aldrich, Gillingham, Dorset, UK) were prepared in glycolytic flux assay media and similarly loaded into the appropriate ports. Following calibration, oxygen consumption rate (OCR) and extracellular acidification rate (ECAR) were measured every 8 minute for 96 minute during which time the appropriate compounds were injected sequentially at 24‐minute intervals. ECAR and OCR were automatically calculated using the SeaHorse XF24 software and 4–6 replicates were assessed for each separate sample.
Iron accumulation in microglia from neonatal mice
Iron accumulation was assessed in microglia from neonatal mice that were incubated in the presence or absence of IFNγ+Aβ. Cells were then washed and fixed (4% PFA, 30 minutes) for subsequent iron staining. The Prussian blue reaction for iron staining was carried out using the Hematognost Fe® kit (Merck Millipore, Darmstadt, Germany). Briefly, after washing with PBS, cells were incubated in the staining solution (1:1 ratio of 4.78% potassium hexacyanoferrate (II) and 5% hydrochloric acid) for 20 minute at 37°C, washed with distilled H2O and counterstained with nuclear fast red solution (0.1%, 5 minute). Coverslips were then dehydrated through graded alcohol and immersed in 100% xylene (VWR International, Leighton Buzzard, UK) before mounting onto slides using DPX (RA Lamb, Thermo Fisher, Paisley, UK). Images were taken using an Olympus IX51 light microscope with a built‐in camera (Olympus, Japan). Ten fields of view (FOV) were averaged per replicate resulting in a total of 12 381 cells analyzed. Data are presented as the proportion of iron‐positive cells (calculated by the “number of iron+ cells/total number of cells” per FOV).
Analysis of ROS
ROS generation was assessed in primary microglia treated with IFNγ+Aβ using CellRox Deep Red (Thermo Fisher, Paisley) as per the manufacturer’s instructions. Briefly, CellRox Deep Red solution was added to the media following treatment and incubated in the dark (37°C, 5% CO2, 30 minute). Cells were washed and fixed (3.7% paraformaldehyde, 15 minute) and fluorescence assessed in a fluorescent plate reader and quantified.
Analysis of phagocytosis and chemotaxis
Aβ engulfment was assessed in microglia that were plated onto coverslips coated with poly‐D lysine (5 µg/mL; Merck Millipore Ltd, Southampton, UK). Cells were either isolated from WT and APP/PS1 mice, or from neonatal mice and microglia from neonates were incubated in ± IFNγ +Aβ for 24 h as described above. Cells were fixed in 4% PFA and washed in PBT (PBS+1% Triton X‐100) prior to staining. Microglia were incubated first in PBT containing 3% BSA (1 h) to block non‐specific binding and then overnight at 4°C in the presence of rabbit anti‐Iba1 (1:1000; Wako, Tokyo, Japan) and mouse anti‐Aβ (1:500; Biolegend, San Diego, USA). Coverslips were washed and incubated (2 h, room temperature) with Alexa Fluor 546 donkey anti‐rabbit IgG (1:1000) and Alexa Fluor 488 donkey anti‐mouse IgG (1:1000), and mounted in ProLong Gold with the nuclear marker DAPI (Thermo Scientific, Miami, OK, USA). Images (8 fields/animal; 40X magnification) were acquired with a Zeiss AX10 Imager A1 microscope. Analysis of the images was undertaken with ImageJ software, the number of Aβ+ microglia was assessed and the % of Iba+ cells that engulfed Aβ was calculated.
Chemotaxis was assessed in microglia from neonatal mice. Cells were plated (115 000 cells/cm2) onto the transwell insert on a Boyden chamber (pore size 8 µm; Corning Inc., Deeside, UK), incubated in ± IFNγ+Aβ for 24 h as described above. Fresh media ± ATP (300 µM; Sigma‐Aldrich, Arklow, Ireland) was added to the wells in the Boyden chamber and cells were incubated for 6 h at 37°C. Non‐migrating cells from the upper side of the cell culture insert were removed and migrating cells that remained on the membrane were fixed (4% PFA, 30 minute), washed three times and mounted in ProLong Gold with the nuclear marker DAPI (Thermo Scientific, Miami, OK, USA). Images (8 fields; 20X magnification) were acquired with a Zeiss AX10 Imager A1 microscope. Analysis of the images was undertaken with ImageJ software, the number of migrated microglia was assessed and the chemotaxis percentage was calculated using spontaneous migration (ie, the number of cells that migrated in the absence of ATP) as control.
Analysis of Aβ
Hippocampal tissue from WT and APP/PS1 mice was homogenized in sodium dodecyl sulphate (SDS) buffer (1% SDS, 50 mM NaCl in dH2O) containing protease and inhibitors (1%; Sigma‐Aldrich, Gillingham, Dorset, UK), centrifuged (21 500 × g, 20 minute, 4°C) and SDS‐soluble Aβ was assessed in the supernatants. To assess insoluble Aβ, pellets were incubated in guanidine buffer (50 mM Tris‐HCl, 5M guanidine in dH2O) to provide sample for analysis. Aβ concentrations were determined using a MULTI‐SPOT® Human/Rodent (4G8) Abeta Triplex Ultra‐Sensitive Assay (Meso Scale Discovery, Rockville, MD, USA) as per the manufacturer’s instructions and as described previously 26.
Immunohistochemistry
Amyloid plaques were visualized by incubation of sections in saturated NaCl (80% ethanol in dH2O saturated with NaCl and supplemented with 1M NaOH) for 20 minutes at room temperature. Sections were incubated in filtered Congo red solution (200 mL; 0.2% Congo red dye in saturated NaCl solution, 30 minute) and rinsed in dH2O.
Microglia were visualized in tissue by staining for Iba1. Tissue was washed and blocked for endogenous peroxidase by incubating in hydrogen peroxide (0.75%; 20 minute) and non‐specific binding was blocked by incubating in normal horse serum (10%; 1 h) before incubation overnight in rabbit anti‐Iba1 primary antibodies (WAKO, Tokyo, Japan; 1:5000; at 4°C). Sections were incubated in goat anti‐rabbit biotinylated secondary antibodies (Vector Labs, Peterborough, UK; 1:300; 90 minute) and processed using the avidin‐biotin immunoperoxidase method (Vectastain ABC Elite kit, Vector Laboratories, Peterborough, UK). Iba1 immunoreactivity was visualized by the addition of the chromogen 3′,3‐diaminobenzidine (containing 0.02% H2O2 in PBS, Sigma‐Aldrich, Gillingham, Dorset, UK). Sections were mounted and allowed to dry overnight.
Iron staining was performed using the Prussian blue reaction (Hematognost Fe, Millipore Ireland, Carrigtwohill, Ireland) by incubating the sections (1:1 potassium hexacyanoferrate (II; 4.78%) and HCl (4%); 20 minute, 37°C). Slides were washed and dehydrated through graded alcohols and immersed in 100% xylene (VWR International, Leighton Buzzard, UK) before mounting with DPX (Sigma, Welwyn Garden City, UK) and viewed on an Olympus IX51 light microscope with a built‐in camera. The proportion of Iba1+ cells containing iron was calculated by dividing the number of Iron+ Iba1+ cells by the total number of Iba1+ cells per field of view.
PFKFB3 was assessed in floating sections which were first incubated with citrate (20 minute, 85°C) and pepsin (20 minute, room temperature) to promote antigen retrieval. Tissue was washed, permeabilized (10 minute; PBS with 0.1% Triton‐X100), blocked (1 h; 5% BSA with 0.1% Triton‐X100) and incubated (overnight, 4°C) with primary antibodies [goat anti‐Iba1; 1:1000 (LSBio Inc., Seattle, WA, USA), rabbit anti‐PFKFB3; 1:250 (AbCam, Cambridge, MA, USA) and mouse anti‐Aβ; 1:750 (Biolegend, San Diego, CA, USA)]. Samples were washed and incubated (2 h, room temperature) with Alexa Fluor® 546 donkey anti‐rabbit IgG (1:1000), Alexa Fluor® 633 donkey anti‐goat IgG (1:1000) and Alexa Fluor® 488 donkey anti‐mouse IgG (1:1000) and mounted in ProLong®Gold with the nuclear marker DAPI (ThermoScientific, Miami, OK, USA).
Analysis of PFKFB3 in isolated microglia
Microglia, isolated from one hemisphere of WT and APP/PSEN1 mice, were cultured as described above and, on day 5 were washed, permeabilized (10 minute; PBS with 0.1% Triton‐X100), blocked (1 h; 3% BSA with 0.1% Triton‐X100) and incubated [overnight, 4°C in primary antibodies; rabbit anti‐PFKFB3 (1:250; AbCam) in goat anti‐Iba1 (1:100)]. Coverslips were incubated (2 h, room temperature) with Alexa Fluor® 546 donkey anti‐goat IgG (1:1000) and Alexa Fluor® 488 donkey anti‐rabbit IgG (1:1000) and mounted in ProLong®Gold with the nuclear marker DAPI. Images were taken using a Leica SP8 scanning confocal microscope (40X; five fields of view) and processed using Image J software. To analyze the localization of PFKFB3 staining, DAPI regions of interest were generated and subtracted from the total cellular fluorescence. These values were corrected for background fluorescence by calculating the corrected total cellular fluorescence (CTCF) = integrated density − (area of selected cell × mean fluorescence of background readings).
Statistical analysis
Data are reported as the mean ± SEM and the number of experiments is indicated in each case. Statistical analysis was carried out using Student’s t test for independent means. The significance level was set at P < 0.05.
Results
IFNγ+Aβ increases glycolysis in microglia from neonatal mice
We have reported that inflammatory microglia become glycolytic 15 and to confirm this we assessed the metabolic profile of microglia under control conditions and following stimulation with IFNγ+Aβ. We show that IFNγ+Aβ increased the mRNA expression of TNFα and iNOS (*P < 0.05; **P < 0.01; Student’s t test for independent means; Figure 1A,B). These changes were accompanied by increased glycolysis. Thus, ECAR was markedly increased in microglia incubated with IFNγ+Aβ compared with control (Figure 1C) and IFNγ+Aβ significantly increased mean glycolysis and mean glycolytic capacity (**P < 0.01; Student’s t test for independent means; Figure 1D,E). Analysis of oxidative metabolism indicated that there was no IFNγ+Aβ‐induced change in OCR, basal or maximal respiration (Figure 1F‐H) and neither ATP production nor proton leak was altered (data not shown). To consolidate these findings, we examined the expression of glycolytic enzymes. Hexokinase II and PKM2 catalyze the first and last steps in glycolysis and both are rate‐limiting, and PFKFB3 is a potent activator of glycolysis because it controls the production of frucose‐2,6‐bisphosphate which in turn controls the activity of phosphofructokinase (PFK)‐1, a key glycolytic enzyme. Here we show that the expression of these enzymes increased in IFNγ+Aβ‐stimulated microglia (*P < 0.05; **P < 0.01; Student’s t test for independent means; Figure 2A‐D). Among the factors that activate glycolytic enzymes, including PFKFB3 25 is HIF‐1α, whose expression is modulated by ROS. Therefore, we investigated both and found that HIF‐1α and ROS, assessed using the fluorescent probe, CellRox Deep Red Reagent, significantly increased in IFNγ+Aβ‐stimulated, compared with control, microglia (*P < 0.05; **P < 0.01; Student’s t test for independent means; Figure 2E,F).
Figure 1.
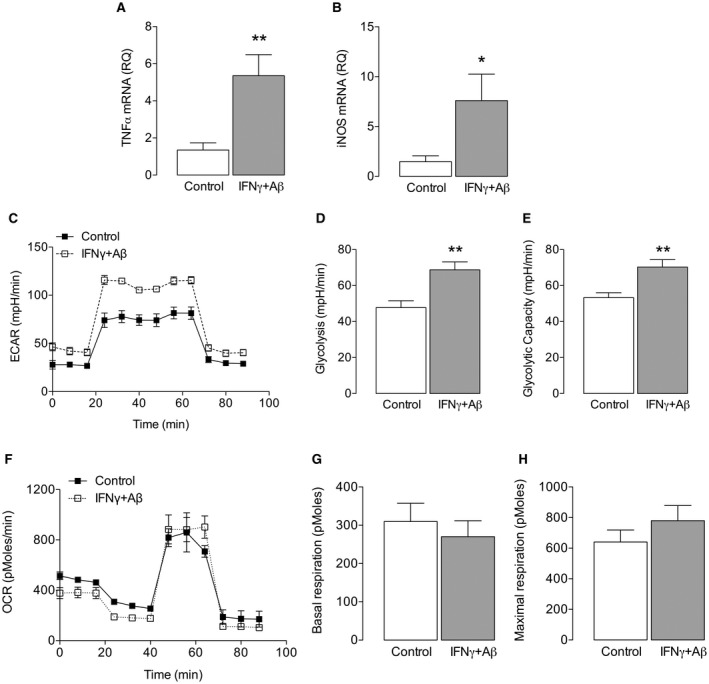
IFNγ+Aβ increased glycolysis in microglia. Microglia isolated from neonatal brains were cultured as described in the Methods and incubated with/without IFNγ (50 ng/mL) + Aβ (10 μM) for 24 h. Cells from eight separate experiments were harvested for analysis by PCR to assess the mRNA expression of TNFα and iNOS, or for metabolic analysis using the SeaHorse Extracellular Flux (XF24) Analyser. IFNγ+Aβ increased TNFα and iNOS mRNA (*P < 0.05; **P < 0.01; ***P < 0.001; Student’s t test for independent means; Figure 1 A,B; n = 8). Microglia (1 × 10⁵ cells/well) were seeded in a Seahorse XF plate and treated with IFNγ (50 ng/mL) +Aβ (10 µM) for 24 h. To assess ECAR, three baseline measures were taken and the cells were sequentially exposed to glucose (10 mM), oligomycin (20 μM) and 2‐deoxy‐d‐glucose (2‐DG; 500 mM); the resultant bioenergetic profile is presented. C. IFNγ +Aβ significantly increased glycolysis and glycolytic capacity (D, E; **P < 0.01; Student’s t test for independent means; n = 6–8). Data are presented as means ± SEM (n = 6–8). To assess OCR, three baseline measures were taken and subsequent measurements were taken after sequential incubation of cells in oligomycin (20 μM), carbonyl cyanide‐4‐(trifluoromethoxy)phenylhydrazone (20 μM; FCCP) and antimycin A (40 μM). The OCR bioenergetic profile and analysis of separate measures indicated that IFNγ +Aβ had no significant effect on OCR (F) basal respiration (G) or maximum respiration. H. Data are presented as means ± SEM (n = 3).
Figure 2.
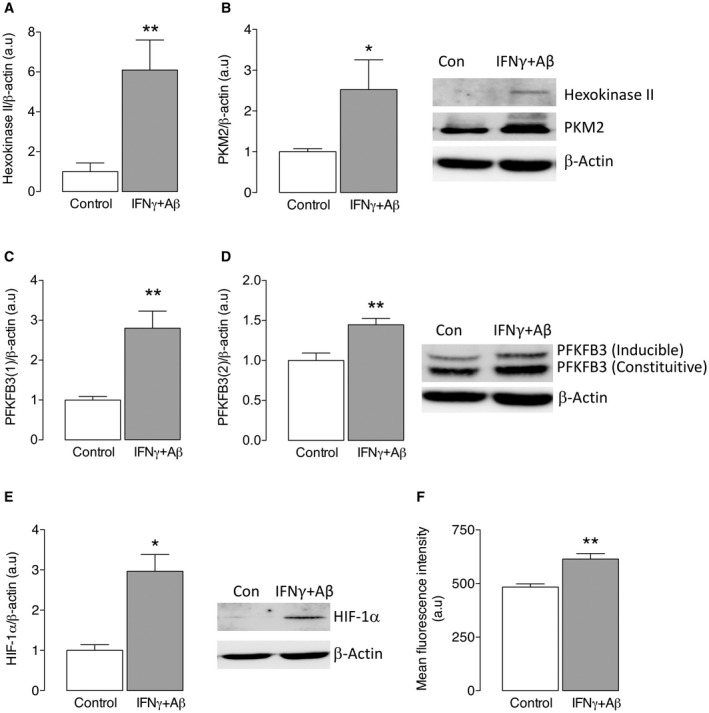
IFNγ+Aβ increased glycolytic enzymes, as well as HIF‐1α and ROS production, in microglia. Microglia from neonatal brains, prepared as described in the Methods, were incubated with/without IFNγ (50 ng/mL) + Aβ (10 μM) for 24 h after which time cells were harvested, lyzed, equalized for protein, separated by gel electrophoresis and transferred to a nitrocellulose membrane for analysis. IFNγ+Aβ significantly increased hexokinase II (A), PKM2 (B) and inducible and constituitive PFKFB3 (C,D; **P < 0.01; Student’s t test for independent means). In addition, IFNγ+Aβ increased HIF‐1α (E; *P < −0.05) and analysis of ROS by CellRox Deep Red revealed a significant IFNγ+Aβ‐induced increase in ROS (F; **P < 0.01). Sample immunoblots for hexokinase II, PKM2 and PFKFB3 are shown. Data are presented as means ± SEM (n = 6).
IFNγ+Aβ increases iron accumulation and impairs function in microglia from neonatal mice
Ferritin is the main iron storage protein in cells and here we show that it was increased in IFNγ+Aβ‐stimulated microglia, as indicated by the sample immunoblot and the mean densitometric data (**P < 0.01; Student’s t test for independent means; Figure 3A), and was accompanied by a significant IFNγ+Aβ‐induced increase in the number of Iba1+ cells that stained positively for iron (**P < 0.01; Student’s t test for independent means; Figure 3B,C). Together the data indicate that IFNγ+Aβ‐stimulated microglia are inflammatory, glycolytic and iron retentive and produce increased ROS. The data suggest that iron loading might trigger glycolysis as indicated by the finding that incubation of microglia in the presence of FeCl3 significantly increased PFKFB3 (*P < 0.05; Student’s t test for independent means; Figure 3D,E). To determine the impact of iron loading and glycolysis on microglial function, we evaluated phagocytosis and chemotaxis. Almost 80% of Iba1+ cells were Aβ+ in the control samples, whereas this was markedly reduced in IFNγ+Aβ‐treated samples (**P < 0.01; Student’s t test for independent means; Figure 4A,B). Chemotaxis was also significantly reduced in cells incubated with IFNγ+Aβ (*P < 0.05; Student’s t test for independent means; Figure 4C).
Figure 3.
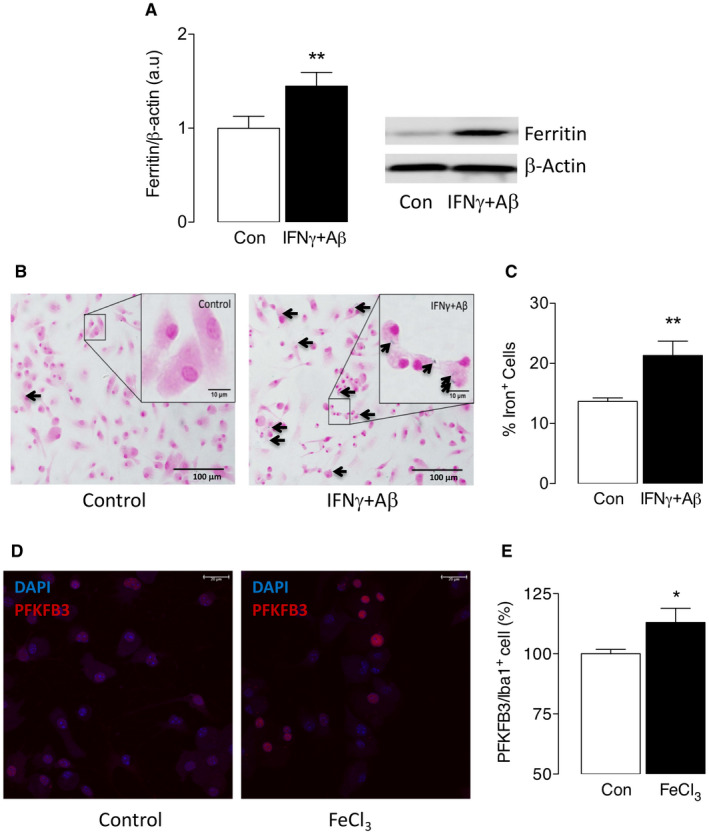
IFNγ+Aβ increased iron accumulation in microglia. Primary microglia were cultured from neonatal mice as described in the Methods, incubated with/without IFNγ (50 ng/mL) + Aβ (10 μM) for 24 h and harvested for analysis by western immunoblotting or for staining. A. IFNγ+Aβ significantly increased ferritin (**P < 0.01; Student’s t test for independent means; n = 6). B,C. IFNγ+Aβ markedly increased the number of cells that stained positively for iron (B, indicated by arrows) and analysis of the data indicated that the percentage of iron+ cells was significantly greater in IFNγ+Aβ‐incubated cells compared with controls (**P < 0.01; Student’s t test for independent means; n = 6). D,E. Incubation of microglia in the presence of FeCl3 significantly increased PKFKB3 (*P < 0.05; Student’s t test for independent means; n = 4). Data are presented as means ± SEM.
Figure 4.
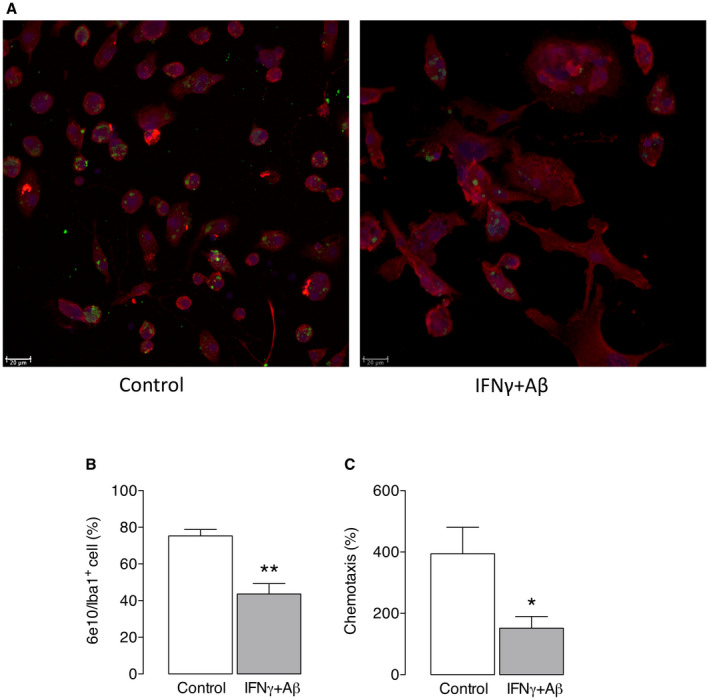
IFNγ+Aβ decreased phagocytosis and decreased chemotaxis in microglia from neonatal mice. Primary microglia were cultured from neonatal mice as described in the Methods, incubated with/without IFNγ (50 ng/mL) + Aβ1‐40/1‐42 (5 μM) for 24 h and assessed for phagocytosis of Aβ and chemotaxis. A. The representative image shows that IFNγ+Aβ reduced the number of cells that engulfed Aβ and the mean data indicated that IFNγ+Aβ significantly decreased the percentage of 6e10+ Iba1+ microglia (B) and also significantly decreased chemotaxis, as assessed by counting the migrating cells in response to ATP (C; *P < 0.05; **P < 0.01; Student’s t test for independent means). Data are the means ± SEM for eight estimates in five separate experiments.
Iron accumulation is increased in microglia from APP/PS1 mice and iron‐laden microglia cluster around Aβ‐containing plaques
We asked whether these changes might also occur in vivo since IFNγ and Aβ were increased in the brain tissue from APP/PS1 mice 3 and therefore first confirmed that these changes were reproducible; the data show a genotype‐related increase in hippocampal IFNγ (Figure 5A), as well as soluble Aβ1‐40 and Aβ1‐42 (*P < 0.05; ***P < 0.001; Student’s t test for independent means; Figure 5B,C). Insoluble Aβ concentrations were also increased [284.3 ng/mg (± 0.96, SEM) vs. 10 739 (2893) and 8.41 ng/mg (±0.19 SEM) vs. 572.9 (164.0) in WT and APP/PS1 mice for Aβ1‐40 and Aβ1‐42, respectively; P < 0.05 in each case; data not shown].
Figure 5.
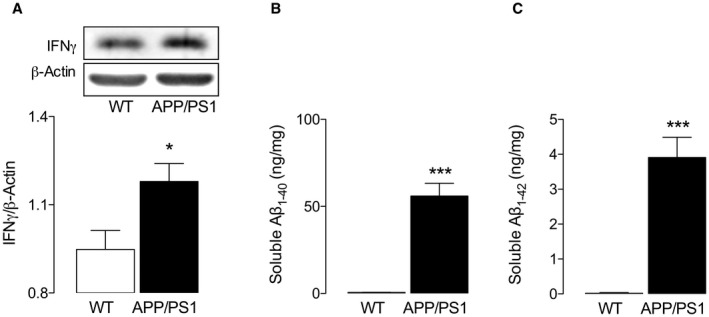
Increased IFNγ and Aβ in hippocampus from APP/PS1 mice. Hippocampal tissue prepared from WT and APP/PS1 mice was assessed for IFNγ and soluble Aβ as described in the Methods. IFNγ (A) and Aβ1‐40 and Aβ1‐42 (B) significantly increased in the hippocampal tissue from APP/PS1 mice compared with WT mice (*P < 0.05; ***P < 0.001; Student’s t test for independent means; n = 5 and 7 for WT and APP/PS1 mice, respectively).
We argued that the well‐described inflammatory microglia that have been consistently reported in APP/PS1 mice 17, 26 would be accompanied by iron accumulation in the cells and, to investigate this in our model, we first assessed anesthetized mice using MRI. In the hippocampus of APP/PS1 mice, there were areas of hypointensity on susceptibility‐weighted images that are indicative of iron accumulation but there was little evidence of hypointensity in wild‐type mice (Figure 6A). Analysis of the mean data revealed a significant genotype‐related increase in the area of hypointensity and also a significant increase in average pixel intensity in these areas (**P < 0.01; Student’s t test for independent means; Figure 6B,C). To determine whether the increased iron retention was specific to microglia, tissue was stained for Iba1 and iron and to assess whether these microglia were related to areas of Aβ accumulation, colocalization of Iba1, iron and Aβ was examined. The sample images indicate that there were several Aβ‐containing plaques in the hippocampal tissue prepared from APP/PS1 mice (Figure 7A), that these plaques were decorated with iron‐laden microglia (Figure 7B) and that the proportion of iron+ Iba+ cells was significantly greater in sections from APP/PS1 mice compared with WT mice (**P < 0.01; Student’s t test for independent means; Figure 7C). Further analysis indicated that the microglia surrounding the plaques were PFKFB3‐positive indicating that they were glycolytic (Figure 7D).
Figure 6.
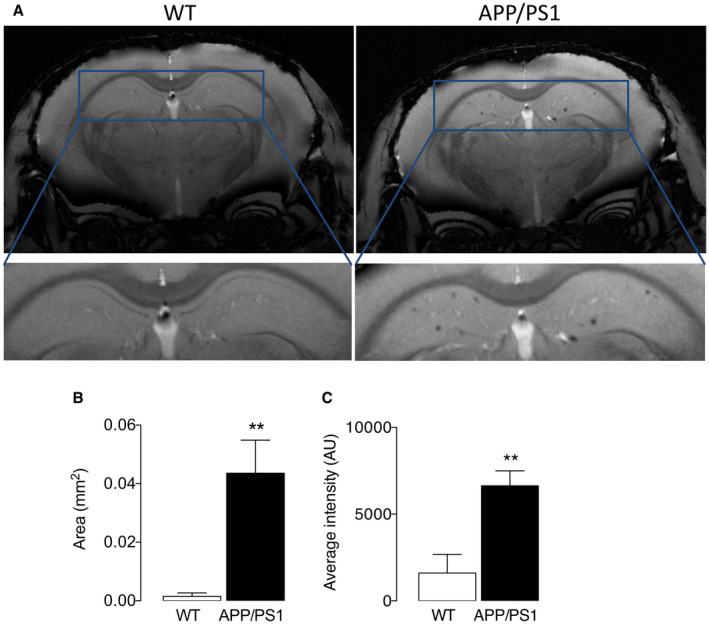
MRI analysis reveals iron accumulation in hippocampus of APP/PS1 mice. Iron accumulation was analyzed in the hippocampus as described in the Methods and areas of hypointensity in the susceptibility‐weighted images were quantified. A. Areas of hypointensity that are indicative of iron accumulation were identified in the hippocampus of APP/PS1 mice but there was little evidence of hypointensity in WT mice. B,C. Analysis of the mean data revealed significant genotype‐related increases in the area of hypointensity (B) and in average pixel intensity in these areas (C; **P < 0.01; Student’s t test for independent means; n = 10 and 9 for WT and APP/PS1 mice, respectively).
Figure 7.
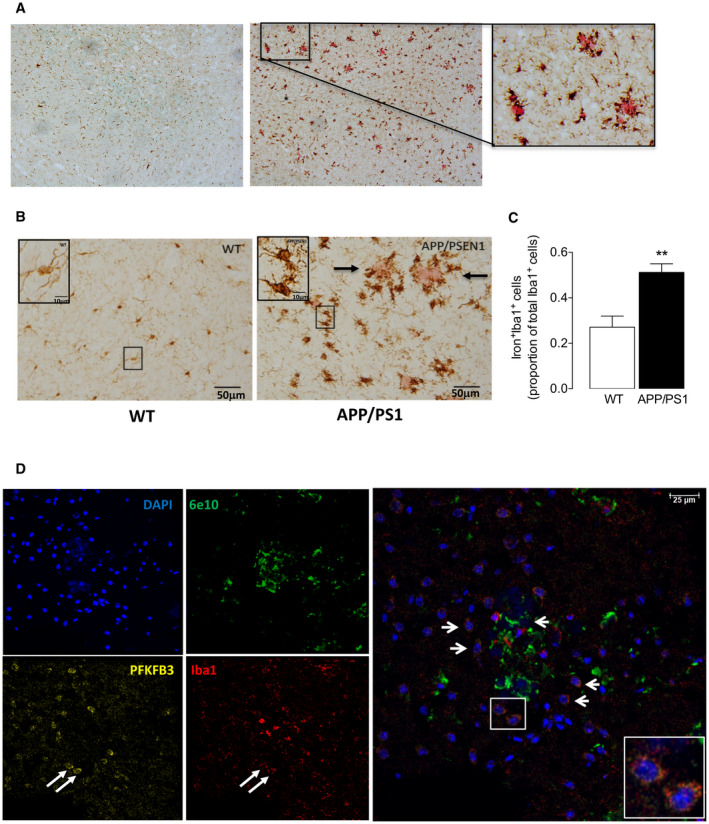
Iron+ PFKFB3+ Iba1+ microglia surround plaques in hippocampal sections from APP/PS1 mice. Sections of the hippocampus (20 μm) were assessed for Aβ, iron and PFKFB3 as described in the Methods. A. Several Aβ‐containing plaques, that stain pink, were identified in sections prepared from APP/PS1 mice with no evidence in sections from WT mice. B. Ramified Iba+ microglia, which are stained as light brown cells, are evident in sections prepared from WT mice. In contrast, the Iba+ microglia in sections from APP/PS1 mice are generally less ramified and are darkly stained because of iron deposition (dark brown/black), for example in the inset. The Aβ deposits (shown in pink in the section from APP/PS1 mice and marked by arrows) are surrounded by darkly stained, iron‐laden Iba+ microglia. There was no evidence of iron staining in Iba+ microglia in WT mice and some lighter stained cells that are distant from the Aβ plaques are present in the section from APP/PS1 mice. A significant increase in iron+ Iba+ cells was observed in sections from APP/PS1, compared with WT, mice (C; **P < 0.01; Student’s t test for independent means; n = 6 and 8 for WT and APP/PS1 mice, respectively). D. The evidence indicates that the Iba+ cells (red) that surrounded the Aβ plaques (bright green) were PFKFB3+ (yellow) suggesting that these cells are glycolytic. The arrows indicate two sample cells close to the Aβ plaques, shown in the insert, that are Iba+ PFKFB3+.
Microglia from APP/PS1 mice are glycolytic and less phagocytic than cell from WT mice
To confirm this, microglia were isolated from APP/PS1 mice and WT mice and stained for PFKFB3 and the data show that there was a genotype‐related increase in PFKFB3 immunostaining (Figure 8A) and that mean cytosolic PFKFB3 (Figure 8B), but not nuclear PFKFB3 (Figure 8C), was significantly increased in cells from APP/PS1 mice (**P < 0.01; Student’s t test for independent means); a significant genotype‐related increase in total PFKFB3 was also observed (**P < 0.01; Student’s t test for independent means; Figure 8D). The localization of PFKFB3 to the cytosol is relevant since this is the site of glycolysis. Consistent with the data generated in IFNγ+Aβ‐treated cells, we found that microglia from APP/PS1 mice, which we show are glycolytic and iron retentive, had a reduced capacity to engulf Aβ (Figure 9A) and therefore the number of 6e10+ Iba1+ cells was significantly decreased in cells isolated from APP/PS1 mice compared with WT mice (**P < 0.01; Student’s t test for independent means; Figure 9B).
Figure 8.
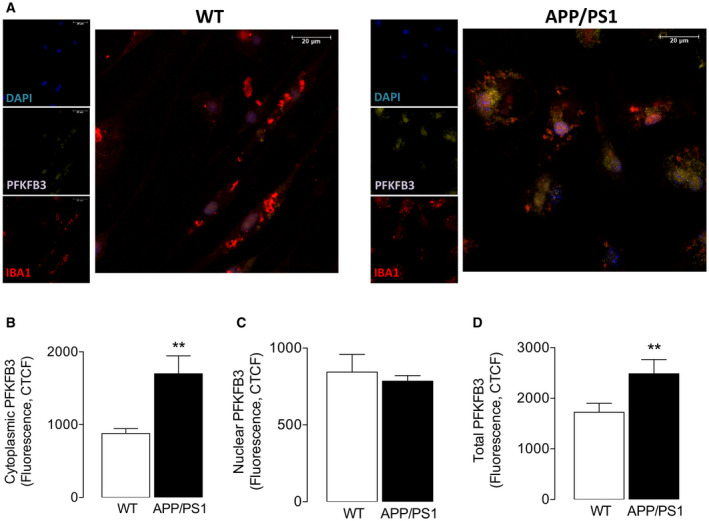
Microglia from APP/PS1 mice exhibit increased PFKFB3. Isolated microglia from wild‐type and APP/PS1 mice were assessed for PFKFB3+ staining as described in the Methods. A. A marked increase in PFKFB3 staining was observed in isolated microglia from APP/PS1, compared with WT, mice. B‐D. Cytoplasmic PFKFB3 (B), but not nuclear PFKFB3 (C), was significantly increased in cells from APP/PS1 mice (**P < 0.01; Student’s t test for independent means) and a significant genotype‐related increase in total PFKFB3 was also observed (**P < 0.01; Student’s t test for independent means). Data are means ± SEM (n = 4 and 5 for APP/PS1 and WT mice, respectively).
Figure 9.
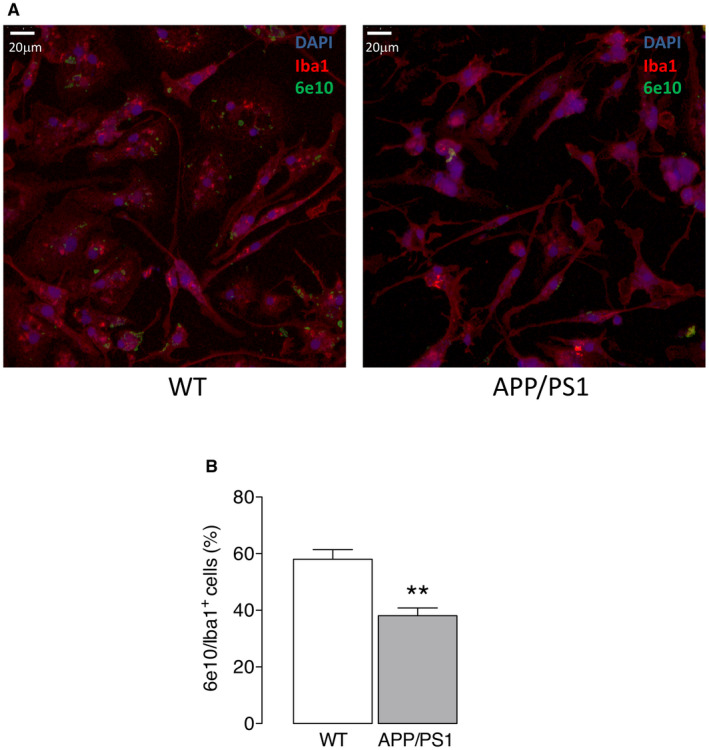
Phagocytosis of Aβ was decreased in microglia from APP/PS1 mice. Isolated microglia from wild‐type and APP/PS1 mice were assessed for uptake of Aβ by staining with 6e10 as described in the Methods. The number of 6e10+ Iba1+ cells was decreased in cells isolated from APP/PS1 mice compared with WT mice as indicated by the representative immunohistogram and by analysis of the mean data (**P < 0.01; Student’s t test for independent means; n = 4 and 5 for APP/PS1 and WT mice, respectively).
Discussion
We set out to determine whether microglia that are exposed to inflammatory stimuli can be identified by an inflammatory, metabolic and iron‐retentive signature and to determine the impact of these changes on cell function. IFNγ and Aβ increased the expression of inflammatory markers TNFα and iNOS, triggered a switch toward glycolysis and stimulated iron accumulation in microglia from neonatal mice. Likewise, microglia from APP/PS1 mice, in which inflammatory changes have been consistently described, exhibited a glycolytic and iron‐retentive phenotype. The evidence indicates that these cells have a reduced ability to phagocytose Aβ, perhaps because of the switch toward the metabolically inefficient glycolysis.
In macrophages, the accepted view is that inflammatory stimuli switch the cells toward a glycolytic phenotype 12, 24, and this rapid change is considered to support the immune function of these cells 24. Here we show that IFNγ+Aβ predictably increased TNFα and iNOS in microglia and that this was paralleled by a switch toward a glycolytic phenotype indicating that glycolysis is increased in inflammatory microglia as it is in inflammatory macrophages. IFNγ alone is also sufficient to induce similar responses in microglia 15 and in BV2 cells 31, 44 but our data indicate that Aβ alone did not significantly increase glycolysis, but in combination with LPS, it induced a significant increase 36. In the present study, despite the increase in glycolysis, there was no evidence of a change in oxidative metabolism in IFNγ+Aβ‐treated microglia.
Consistent with its impact on glycolysis in microglia, IFNγ+Aβ increased the expression of hexokinase II and PKM2, the enzymes that catalyze the first and last reactions in glycolysis, and IFNγ+Aβ also increased PFKFB3. PFKFB3 results in the production of fructose 2,6‐bisphosphate, which is an allosteric activator of phosphofructokinase 35, the enzyme responsible for the conversion of fructose‐6‐phosphate to fructose‐1, 6‐bisphosphate which is a rate‐limiting, irreversible step in glycolysis. This is therefore a control point in the pathway and PFKFB3 is an acknowledged key regulator of glycolysis. Among the factors that trigger activation of PFKFB3 are inflammatory mediators; for example, IL‐6 increased PFKFB3 mRNA in mouse embryonic fibroblasts 1 and cancer cell lines 14 and several studies have indicated that LPS triggers PFKFB3 in macrophages 37, 40. Few studies have investigated factors that drive PFKFB3 in microglia but we have reported that IFNγ alone 15 and also LPS+Aβ 36 exert this effect. HIF‐1α is recognized as a potent activator of PFKFB3 and this has been described in fibroblasts 25, 30 and macrophages 40. In turn, HIF‐1α is regulated by reactive oxygen species 28, 29. It has been suggested that, in macrophages, the increase in glycolysis is necessary to facilitate the maintenance of the inflammatory response and that this, at least in some circumstances, is primarily dependent on increased glucose uptake, increased hexokinase activity and increased PFKFB3 triggered by HIF‐1α 18. Indeed, recent findings revealed that the LPS‐induced inflammatory and metabolic response in macrophages is dependent on HIF‐1α and also demonstrated that inflammatory and metabolic response induced in macrophages by infection of mice with L. monocytogenes or C. albicans was compromised in HIF‐1α−/− mice 18. Here we show that IFNγ+Aβ increases both HIF‐1α and reactive oxygen species production providing indirect evidence that these factors play a role in modulating PFKFB3 in microglia as they do in other cells.
An important finding in macrophages is that increased glycolysis is associated with increased efferocytosis of infected cells which was accompanied by increased uptake of a glucose analog, 2‐(N‐(7‐nitrobenz‐2‐oxa‐1,3‐diazol‐4‐yl)amino)‐2‐deoxyglucose suggesting that an increased supply of glucose to drive PFKFB3‐driven glycolysis supports efferocytosis 16. The present findings suggest that IFNγ+Aβ‐induced glycolytic microglia have a reduced ability to engulf Aβ suggesting that phagocytosis, at least of Aβ, is curtailed when cells utilize this less efficient means of producing ATP. Interestingly, the decrease in phagocytosis was also associated with a decrease in chemotaxis prehaps indicating that microglial function in general is negatively impacted in glycolytic cells.
Iron distribution across cells is determined by a number of transport and storage proteins including ferritin, the main storage protein, and ferroportin, the protein principally responsible for exporting iron from cells. IFNγ+Aβ increased ferritin in microglia while ferroportin was decreased, and consequently iron accumulated in the cells. Therefore, consistent with our previous results 15, we show that iron accumulation is a characteristic of glycolytic microglia. Immortalized microglial cells share this characteristic; it was shown in these cells that LPS increased non‐transferrin‐bound iron uptake and the expression of ferritin and divalent metal transporter‐1, while LPS‐stimulated cells also exhibited an increase in glycolysis 21. Thus, although different inflammatory stimuli share the ability to trigger glycolysis in primary and immortalized microglial cells, LPS decreased oxidative metabolism in immortalized microglia 21, whereas IFNγ+Aβ exerted no effect on primary microglia. The finding that FeCl3 increased PFKFB3 suggests that iron accumulation drives glycolysis and this supports our earlier data 15.
The present data and our previous findings suggest that increased glycolysis in microglia, irrespective of the stimulus, is tightly coupled to increased PFKFB3 15, 36. Therefore, as a proxy measure of glycolysis, we assessed PFKFB3 in tissue sections and isolated microglia prepared from APP/PS1 mice, in which IFNγ and Aβ was increased in vivo, compared with WT mice. The data show that PFKFB3 immunoreactivity was markedly increased in both preparations. Furthermore, analysis of the hippocampal sections, which predictably showed Aβ+ accumulations in APP/PS1 mice compared with WT mice, revealed that these plaques were surrounded by Iba1+ microglia that stained positively for PFKFB3. There was little, if any, staining for Aβ in these cells perhaps suggesting that the cells have a reduced phagocytic capacity. This was confirmed when we evaluated Aβ uptake in these microglia; a marked reduction in Aβ staining was observed in microglia from APP/PS1 mice compared with WT mice. Therefore, the coupling between PFKFB3 and glycolysis that we observed in vitro is also evident in vivo confirming previous results 15. It is well documented that Aβ plaques are more prevalent in female than in male APP/PS1 mice 10, 45 and similar sex‐related changes in inflammatory changes and behavior are also observed, at least in 9–10‐month‐old mice 10, 11. Here, we used males and females and have not systematically assessed whether there are sex‐related differeces in metabolic changes.
To determine whether these changes in microglia of APP/PS1 mice were accompanied by iron accumulation, we first assessed the brain by MRI and the analysis revealed areas of hypointensity in the hippocampus that are indicative of iron accumulation. Subsequent histological analysis indicated that microglia from APP/PS1 mice were iron‐loaded compared with microglia from wild‐type mice. Furthermore, we found that iron‐laden microglia decorated Aβ deposits in APP/PS1 mice and therefore the evidence indicates that the microglia which surround Aβ plaques have a glycolytic and iron‐retentive phenotype and appear to have reduced phagocytic activity. A number of studies have reported that iron accumulation is a characteristic of AD and MRI analysis of tissue slabs from fixed human AD, compared with control, tissue revealed hypointensities in the subiculum extending into the hippocampus and the authors reported that the iron deposition was largely found in microglia 49. Similar areas of hypointensity were identified in slices of entorhinal cortex obtained from AD patients and these were significantly greater in areas of Aβ accumulation compared with the surrounding tissue but persisted to some extent even after the tissue was treated with the iron chelator, deferoxamine 23. A more recent study consolidated these observations and reported that there was accumulation of iron in microglia in the frontal cortex of AD patients where the cells were often localized around Aβ plaques 43. Ferritin‐labeled cells have also been found in close association with Aβ plaques in tissue from AD patients and, although these cells are also observed in APP/PS1 mice, they were not so tightly associated with plaques, highlighting an inter‐species difference in distribution 22. The work of several researchers support the contention that accumulation of metal ions, including iron, is a trigger for Aβ accumulation 5 and the recent observation that iron‐bearing fibrillar aggregrates, as well as iron‐laden plaques, are evident in the brain of APP/PS1 mice support this view, particularly since a direct correlation between fibril density and iron was found 41.
The present data, together with our previous findings that showed FeCl3 could increase glycolysis, suggest that iron accumulation by microglia can trigger a cascade of events, acting as a switch that pushes microglia into an inflammatory and glycolytic phenotype. The data obtained in microglia from APP/PS1 mice confirm the correlation between inflammation, iron accumulation and glycolysis and lead us to propose that driving microglia to utilize the more metabolically inefficient glycolysis limits the ability of microglia to phagocytose Aβ. It remains to be determined whether this sequence of events contributes to the accumulation of Aβ that characterizes AD and if correcting the metabolic shift can impair the progression of the disease.
Declaration
The authors declare no conflict of interest.
Acknowledgments
This work was supported by PI grant to MAL from The Science Foundation Ireland (15/iA/3052), to which we are very grateful.
References
- 1. Ando M, Uehara I, Kogure K, Asano Y, Nakajima W, Abe Y et al (2010) Interleukin 6 enhances glycolysis through expression of the glycolytic enzymes hexokinase 2 and 6‐phosphofructo‐2‐kinase/fructose‐2,6‐bisphosphatase‐3. J Nippon Med Sch = Nippon Ika Daigaku zasshi 77:97–105. [DOI] [PubMed] [Google Scholar]
- 2. Apostolakis S, Kypraiou AM (2017) Iron in neurodegenerative disorders: being in the wrong place at the wrong time? Rev Neurosci 28:893–911. [DOI] [PubMed] [Google Scholar]
- 3. Barrett JP, Costello DA, O’Sullivan J, Cowley TR, Lynch MA (2015) Bone marrow‐derived macrophages from aged rats are more responsive to inflammatory stimuli. J Neuroinflammation 12:67. [DOI] [PMC free article] [PubMed] [Google Scholar]
- 4. Bulk M, Abdelmoula WM, Nabuurs RJA, van der Graaf LM, Mulders CWH, Mulder AA et al (2018) Postmortem MRI and histology demonstrate differential iron accumulation and cortical myelin organization in early‐ and late‐onset Alzheimer’s disease. Neurobiol Aging 62:231–242. [DOI] [PubMed] [Google Scholar]
- 5. Bush AI (2003) The metallobiology of Alzheimer’s disease. Trends Neurosci 26:207–214. [DOI] [PubMed] [Google Scholar]
- 6. Costello DA, Carney DG, Lynch MA (2015) Alpha‐TLR2 antibody attenuates the Abeta‐mediated inflammatory response in microglia through enhanced expression of SIGIRR. Brain Behav Immun 46:70–79. [DOI] [PubMed] [Google Scholar]
- 7. Costello DA, Keenan K, McManus RM, Falvey A, Lynch MA (2016) The age‐related neuroinflammatory environment promotes macrophage activation, which negatively impacts synaptic function. Neurobiol Aging 43:140–148. [DOI] [PubMed] [Google Scholar]
- 8. Dempsey C, Rubio Araiz A, Bryson KJ, Finucane O, Larkin C, Mills EL et al (2016) Inhibiting the NLRP3 inflammasome with MCC950 promotes non‐phlogistic clearance of amyloid‐beta and cognitive function in APP/PS1 mice. Brain Behav Immun 61:306–316. [DOI] [PubMed] [Google Scholar]
- 9. Donovan A, Brownlie A, Zhou Y, Shepard J, Pratt SJ, Moynihan J et al (2000) Positional cloning of zebrafish ferroportin1 identifies a conserved vertebrate iron exporter. Nature 403:776–781. [DOI] [PubMed] [Google Scholar]
- 10. Gallagher JJ, Minogue AM, Lynch MA (2013) Impaired performance of female APP/PS1 mice in the morris water maze is coupled with increased Abeta accumulation and microglial activation. Neurodegener Dis 11:33–41. [DOI] [PubMed] [Google Scholar]
- 11. Galldiks N, Ullrich R, Schroeter M, Fink GR, Kracht LW (2009) Imaging biological activity of a glioblastoma treated with an individual patient‐tailored, experimental therapy regimen. J Neurooncol 93:425–430. [DOI] [PMC free article] [PubMed] [Google Scholar]
- 12. Galvan‐Pena S, O’Neill LA (2014) Metabolic reprograming in macrophage polarization. Front Immunol 5:420. [DOI] [PMC free article] [PubMed] [Google Scholar]
- 13. Halefoglu AM, Yousem DM (2018) Susceptibility weighted imaging: clinical applications and future directions. World J Radiol 10:30–45. [DOI] [PMC free article] [PubMed] [Google Scholar]
- 14. Han J, Meng Q, Xi Q, Zhang Y, Zhuang Q, Han Y et al (2016) Interleukin‐6 stimulates aerobic glycolysis by regulating PFKFB3 at early stage of colorectal cancer. Int J Oncol 48:215–224. [DOI] [PubMed] [Google Scholar]
- 15. Holland R, McIntosh AL, Finucane OM, Mela V, Rubio‐Araiz A, Timmons G et al (2018) Inflammatory microglia are glycolytic and iron retentive and typify the microglia in APP/PS1 mice. Brain Behav Immun 68:183–196. [DOI] [PubMed] [Google Scholar]
- 16. Jiang H, Shi H, Sun M, Wang Y, Meng Q, Guo P et al (2016) PFKFB3‐driven macrophage glycolytic metabolism is a crucial component of innate antiviral defense. J Immunol 197:2880–2890. [DOI] [PubMed] [Google Scholar]
- 17. Jones RS, Minogue AM, Fitzpatrick O, Lynch MA (2015) Inhibition of JAK2 attenuates the increase in inflammatory markers in microglia from APP/PS1 mice. Neurobiol Aging 36:2716–2724. [DOI] [PubMed] [Google Scholar]
- 18. Li C, Wang Y, Li Y, Yu Q, Jin X, Wang X et al (2018) HIF1alpha‐dependent glycolysis promotes macrophage functional activities in protecting against bacterial and fungal infection. Sci Rep 8:3603. [DOI] [PMC free article] [PubMed] [Google Scholar]
- 19. Liu Z, Shen HC, Lian TH, Mao L, Tang SX, Sun L et al (2017) Iron deposition in substantia nigra: abnormal iron metabolism, neuroinflammatory mechanism and clinical relevance. Sci Rep 7:14973. [DOI] [PMC free article] [PubMed] [Google Scholar]
- 20. Lyons A, Minogue AM, Jones RS, Fitzpatrick O, Noonan J, Campbell VA, Lynch MA (2017) Analysis of the impact of CD200 on phagocytosis. Mol Neurobiol 54:5730–5739. [DOI] [PubMed] [Google Scholar]
- 21. McCarthy RC, Sosa JC, Gardeck AM, Baez AS, Lee CH, Wessling‐Resnick M (2018) Inflammation‐induced iron transport and metabolism by brain microglia. J Biol Chem 293:7853–7863. [DOI] [PMC free article] [PubMed] [Google Scholar]
- 22. Meadowcroft MD, Connor JR, Yang QX (2015) Cortical iron regulation and inflammatory response in Alzheimer’s disease and APPSWE/PS1DeltaE9 mice: a histological perspective. Front Neurosci 9:255. [DOI] [PMC free article] [PubMed] [Google Scholar]
- 23. Meadowcroft MD, Peters DG, Dewal RP, Connor JR, Yang QX (2015) The effect of iron in MRI and transverse relaxation of amyloid‐beta plaques in Alzheimer’s disease. NMR Biomed 28:297–305. [DOI] [PMC free article] [PubMed] [Google Scholar]
- 24. Mills EL, O’Neill LA (2016) Reprogramming mitochondrial metabolism in macrophages as an anti‐inflammatory signal. Eur J Immunol 46:13–21. [DOI] [PubMed] [Google Scholar]
- 25. Minchenko A, Leshchinsky I, Opentanova I, Sang N, Srinivas V, Armstead V, Caro J (2002) Hypoxia‐inducible factor‐1‐mediated expression of the 6‐phosphofructo‐2‐kinase/fructose‐2,6‐bisphosphatase‐3 (PFKFB3) gene. Its possible role in the Warburg effect. J Biol Chem 277:6183–6187. [DOI] [PMC free article] [PubMed] [Google Scholar]
- 26. Minogue AM, Jones RS, Kelly RJ, McDonald CL, Connor TJ, Lynch MA (2014) Age‐associated dysregulation of microglial activation is coupled with enhanced blood‐brain barrier permeability and pathology in APP/PS1 mice. Neurobiol Aging 35:1442–1452. [DOI] [PubMed] [Google Scholar]
- 27. Mittal S, Wu Z, Neelavalli J, Haacke EM (2009) Susceptibility‐weighted imaging: technical aspects and clinical applications, part 2. AJNR Am J Neuroradiol 30:232–252. [DOI] [PMC free article] [PubMed] [Google Scholar]
- 28. Movafagh S, Crook S, Vo K (2015) Regulation of hypoxia‐inducible factor‐1a by reactive oxygen species: new developments in an old debate. J Cell Biochem 116:696–703. [DOI] [PubMed] [Google Scholar]
- 29. Niecknig H, Tug S, Reyes BD, Kirsch M, Fandrey J, Berchner‐Pfannschmidt U (2012) Role of reactive oxygen species in the regulation of HIF‐1 by prolyl hydroxylase 2 under mild hypoxia. Free Radic Res 46:705–717. [DOI] [PubMed] [Google Scholar]
- 30. Obach M, Navarro‐Sabate A, Caro J, Kong X, Duran J, Gomez M et al (2004) 6‐Phosphofructo‐2‐kinase (pfkfb3) gene promoter contains hypoxia‐inducible factor‐1 binding sites necessary for transactivation in response to hypoxia. J Biol Chem 279:53562–53570. [DOI] [PubMed] [Google Scholar]
- 31. Orihuela R, McPherson CA, Harry GJ (2016) Microglial M1/M2 polarization and metabolic states. Br J Pharmacol 173:649–665. [DOI] [PMC free article] [PubMed] [Google Scholar]
- 32. Ransohoff RM (2016) How neuroinflammation contributes to neurodegeneration. Science 353:777–783. [DOI] [PubMed] [Google Scholar]
- 33. Rathnasamy G, Ling EA, Kaur C (2013) Consequences of iron accumulation in microglia and its implications in neuropathological conditions. CNS Neurol Disord Drug Targets 12:785–798. [DOI] [PubMed] [Google Scholar]
- 34. Rathore KI, Redensek A, David S (2012) Iron homeostasis in astrocytes and microglia is differentially regulated by TNF‐alpha and TGF‐beta1. Glia 60:738–750. [DOI] [PubMed] [Google Scholar]
- 35. Ros S, Schulze A (2013) Balancing glycolytic flux: the role of 6‐phosphofructo‐2‐kinase/fructose 2,6‐bisphosphatases in cancer metabolism. Cancer Metab 1:8. [DOI] [PMC free article] [PubMed] [Google Scholar]
- 36. Rubio‐Araiz A, Finucane OM, Keogh S, Lynch MA (2018) Anti‐TLR2 antibody triggers oxidative phosphorylation in microglia and increases phagocytosis of beta‐amyloid. J Neuroinflammation 15:247. [DOI] [PMC free article] [PubMed] [Google Scholar]
- 37. Ruiz‐Garcia A, Monsalve E, Novellasdemunt L, Navarro‐Sabate A, Manzano A, Rivero S et al (2011) Cooperation of adenosine with macrophage Toll‐4 receptor agonists leads to increased glycolytic flux through the enhanced expression of PFKFB3 gene. J Biol Chem 286:19247–19258. [DOI] [PMC free article] [PubMed] [Google Scholar]
- 38. Salvador GA (2010) Iron in neuronal function and dysfunction. BioFactors 36:103–110. [DOI] [PubMed] [Google Scholar]
- 39. Song N, Wang J, Jiang H, Xie J (2010) Ferroportin 1 but not hephaestin contributes to iron accumulation in a cell model of Parkinson’s disease. Free Radic Biol Med 48:332–341. [DOI] [PubMed] [Google Scholar]
- 40. Tawakol A, Singh P, Mojena M, Pimentel‐Santillana M, Emami H, MacNabb M et al (2015) HIF‐1alpha and PFKFB3 mediate a tight relationship between proinflammatory activation and anerobic metabolism in atherosclerotic macrophages. Arterioscler Thromb Vasc Biol 35:1463–1471. [DOI] [PMC free article] [PubMed] [Google Scholar]
- 41. Telling ND, Everett J, Collingwood JF, Dobson J, van der Laan G, Gallagher JJ et al (2017) Iron biochemistry is correlated with amyloid plaque morphology in an established mouse model of Alzheimer’s disease. Cell Chem Biol 24:1205–1215 e3. [DOI] [PubMed] [Google Scholar]
- 42. Urrutia P, Aguirre P, Esparza A, Tapia V, Mena NP, Arredondo M et al (2013) Inflammation alters the expression of DMT1, FPN1 and hepcidin, and it causes iron accumulation in central nervous system cells. J Neurochem 126:541–549. [DOI] [PubMed] [Google Scholar]
- 43. van Duijn S, Bulk M, van Duinen SG, Nabuurs RJA, van Buchem MA, van der Weerd L, Natte R (2017) Cortical iron reflects severity of Alzheimer’s disease. J Alzheimers Dis 60:1533–1545. [DOI] [PMC free article] [PubMed] [Google Scholar]
- 44. Voloboueva LA, Emery JF, Sun X, Giffard RG (2013) Inflammatory response of microglial BV‐2 cells includes a glycolytic shift and is modulated by mitochondrial glucose‐regulated protein 75/mortalin. FEBS Lett 587:756–762. [DOI] [PMC free article] [PubMed] [Google Scholar]
- 45. Wang J, Tanila H, Puolivali J, Kadish I, van Groen T (2003) Gender differences in the amount and deposition of amyloidbeta in APPswe and PS1 double transgenic mice. Neurobiol Dis 14:318–327. [DOI] [PubMed] [Google Scholar]
- 46. Wang SM, Fu LJ, Duan XL, Crooks DR, Yu P, Qian ZM et al (2010) Role of hepcidin in murine brain iron metabolism. Cell Mol Life Sci 67:123–133. [DOI] [PMC free article] [PubMed] [Google Scholar]
- 47. Ward RJ, Zucca FA, Duyn JH, Crichton RR, Zecca L (2014) The role of iron in brain ageing and neurodegenerative disorders. Lancet Neurol 13:1045–1060. [DOI] [PMC free article] [PubMed] [Google Scholar]
- 48. Wessling‐Resnick M (2010) Iron homeostasis and the inflammatory response. Annu Rev Nutr 30:105–122. [DOI] [PMC free article] [PubMed] [Google Scholar]
- 49. Zeineh MM, Chen Y, Kitzler HH, Hammond R, Vogel H, Rutt BK (2015) Activated iron‐containing microglia in the human hippocampus identified by magnetic resonance imaging in Alzheimer disease. Neurobiol Aging 36:2483–2500. [DOI] [PMC free article] [PubMed] [Google Scholar]
- 50. Zhou S, Du X, Xie J, Wang J (2017) Interleukin‐6 regulates iron‐related proteins through c‐Jun N‐terminal kinase activation in BV2 microglial cell lines. PLoS One 12:e0180464. [DOI] [PMC free article] [PubMed] [Google Scholar]
- 51. Zhu Y, Wang B, Tao K, Yang H, Wang Y, Zhou T et al (2017) Iron accumulation and microglia activation contribute to substantia nigra hyperechogenicity in the 6‐OHDA‐induced rat model of Parkinson’s disease. Parkinsonism Relat Disord 36:76–82. [DOI] [PubMed] [Google Scholar]