

Abstract
The complement pathway has potential contributions to both white (WM) and grey matter (GM) pathology in Multiple Sclerosis (MS). A quantitative assessment of complement involvement is lacking. Here we describe the use of Tissue MicroArray (TMA) methodology in conjunction with immunohistochemistry to investigate the localization of complement pathway proteins in progressive MS cortical GM and subcortical WM. Antibodies targeting complement proteins C1q, C3b, regulatory proteins C1 inhibitor (C1INH, complement receptor 1 (CR1), clusterin, factor H (FH) and the C5a anaphylatoxin receptor (C5aR) were utilised alongside standard markers of tissue pathology. All stained slides were digitised for quantitative analysis. We found that numbers of cells immunolabelled for HLA‐DR, GFAP, C5aR, C1q and C3b were increased in WM lesions (WML) and GM lesions (GML) compared to normal appearing WM (NAWM) and GM (NAGM), respectively. The complement regulators C1INH, CR1, FH and clusterin were more abundant in WM lesions, while the number of C1q+ neurons were increased and the number of C1INH+, clusterin+, FH+ and CR1+ neurons decreased in GM lesions. The number of complement component positive cells (C1q, C3b) correlated with complement regulator expression in WM, but there was no statistical association between complement activation and regulator expression in the GM. We conclude that TMA methodology and quantitative analysis provides evidence of complement dysregulation in MS GML, including an association of the numerical density of C1q+ cells with tissue lesions. Our work confirms that complement activation and dysregulation occur in all cases of progressive MS and suggest that complement may provide potential biomarkers of the disease.
Keywords: complement, immunohistochemistry, multiple sclerosis, tissue microarray
Introduction
Pathology in multiple sclerosis (MS) is typified by white matter lesions (WML), with characteristic inflammation, demyelination and axonal loss (neuro‐degeneration) 12, 18, 19, 25. Lesions are also found in sub‐cortical and cortical gray matter (GML), the latter being a hallmark of the progressive phase 2, 4, 7, 14, 17, 22, 27, 29, 30.
There is an urgent need to uncover the components of the CNS inflammatory response responsible for white and gray matter pathology in progressive MS in order to inform therapies that slow pathological and neurological decline. Among the implicated components, there is growing pathological evidence for a significant contribution of complement (C), to neuro‐inflammation in MS 3, 5, 14, 16, 21, 23, 37.
Activation of C is a major driver of inflammation and pivotal to innate and adaptive immune responses 24. Glia and neurons synthesize the classical pathway activation protein C1q, which binds numerous potential ligands to initiate activation and generation of active products, including the lytic membrane attack complex (MAC) and the anaphylactic/chemotactic peptides C3a and C5a, chemo‐attractants for microglia expressing C5aR 8, 38. To limit self‐injury, neurons and glia express numerous C regulatory proteins (CReg) including C1INH (C1 activation blockade), CR1, FH (alternative pathway regulation) and clusterin (MAC assembly inhibition) 38.
We have previously reported detailed quantitative immunohistochemical studies of complement proteins, activators and regulators, showing increased C in plaque, peri‐plaque and NAWM of progressive MS compared with normal non‐inflammatory control tissue 16 as well as in cortical gray matter lesions compared with non‐inflamed control tissue 37. Other studies in MS have focused on determining cellular localization of individual C proteins 1, 5, 21. Here, to better understand the role of C activation and regulation in progressive MS we have used tissue microarray (TMA) methodology 36, quantitative pathology and statistical analysis. This approach provides an unbiased, high throughput methodology for analyzing tissue for localization of key C proteins and regulators that can be correlated with measures of pathology in white and gray matter MS lesions.
Material and Methods
Post‐mortem cohort
Archived formalin fixed paraffin embedded (FFPE) tissue blocks obtained at autopsy from clinically and neuropathologically validated progressive MS cases were provided by the Multiple Sclerosis Tissue Bank Imperial College, London, under South East Wales Research Ethics committee approval [10/WSE02/4]). Tissue blocks were sampled from neocortex (WM and GM) and subcortical (WM and GM) sites.
Fourteen blocks from 13 cases of progressive MS were used: mean age 51.1 years (38–79); clinical diagnosis: 9 secondary progressive MS (SPMS) (2 different FFPE blocks were used for case MS230): 4 primary progressive MS (PPMS). Clinical information, including age, sex, clinical onset and disease course are presented in Table 1.
Table 1.
Chronic progressive MS case details. Mean age: 51.1 years, 10F:3M, Mean DTP: 18.2 hours, Mean DD: 25.3 years (n = 13 cases; 2 blocks taken from case MS230). All blocks contained cortical GM and subcortical WM. Abbreviations: DTP = death to preservation time; DD = disease duration; SP = secondary progressive; PP = primary progressive.
| Autopsy number | Age | Sex | DTP time (hrs) | MS disease classification | Disease duration (yrs) | Cause of death |
|---|---|---|---|---|---|---|
| MS106 | 39 | F | 18 | PP | 21 | Bronchopneumonia |
| MS107 | 38 | M | 19 | PP | >16 | Aspiration pneumonia, pulmonary edema |
| MS160 | 44 | F | 18 | SP | 15 | Aspiration pneumonia, MS |
| MS197 | 51 | F | 10 | SP | 27 | Bronchopneumonia, MS |
| MS203 | 53 | F | 17 | SP | 27 | MS |
| MS225 | 79 | F | 23 | SP | 32 | MS, diabetes mellitus, recurrent DVT |
| MS230 | 42 | F | 31 | SP | 20 | MS |
| MS234 | 39 | F | 15 | PP | 15 | Pulmonary embolism, pneumonia |
| MS249 | 59 | F | 8 | SP | 42 | Chest infection, heart failure |
| MS255 | 45 | M | 24 | SP | 25 | Bronchopneumonia, advanced MS |
| MS272 | 64 | F | 8 | SP | 37 | Aspiration pneumonia Angiomatous meningioma (Grade I, WHO 2007) |
| MS273 | 61 | M | 24 | PP | 31 | UTI, septicemia, MS |
| MS377 | 50 | F | 22 | SP | 21 | Aspiration pneumonia |
FFPE tissue blocks were obtained from cases of Alzheimer's disease (n = 4; frontal and temporal lobe) and Herpes Simplex virus encephalitis (n = 2; temporal lobe; supplied by Brains for Dementia Research, Institute of Psychiatry Kings College, London, UK and The Thomas Willis Brain Bank, Oxford University, Oxford, UK) as positive staining controls for this study. All blocks were stained with the same antibodies, in the same experimental run, as the TMA cores (Table 2, Supporting Information Figures S1–S3).
Table 2.
Control cases. Clinical details of neuroinflammatory control cases; n = 6, mean age at death = 73.8 years, DTP = 50.3 hours, and non‐inflammatory control cases; n = 3, mean age at death = 75.0 years, DTP = 25.3 hours. Abbreviations: DTP = death to tissue preservation time.
| Autopsy number | Age | Sex | Death to tissue preservation time (hrs) | Clinical diagnosis | Neuropathological findings |
|---|---|---|---|---|---|
| B5125–9 | 54 | M | 96 | Encephalitis | Herpes Simplex Encephalitis |
| B5046–15 | 42 | M | 72 | Encephalitis | Herpes Simplex Encephalitis |
| A173/05 | 81 | F | 17 | Dementia | Alzheimer's Disease Braak V |
| A192/06 | 96 | F | 19 | Dementia | Alzheimer's Disease Braak V |
| A303/09 | 80 | M | 60 | Dementia | Alzheimer's Disease Braak III |
| A307/07 | 90 | M | 38 | Dementia | Alzheimer's Disease Braak VI |
| CO38 | 85 | M | 27 | Ischemic heart disease | None |
| CO40 | 86 | F | 29 | Acute cortical infarction | Localized cortical infarction |
| CO41 | 54 | M | 20 | Lung cancer | None |
FFPE tissue blocks were also obtained from control non‐inflammatory brain tissue cortex of three cases; CO38, CO40, CO41 (see Table 2 for clinical details and tissue preservation times), as described in the control cohort of Ingram and Loveless 16. Tissue blocks were provided by the Multiple Sclerosis Tissue Bank Imperial College, London.
Lesion classification
From each FFPE block, 4 micron sections were cut and stained with hematoxylin & eosin (H&E) and Luxol fast blue (LFB). Immunohistochemistry for lesion classification was performed following deparaffinization and rehydration through a graded series of ethanol : H2O mixtures. Antigen retrieval was performed using 0.05% citraconic anhydride (pH 7.4; Sigma) and all immunohistochemistry (IHC) was performed using a DAKO autostainer, as previously described 16.
Lesion classification was based on staining with the following antibody panel: anti‐HLA‐DR, anti‐Iba (ionized calcium binding adaptor molecule 1, microglia marker), anti‐MOG (myelin oligodendrocyte glycoprotein), anti‐CD20 (B lymphocyte marker) and anti‐CD3 (pan‐T lymphocyte marker) (see Table 3).
Table 3.
Antibodies used for immunohistochemistry. Citraconic anhydride (CA) buffer (pH 7.4) was used for antigen retrieval for all antibodies except Iba‐1 and C5aR, which used 0.01 M Sodium Citrate (SC) buffer (pH 6), biotin‐tyramine and ABC staining method. Abbreviations: mAb = monoclonal antibody; pAb = polyclonal antibody; Conc = concentration.
| Antibody name | Antigen/target | Type, species | Isotype | Source | Working conc (µg/mL) | Antigen retrieval method |
|---|---|---|---|---|---|---|
| HLA‐DR | Microglia | mAb, mouse | IgG1 | DAKO #M0775 | 39.50 | CA/Heat |
| Iba‐1 | Microglia | pAb, rabbit | IgG | WAKO/Alpha Labs #019–19741 | 0.1 | SC/Heat |
| GFAP | Astrocytes | mAb, mouse | IgG1 | DAKO #M0761 | 7.88 | CA/Heat |
| MOG Y10 | Myelin oligodendrocyte glycoprotein | mAb, mouse | IgG1 | In‐house | 10 | CA/Heat |
| Fibrinogen | Fibrinogen | pAb, rabbit | IgG | Abcam #Ab34269 | 1:75 diln of stock solution | CA/Heat |
| C1q | C1q | pAb, rabbit | IgG | Alere #YYAO13602 | 36 | CA/Heat |
| C3–30 | C3b, iC3b | mAb, mouse | IgG1 | In‐house | 3.21 | CA/Heat |
| C1INH | C1 inhibitor | pAb, rabbit | IgG | In‐house | 42.3 | CA/Heat |
| CR1 | CR1 | pAb, rabbit | IgG | In‐house | 6 | CA/Heat |
| Affinity purified anti‐Clusterin | Clusterin | pAb, rabbit | IgG | In‐house | 2.2 | CA/Heat |
| Affinity purified Poly FH | FH | pAb, rabbit | IgG | In‐house | 2.8 | CA/Heat |
| MBI‐15 | FH 10–15 SCRs | mAb, mouse | IgG1 | In‐house | 14 | CA/Heat |
| Ox‐24 | N‐terminal of FH | mAb, mouse | IgG1 | In‐house | 56 | CA/Heat |
| MBC‐125 | FH‐related proteins 1/2/5 | mAb, mouse | IgG1 | In‐house | 57.2 | CA/Heat |
| C5aR | C5a Receptor/Anti‐CD88 | pAb, rabbit | IgG | BD Bioscience #550733 | 0.31 | SC/Heat |
Identification of demyelinated white matter and gray matter lesions for TMA construction
Conventional histological staining with H&E, LFB, anti‐HLA and anti‐MOG identified areas containing WML or GML. Applying criteria described by Lassmann 18, 19, all WML selected were classified as slowly expanding‐chronic active plaques (residual inflammation in center of demyelinated plaque with peripheral boundary of activated microglia/macrophages containing myelin degradation products). Cortical GML were classified as type I (involving cortical GM and subcortical WM), type II (intracortical) or type III (involving the subpial layers of the neocortex) cortical GML based on location, according to Peterson 26. WML and GML immunolabeling for B and T cell lymphocytes was restricted to a perivascular and meningeal distribution in all sections (16).
A single block per case, except for two blocks from two independent lesions (case MS230), containing either chronic active WML or type 1 cortical GML or both, of sufficient size for tissue core sampling, were selected following neuropathological analysis for tissue microarray construction.
Tissue selection and construction of TMA
In all MS cases, three separate tissue cores (0.6 mm diameter; 0.28 mm2 area) were obtained from each lesion or normal tissue area. Extraction of three tissue cores per area of interest has been shown to increase concordance between quantification obtained with TMA cores and conventional wax sections (36). A Beecher MTA‐1 manual tissue arrayer (Estigen OU, Tartu, Estonia), with a needle punch of diameter 0.6 mm, was inserted into the marked areas on the donor blocks corresponding to the site of the lesion. The donor tissue core was inserted into the recipient paraffin wax block according to the array coordinates defined in the pre‐determined template. Two TMA wax blocks were assembled; one containing 120 tissue cores, the other, 110 cores taken from the 14 individual FFPE donor blocks, as described. In total, 224 tissue cores were available for analysis (6 were not usable) with WM (n = 51), WML (n = 82; including WM lesion center and WM lesion edge), GM (n = 56), GML (n = 35; including GM lesion center and GM lesion edge) (see Figure 1).
Figure 1.
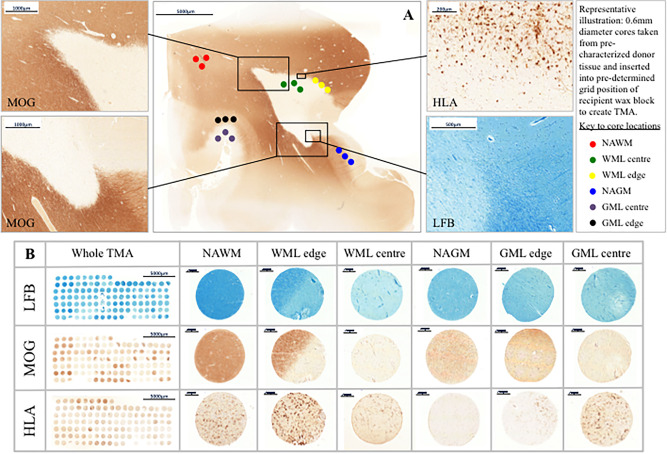
Tissue characterization and TMA methodology. Panel A; Luxol Fast Blue (LFB) staining and antibodies to MOG and HLA were used to characterize whole sections from FFPE MS tissue blocks in terms of demyelination and inflammation. All sampled white matter lesions were classified as chronic active inflammatory lesions and cortical gray matter lesions classified based on their location within the neocortex. Three cores per region of interest, each of 0.6 mm diameter (0.28 mm2 area) were extracted using a MicroArrayer from the donor block and transferred to a recipient in a predetermined grid location. Panel B; examples of whole TMAs stained with LFB, MOG and HLA and cores from each area of interest; normal appearing white matter (NAWM), white matter lesion edge and lesion center, normal appearing gray matter (NAGM), gray matter lesion edge and lesion center. Cores from lesion edge and lesion center were combined and labeled white matter lesion (WML) and gray matter lesion (GML) for analysis. Scale bars are shown. Abbreviations: LFB; Luxol fast blue, MOG; myelin oligodendrocyte glycoprotein, FFPE; formalin fixed paraffin embedded.
Immunohistochemistry
From each TMA block, 4 micron thick sections were cut. The following antibodies were used to detect C activation proteins and CReg; mAb C3‐30 (detects opsonins C3b and iC3b), anti‐C1q, anti‐C1INH, anti‐CR1, anti‐clusterin, anti‐C5aR. A panel of three anti‐FH antibodies and a mAb (MBC‐125) recognizing FH‐related proteins 1, 2 and 5 (FHR 1,2,5) were included to differentiate staining for FH and the FHRs. Sections from the TMAs, control inflammatory brain tissue and control non‐inflammatory brain tissue, as detailed above, were processed and stained as described (see Table 3 for antibody details and staining conditions, and Supporting Information Figures S1–S3). Appropriate isotype‐staining with anti‐IgG1 antibody using control and negative control tissue were also included with each using methods described 16, 37. Anti‐fibrinogen antibody was used to stain paraffin wax sections of kidney, TMA and control non‐inflamed cortex cases (see Supporting Information Figure S1).
In situ hybridization
In situ hybridization (ISH) was performed using a 5′ fluorescein (FAM)‐labeled 19mer antisense oligonucleotide containing nucleic acid (LNA) and 2′‐O‐methyl (2′‐O‐Me)‐RNA moieties in a 1:2 ratio. Probes: antisense C1QA (NM_015991) FAM‐TggTccTugAugTuuCcu; scrambled C1QA FAM‐GuuGuuCggTcuCuaGucT; antisense C3 (NM_000064) FAM‐TaaTccAccAauCauTucT; sense C3 FAM‐AgaAauGauUggUggAuuA (capitals indicate LNA and lower case 2′‐O‐Me RNA; Eurogentec, Southampton, UK). Following de‐waxing, rehydration and antigen retrieval, sections were pre‐hybridized in hybridization mix 37 before probe hybridization for 30 min in the same solution. Sections were then washed in decreasing concentrations of saline‐sodium citrate buffer, washed in PBS, incubated with a peroxidase conjugated goat anti‐FAM (Vector Labs) and visualized with DAB. Sections were then blocked, incubated with mouse anti‐Human HuC/HuD neuronal protein overnight (clone 16A11, ThermoFisher Scientific), followed by a horse anti‐mouse biotin conjugated secondary, an avidin–biotin‐AP tertiary and Vector Blue AP substrate (all Vector Labs), Sections were dehydrated, cleared in histoclear and coverslipped in VectaMount (Vector Labs).
Quantification of TMA immunolabeling
Individual immunolabeled TMA cores were digitally imaged (Zeiss Mirax slide scanner and Pannoramic Viewer 3DHistech software). Quantification was performed manually using Image J software (http://rsb.info.nih.gov/ij/) by observers (JWN, PS, OWH) blinded to TMA identity and antibody labeling; data were exported to Excel (Microsoft Office 2010). Total number of neurons was quantified from the LFB stained slides, identified by the presence of an apical dendrite, nucleus and nucleolus. For analysis, each core was classified, the cells counted and considered individually. The median number of immunolabeled cells per tissue core (0.28 mm2) for each C protein or cell phenotype marker was calculated and statistical analysis carried out using R v3 0.2 software (https://www.R-project.org/).
Statistical analysis
Comparisons in NAWM versus WML and NAGM versus GML of the total number of immunolabeled cells for each antibody‐stained core was performed using Mann–Whitney U tests and significance taken if P < 0.05. For each tissue of interest, numbers of immunolabeled cells were counted for individual tissue cores; three separate cores were obtained from each lesion or normal tissue sample.
In order to examine the relationship between individual pairs of anti‐C antibodies, the number of cells staining positively for each antibody was used as a continuous variable. Pearson correlation was used to examine the relationship between pairs of anti‐C antibodies. All statistical analysis was performed using R v3 0.2 software (https://www.R-project.org/).
Results
Anti‐fibrinogen staining kidney and brain tissues
Kidney sections stained with anti‐fibrinogen antibody (see Table 3 for details) demonstrated positive immunostaining. In brain, cortical anti‐fibrinogen antibody staining was localized to blood vessel walls but was absent in nearby neurons and surrounding neuropil, indicating a lack of blood‐brain barrier disruption (Supporting Information Figure S1); this interpretation was in accord with the findings of van Horssen et al 35. Similar results were obtained using anti‐IgG on control brain tissues showing no evidence for staining of neurons or glia in accord with published results 16 and supporting the lack of anti‐fibrinogen staining interpretation as demonstrating an intact blood brain barrier.
Control non‐inflamed brain tissue
Formalin fixed sections from three cases of non‐inflamed cortex (C038, CO40, CO41, Table 2) were stained with the same anti‐C antibodies as used for the TMA sections (Supporting Information Figure S1). In all cases there was minimal positive immunostaining of neurons and glia replicating our previous results for non‐inflamed cortex 16. There were significantly lower numbers of immunostained neurons and glia in control non‐inflamed tissue as compared with NAWM and NAGM in MS tissue 16. The non‐inflamed tissues in this study were from the same cohort as the previous study.
Neurons and glia from cases of other neuroinflammatory diseases were often positively stained with anti‐C antibodies; examples of typical staining patterns are shown in the supplemental data (Supporting Information Figures S2 and S3).
Astrocytic and microglia activation correlate with elevated numbers of C5aR‐positive cells
We compared cores taken from NAGM, GML, NAWM and WML (Figures 1 and 2) areas in TMA preparations to better understand the role of complement activation in demyelinating lesions. Astrocytes (GFAP+) were found in higher numbers in WML (P < 0.0001) in comparison to NAWM (Figure 2A). There was a significant increase of GFAP+ cells in GML, (P < 0.0001), compared with NAGM. GFAP+ astrocytes represented only approximately 10% of total glia in lesion tissue. There was no difference in the number of Iba‐1 immunolabeled microglia in either WML or GML compared with NAWM or NAGM, respectively; however, HLA‐DR+ activated microglia were increased in WML (P < 0.0001), as compared with NAWM, and in GML compared with NAGM (P < 0.0001). In all tissue types, microglia represented the most frequent immunolabeled cell type (Figure 2A).
Figure 2.

Microglial activation and complement anaphylatoxin receptor expression in MS lesions. Panel A shows a stacked bar chart illustrating the constituent cell types in each of our ROIs. Cells morphologically resembling microglia, astrocytes and neurons were quantified. There was a significant increase in the numbers of GFAP positive astrocytes and HLA positive microglia/ macrophages in WML compared with NAWM, and in GML compared with NAGM (*P < 0.05). Overall there was no significant difference in the total number of Iba‐1 positive microglia in any tissue type or of gray matter neurons whether in lesion or non‐lesion. Panel B; C5aR immunostaining identified cells with microglial/macrophage morphology. There was a significant increase in C5aR stained cells in WML as compared with NAWM (P = 0.00295). IHC shows C5aRpositive staining in NAWM, WML, GML and NAGM (clockwise from top left) of TMA cases MS272 and MS273. Median, IQR and full range of data shown. Scale bars are shown. Abbreviations: NAGM; normal appearing gray matter, GML; gray matter lesion, WM; white matter, WML; white matter lesion, C5aR; C5a receptor.
Anti‐C5aR antibody positively immunostained microglia and a small number of cells with an astrocytic morphology; neurons were negative for C5aR as previously reported 22. C5aR positive cells were increased in WML in comparison to matched NAWM (P < 0.003, Figure 2B).
Immunolabeling for C component proteins and regulators in lesion versus non‐lesion tissue
Total number of C1q immunolabeled cells was increased in WML and GML tissue compared with NAWM (P < 3 × 10⁻⁸) and NAGM (P < 0.007), respectively (Figure 3A). Total number of C3b immunopositive cells per core was also increased in WML and GML tissue compared with NAWM (P < 0.0009) and NAGM (P < 0.03), respectively (Figure 3B).
Figure 3.

Complement Component Expression in MS tissue. We quantified the number of (A) C1q and (B) C3b immunostained cells of all types in normal and lesion cores. Panel A; box plots revealed a significant increase in C1q positive cells in WML tissue and in GML tissue compared with normal appearing WM and GM, respectively. C1q IHC shows immuno‐positive cells with astrocytic morphology in WML of case MS225, neuronal morphology in GML from case MS272 and an absence of staining in NAWM (case MS203) and NAGM (case MS230). Inset: In situ hybridization shows neurons (arrow; brown DAB reaction product) positive for complement C1QA mRNA (a), while the scrambled probe (ISH) is negative (b). All neurons are identified by expression of HuC/D protein by immunohistochemistry (blue reaction product). Panel B; Quantification of C3b positive cells. There was a significant increase in the number of C3b positive cells in WML tissue and in GML tissue compared with normal appearing WM and GM, respectively. IHC shows glial C3b staining from WML of case MS225 (arrows mark positive glia), neuronal and glial staining from GML and GM of case MS272 (inset shows magnified neuron indicating cytoplasmic and surface staining patterns). A decrease in cellular staining is shown in WM from case MS230. Inset: In situ hybridization shows neurons (arrow, brown DAB reaction product) express the mRNA transcript for complement C3 (a) while the ISH sense probe for C3 is negative (b). All neurons are identified by expression of HuC/D protein by immunohistochemistry (blue reaction product). Median, IQR and full range of data shown. Abbreviations: NAGM; normal appearing gray matter, NAWM; normal appearing white matter, WM; white matter, GM; gray matter.
We performed ISH for C1QA and C3 mRNA to test whether cortical neurons are a source of complement in the MS brain (Figure 3). Transcripts of C1QA and C3 were detected in the soma of numerous cortical neurons that were immunostained for the pan‐neuronal protein HuC/D. Sections incubated in the absence of probe (not shown), or with scrambled or sense probe, were negative (Figure 3).
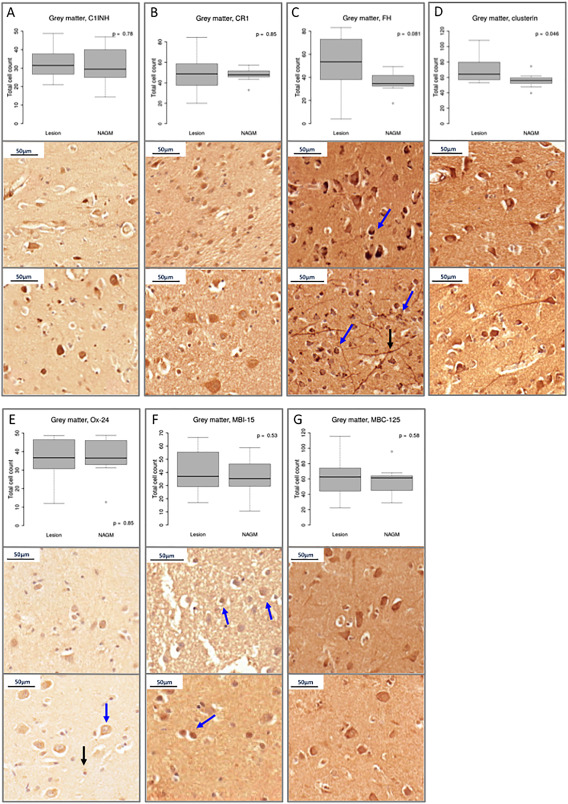
C1INH‐positive glia were increased in WML compared with NAWM (P = 2.7 × 10⁻⁵; Figure 4A). CR1‐positive immunolabeled cells were increased in WML tissue compared with NAWM (P < 0.001) (Figure 4B). FH‐immunolabeled glial cells were increased in WML in comparison to NAWM, detected using polyclonal (P < 0.005) and monoclonal antibodies against distinct FH regions (Ox‐24 vs. FH N‐terminus; MBI‐15 vs. SCRs 11–15; both P < 0.01) (Figure 4C,E,F). MBI‐15 stains only FH (not FHL or FHRs); staining with polyclonal anti‐FH and MBI‐15 were highly correlated in all TMA cores (R 2 = 0.69) and for neuronal staining (R 2 = 0.83; data not shown). Immunolabeling with MBC‐125, specific for FH‐related (FHR) proteins 1, 2 and 5 (present as hetero‐oligomers in vivo), demonstrated increased immunopositive glia in WML compared with NAWM (P < 0.002) (Figure 4G). The number of clusterin‐positive cells was also significantly increased in WML cores (Figure 4D)
Figure 4.

Complement regulator expression in MS white matter. Each of panels A–G: Box plots show total immunostained cell counts and examples of typical staining in WML (top) and NAWM (bottom) of C pathway regulators; C1INH, CR1, FH (as stained with polyclonal anti‐FH antibody, and mAb Ox‐24 and MBI‐15), the terminal complex regulator, clusterin and FH‐Related protein (FHR). All regulators are shown to be increased in WML compared with NAWM (all P < 0.05). Panel A: WML and NAWM IHC from case MS230, inset shows C1INH astrocytic staining from case MS203. Panel B: CR1 positive glia in WML of case MS273 and reduced staining in NAWM of case MS230. Panel C: Positive FH glial staining in an active NAWM peri‐plaque region of case MS197 and lack of cellular staining in NAWM of case MS106. Panel D: Terminal pathway regulator, clusterin positive glia of case MS197 WML edge and reduced in NAWM of case MS230. Monoclonal antibodies Ox‐24 and MBI‐15 both recognize epitopes on FH (N‐terminal and mid‐section, respectively), MBC‐125 is specific for FHR proteins 1/2/5. Panel E: Ox‐24 positive glia from WML and NAWM of case MS377. Panel F: ramified MBI‐15 glia of WML center from case MS377 and reduced staining in NAWM of case MS273. Panel G: FHR positive active glia from WML edge of case MS197 and lack of cellular staining in NAWM of the same case. Median, IQR and full range of data shown. Abbreviations: NAGM; normal appearing gray matter, NAWM; normal appearing white matter, C1INH; C1 inhibitor, CR1; complement receptor 1, FH; Factor H; FHR; Factor H related proteins.
In contrast to findings in WM, we did not observe any difference between the number of GML and NAGM C1INH, CR1, FH (using polyclonal FH and mAbs Ox‐24 and MBI‐15) or FHR (MBC‐125 antibody) immuno‐positive cells (Figure 5); however, clusterin‐positive cells were increased in GML cores in comparison to NAGM (P < 0.05, Figure 5D).
Figure 5.
Complement regulator expression in MS gray matter. Each of panels A–G: Box plots show total immunostained cell counts and examples of typical staining in GML (top) and NAGM (bottom) of C pathway regulators; C1INH, CR1, FH (as stained with polyclonal anti‐FH antibody, and mAb Ox‐24 and MBI‐15), the terminal complex regulator, clusterin and FH‐Related protein (FHR). In contrast to white matter, our analysis revealed the total number of complement regulator positive cells to be unchanged between normal and lesioned GM with the exception of clusterin. Panel A; C1INH positive neurons and glia in GML and NAGM of case MS249. Panel B: CR1 positive GML cells of case MS273 and NAGM of case MS377. Panel C: Polyclonal anti‐FH staining of neuritic‐like processes (black arrow) and granular areas within neurons (blue arrows) in NAGM of case MS160 and GML of case MS225. Panel D: neuronal clusterin staining in GML of case MS272 and NAWM of case MS249. Panel E: Ox‐24 (anti‐FH) positively stained neurons (blue arrow) and glia (black arrow) from GML and NAGM of case MS255. Panel F: MBI‐15 (anti‐FH specific) positively stained GML and NAGM neurons (blue arrows) of cases MS377 and MS234, respectively. Panel G: FHR positive staining in GML and NAGM of case MS225. Median, IQR and full range of data shown. Abbreviations: NAGM; normal appearing gray matter, NAWM; normal appearing white matter, C1INH; C1 inhibitor, CR1; complement receptor 1, FH; Factor H; FHR; Factor H related proteins.
Complement immunolabeling of neurons
We investigated whether neurons and non‐neuronal cells (glial; microglia and astrocytes) stained for C components and regulators, and whether the specific C staining differed between NAGM and GML. Positively stained neurons and non‐neuronal cells were identified and quantified for each of our panel of antibodies (Tables 4 and 5). Overall, total number of neurons did not differ between NAGM and GML cores (data not shown). C1q‐positive and C3b‐positive non‐neuronal cells were increased in GML compared with NAGM (P < 0.0001 and P < 0.0002, respectively) with an accompanying increase in the number of cells positive for regulators and inhibitors (CR1, FH, FHR and clusterin [all P < 0.05, Table 4]). However, in contrast, significantly fewer neurons in GML were immuno‐stained for C regulators C1INH, CR1, FH (Ox‐24) and FHR proteins compared with neurons in NAGM (all P < 0.05); the number of neurons expressing clusterin was similar in GML and NAGM. These data suggest a degree of C dysregulation in GML neurons. In support of this, there was a marked increase in the number of C1q‐positive neurons in GML compared with NAGM (P = 0.0003), but no difference in C3b‐positive neurons (Table 5).
Table 4.
Non‐neuronal cell counts in normal‐appearing gray matter (NAGM) and gray matter lesions (GML).
| Target | Non‐neuronal cell counts | ||||
|---|---|---|---|---|---|
| NAGM | GML | Mann–Whitney U test | |||
| Median | IQR | Median | IQR | P value | |
| C1q | 0.0 | 0.00–1.00 | 9.0 | 4.00–19.50 | <0.0001 |
| C3b | 1.0 | 0.00–6.00 | 10.0 | 2.75–24.75 | 0.00015 |
| C1INH | 12.5 | 10.00–17.00 | 14.0 | 4.00–20.00 | 0.82 |
| CR1 | 9.0 | 6.00–15.00 | 17.0 | 10.00–28.00 | 0.0007 |
| FH | 10.0 | 5.00–13.00 | 17.5 | 9.00–51.00 | 0.004 |
| Clusterin | 11.5 | 8.00–18.00 | 19.0 | 11.25–40.00 | 0.002 |
| Ox‐24 | 10.0 | 6.00–11.00 | 15.5 | 10.00–23.00 | <0.0001 |
| MBI‐15 | 10.0 | 1.50–22.00 | 21.5 | 8.75–38.25 | 0.007 |
| MBC‐125 | 6.0 | 4.75–23.25 | 34.0 | 15.00–48.00 | 0.001 |
Table 5.
Neuronal cell counts in normal‐appearing gray matter (NAGM) and gray matter lesions (GML).
| Target | Neuronal cell counts | ||||
|---|---|---|---|---|---|
| NAGM | GML | Mann–Whitney U test | |||
| Median | IQR | Median | IQR | P value | |
| C1q | 0.0 | 0.00–2.00 | 4.0 | 0.00–6.00 | 0.0003 |
| C3b | 1.0 | 0.00–9.00 | 3.5 | 2.00–8.75 | 0.18 |
| C1INH | 24.0 | 18.00–28.00 | 16.0 | 12.00–20.00 | 0.0003 |
| CR1 | 39.0 | 28.00–45.00 | 25.0 | 18.50–35.00 | 0.002 |
| FH | 27.0 | 19.00–35.00 | 26.0 | 11.70–30.00 | 0.37 |
| Clusterin | 44.5 | 33.75–63.00 | 42.5 | 33.30–53.50 | 0.51 |
| Ox‐24 | 32.5 | 28.50–36.00 | 21.0 | 19.00–24.75 | <0.0001 |
| MBI‐15 | 24.0 | 13.00–30.00 | 20.0 | 10.00–28.75 | 0.21 |
| MBC‐125 | 41.5 | 27.80–51.00 | 29.0 | 17.00–34.00 | 0.005 |
Mann–Whitney U test was used to compare complement proteins and regulator expression on both non‐neuronal (glial) cells and on neuronal cells of NAGM and GML. Positive cells were counted per tissue array core (0.28 mm2 area) and defined as either non‐neuronal (Table 4) or neuronal (Table 5). Median, interquartile range (IQR) and P values are shown. Significance taken at P < 0.05 and shown in BOLD.
Testing the relationship between individual C component staining in MS WM and GM
Correlation of C protein staining (on microglia, astrocytes, neurons) was tested for (i) all cores (Table 6), (ii) white matter cores only (NAWM, WML; edge and center) (Table 7) and (iii) gray matter cores only (NAGM, GML; edge and center) (Table 8). Across all cores, some C components were highly correlated with relevant regulators, while others were not. Total C1q immunopositive cells positively correlated with C3b immuno‐stained cells (Pearson's R 2 = 0.70, P < 0.0001) for all TMA cores, demonstrating that C1q binding is closely associated with C3b deposition in progressive MS (Table 6). C1q signal also correlated with C1INH (R 2 = 0.48, P < 0.0001) and clusterin (R 2 = 0.58, P < 0.0001) signals, providing evidence of a link between C activation and regulation in the tissues (Table 6). Separate analysis in GM and WM cores showed a positive correlation between all components and regulators in WM (all P < 0.05, Table 7); however, in GM many components and regulators showed no correlation, suggesting C dysregulation within cortical GM (Table 8).
Table 6.
Total cell counts (all cores).
| Component/regulator | C1q | C3b | C1INH | Clusterin | CR1 | FH |
|---|---|---|---|---|---|---|
| C1q | n/a | – | – | – | – | – |
| C3b |
R2 = 0.70 P < 0.0001 |
n/a | – | – | – | – |
| C1INH |
R2 = 0.48 P < 0.0001 |
R2 = 0.39 P < 0.0001 |
n/a | – | – | – |
| Clusterin |
R2 = 0.58 P < 0.0001 |
R2 = 0.50 P < 0.0001 |
R2 = 0.47 P < 0.0001 |
n/a | – | – |
| CR1 |
R 2 = 0.097 P = 0.24 |
R 2 = −0.13 P = 0.099 |
R2 = 0.31 P < 0.0001 |
R2 = 0.34 P < 0.0001 |
n/a | – |
| FH |
R2 = 0.38 P < 0.0001 |
R 2 = 0.13 P = 0.12 |
R2 = 0.27 P = 0.0004 |
R2 = 0.59 P < 0.0001 |
R2 = 0.57 P < 0.0001 |
n/a |
Table 7.
White matter cell counts (NAWM, WML; lesion edge and center).
| Component/regulator | C1q | C3b | C1INH | Clusterin | CR1 | FH |
|---|---|---|---|---|---|---|
| C1q | n/a | – | – | – | – | – |
| C3b |
R2 = 0.65 P < 0.0001 |
n/a | – | – | – | – |
| C1INH |
R2 = 0.63 P < 0.0001 |
R2 = 0.59 P < 0.0001 |
n/a | – | – | – |
| Clusterin |
R2 = 0.63 P < 0.0001 |
R2 = 0.61 P < 0.0001 |
R2 = 0.58 P < 0.0001 |
n/a | – | – |
| CR1 |
R2 = 0.46 P < 0.0001 |
R2 = 0.27 P = 0.01 |
R2 = 0.38 P < 0.0001 |
R2 = 0.57 P < 0.0001 |
n/a | – |
| FH |
R2 = 0.47 P < 0.0001 |
R2 = 0.30 P = 0.007 |
R2 = 0.30 P < 0.0001 |
R2 = 0.64 P < 0.0001 |
R2 = 0.65 P < 0.0001 |
n/a |
Table 8.
Gray matter cell counts (NAGM, GML; lesion edge and center). Abbreviations: n/a = not applicable, R 2 = regression coefficient.
| Component/regulator | C1q | C3b | C1INH | Clusterin | CR1 | FH |
|---|---|---|---|---|---|---|
| C1q | n/a | – | – | – | – | – |
| C3b |
R2 = 0.70 P < 0.0001 |
n/a | – | – | – | – |
| C1INH |
R2 = 0.37 P = 0.0065 |
R2 = 0.41 P = 0.0009 |
n/a | – | – | – |
| Clusterin |
R 2 = 0.25 P = 0.08 |
R2 = 0.38 P = 0.003 |
R 2 = 0.15 P = 0.20 |
n/a | – | – |
| CR1 |
R 2 = −0.14 P = 0.31 |
R 2 = 0.04 P = 0.77 |
R 2 = −0.06 P = 0.62 |
R2 = 0.29 P = 0.009 |
n/a | – |
| FH |
R 2 = 0.17 P = 0.25 |
R2 = 0.33 P = 0.01 |
R 2 = 0.07 P = 0.60 |
R2 = 0.39 P < 0.0007 |
R2 = 0.53 P < 0.0001 |
n/a |
Pearson correlation was used to examine the relationships between cells staining positively for each antibody of the Complement Pathways for all tissues types. Correlations were calculated between total cell counts (Table 6), white matter cell counts (Table 7) and gray matter cell counts (Table 8).
Significant correlation was P < 0.05 and shown in BOLD.
Classification tree analysis identifies C1q+ cell number as a predictor of the lesion state
To investigate whether individual or sets of C components strongly predict WML or GML, classification tree analysis was performed using the rpart library in R (https://cran.r-project.org/web/packages/rpart/index.html); this tool partitions data to determine tissue classification. Here all cell types were analyzed; neurons and glia. For GM cores, C1q staining stood out as a lesion discriminator; the cutoff for C1q determined by the model was 8.5: if total C1q positive cells was >8.5/core this signified a lesion, and <8.5 signified normal GM. Likewise, the cutoff determined by the model for WM was 13.5. 69% (18/26) of GML tissue cores had >8.5 C1q‐positive cells compared with 10% (3/30) of NAGM cores and 88% (54/61) of WML tissue cores had >13.5 C1q‐positive cells compared with 2.3% (1/43) of NAWM cores. Although some other C proteins were also predictive, adding in other variables did not improve the capacity of the model to successfully classify cores as either lesion or non‐lesion, demonstrating that number of C1q+ cells best discriminates cortical GM and WM MS lesion from normal tissue.
Discussion
TMA methodology is ideally suited for analyzing tissue marker expression, revealing interactions between large numbers of functionally related proteins and identifying proteins or protein sets that correlate with tissue pathology. Our systematic quantitative analysis revealed that increased immunostaining for C proteins is a ubiquitous feature of WM and GM lesions in progressive MS. Furthermore, the findings suggest that C is dysregulated in GM lesions, leaving cortical GM neurons at risk of C‐mediated damage because of the presence of C1q, in the absence of key complement regulatory proteins. Indeed, statistical analysis has identified total (neurons and glia) C1q‐positive cell number as an independent predictor of lesion presence in GM and WM, suggesting its use as a potential biomarker.
Complement activation immunolabels cells in progressive MS lesions
Anti‐C1q and C3b (iC3b/C3b) positively stained microglia/macrophages (HLA‐DR+) of WML and neurons and microglia (HLA‐DR+) of GML (Tables 1 and 2 and Figure 2). The number of anti‐C3b and ‐C1q immunolabeled cells were strongly correlated (Pearson coefficient R 2 = 0.70, P < 0.0001), providing further evidence for C activation via the classical pathway on glia and neurons in MS plaques 5, 16, 21. We have previously demonstrated using double immunolabeling that C1q and iC3b/C3b co‐localized on reactive astrocytes, microglia and neurons in MS 16, and in situ hybridization by ourselves and others showed expression of both C3 and C1qA mRNA in neurons and microglia in MS and other neurodegenerative diseases 23, 28, 32, 37. C activation is a potential stimulus for microglial activation and expression of reactive oxygen species and pro‐inflammatory cytokines, which are associated with neuronal damage and demyelination 1, 6. Given the paucity of T and B cell lymphocytes in progressive MS lesions 2, 26, C activation likely represents an important contributor to MS pathology.
Although the above data support local C activation in lesions, immunolabeling cannot readily discriminate whether staining represents protein deposited on the cell surface as a result of activation or within the cell cytoplasm as a consequence of biosynthesis. We performed ISH to show C1QA and C3 mRNA is expressed in cortical neurons co‐labeled with the neuron specific marker HuC/D (Figure 3). C1QA and C3 mRNA have been consistently demonstrated in MS sections (23, 37) and in glia from Huntington's disease brain tissue 32. Furthermore anti‐fibrinogen staining of neurons in MS brain was negative supporting the argument that systemic C does not diffuse across the blood–brain barrier in this disease. These data are consistent with the interpretation that the blood–brain barrier is grossly intact in MS 9, 16, and that neuronal and glial C staining in MS represents local C biosynthesis 28.
Complement regulation in progressive MS
The increased number of C1q immunolabeled cells in WML is associated with increased C1INH staining on the same cells, supporting on‐going activation and regulation of the classical pathway in WML. Several other C regulators were also increased in WML compared with NAWM; FH, the main regulator of the alternative pathway 38, CR1, a membrane bound activation pathway regulator, and clusterin, a terminal pathway regulator. There was positive correlation between immunolabeling for C3b and its two main regulators, FH and CR1. Staining for FH is complicated by the fact that a battery of homologous FH‐related proteins (FHRs) exist to control FH activity; many FH antibodies cross‐react with FHRs. To resolve this complexity, we used a panel of anti‐FH and anti‐FHR antibodies; a polyclonal antibody that detects FH and FHRs, two anti‐FH mAbs, one of which (MBI‐15) is FH‐specific, and a mAb that is specific for FHRs 1, 2 and 5 (MBC‐125). Staining with these antibodies demonstrated that both FH and FHRs were present in MS WM lesions, a finding that is in accord with the observed co‐localization of FH and FHR on kidney and retinal cells 13. FHRs are antagonists of FH, blocking its ability to bind C3b and regulate the alternative pathway 10, 11, 13, 15, 31. The demonstration that both FH and FHRs are present in WM lesions raises the possibility that C regulation by FH is antagonized by FHRs in the lesions. In contrast to the findings in WM, expression of C regulators in GM lesions was minimal, suggesting that C activation is poorly controlled in GM.
Complement activation and dysregulation on neurons contribute to neurodegeneration in cortical gray matter lesions
Neuronal cytoplasm C expression has been described in cultured human cells 33 in animal models 5, 28 and in human post mortem brain 16, 23, 37. The ISH images shown here demonstrate C1QA and C3 mRNA expression in neuronal cytoplasm and nuclei, supporting previously published studies 23, 37. Here we showed that significantly increased numbers of C1q immunolabeled neurons (representing >10% of the total neurons) were present in GML tissue cores. This finding agrees with the increased C1q immunolabeling and C1q mRNA expression described in association with degenerating synapses in MS lesions in hippocampus 22, 37. There was also increased C3b staining in GM lesions which, together with the reduced numbers of neurons immunolabeling with C regulators in GML compared with GM, provide strong supporting evidence for C dysregulation and activation on neurons in GML.
TMA analysis; an appropriate methodology for analysis of a complex innate immune pathway
TMA methodology has several advantages over traditional IHC methods; it requires only small amounts of formalin fixed tissue and much reduced quantities of reagents, including expensive antibodies, compared with traditional IHC 31. Furthermore, the TMA approach samples a consistent area of lesion, reduces variability of experimental conditions and increases reliability of immunostaining data, making it an ideal technique to validate newly generated antibodies 36; and compare sets of antibodies as used in this study 10, 11, 31. One possible criticism of this approach when applied to MS tissue is the debate regarding heterogeneity of MS plaque immunopathology 3, 21 such that individual cores will show variations in pathology. To ensure tissue pathology is uniform between TMA cores we only selected chronic active plaques and ensured that the severity of inflammation and pathology was uniform within lesion type by controlling for severity of myelin loss, microglial number and activation status (anti‐Iba and anti‐HLA‐DR) and T and B cell immunostaining.
Conclusion
The C pathways are pivotal for the CNS innate immune response 24; previous studies have shown an association between individual C proteins and MS pathology 5, 16, 21, 37; here, using TMA methodology in MS tissue in conjunction with control tissues and statistical analyses, we have demonstrated a role for C in progressive MS in both WM and GM lesions and demonstrated an association between functionally related C proteins and tissue pathology. Statistical modeling revealed that the number of C1q‐positive cells in WM or GM was highly predictive of a lesion. In GM lesions, the data suggest that C activation is associated with dysregulation; a finding present in other neuroinflammatory diseases such as retinal inflammation in Age Related Macular Degeneration (AMD) 20, 34. AMD is associated with a Tyr402His amino acid substitution in FH and dysregulation and uncontrolled activation of C in the retina. The retinal pathology typically includes deposits of C3, C3d, iC3b, terminal pathway components, clusterin and FHRs 38. In our study, evidence for C dysregulation in GML is provided by an increase of C1q‐positive neurons with reduced immuno‐labeling for the regulators FH, FHR 1/2/5 and C1INH compared with NAGM.
With regard to clinical relevance, measurement of C proteins in serum and CSF is now validated as a biomarker of tissue inflammation in MS 15. Here we show that tissue‐associated C proteins also mark disease in progressive MS and may guide future therapeutic approaches targeting the classical pathway.
Supporting information
Additional Supporting Information may be found in the online version of this article at the publisher's web‐site:
Figure S1. Control Immunohistochemistry examples; non‐inflammatory control tissue and anti‐fibrinogen and IgG1 isotype controls. Panel A: Tissue sections from non‐inflammatory control cases (CO38, 0040, 0041) showing examples of complement staining in NAWM and NAGM. Panel B: lack of cellular fibrinogen staining in NAWM of TMA case MS2SS. Panel C: fibrinogen positive blood vessel wall surrounded by immuno‐negative neurons of NAGM of TMA case MS234. Panels D and E: fibrinogen staining in human kidney as a positive control. Panel F: IgG control staining. Panel G: no primary antibody negative control.
Figure S2. Control Immunohistochemistry examples. Tissue sections from Herpes simplex encephalitis [HSV (cases B5125‐9 and B5046‐15)] immunostained for C proteins investigated in this study; (A) polyclonal antibody to Clq immunolabels several neurons within GM; (B) C3b + glia (arrows) within the WM of temporal lobe; (C) C3b + degenerating neurons within the temporal cortex; (D) C1INH + neurons; (E) clusterin + immunolabeled axons (arrow) and glia within WM of temporal lobe; (F) clusterin + neurons and occasional glia within GM; (G) C5aR + cells with a microglia/macrophage morphology in a perivascular distribution; (H) Ramified C5aR + glia in WML edge. All images 40× magnification.
Figure S3. Control Immunohistochemistry examples. Sections from paraffin wax embedded formalin fixed Alzheimer's disease cerebral cortex immunostained for C proteins; (A) Clq antibody showing positive immunolabeling of pyramidal neurons (A303/09); (B) C3b immunolabeling neurons and amyloid plaques, and occasional glia (A307/07); (C) C1INH labeled glia (A173/05); (D) polyclonal anti‐FH staining with characteristic granular immunolabeling within the neuronal cytoplasm (A173/05); (E) MBC‐125 (FHR protein) immunolabeling of neuronal cytoplasm (A192/07); (F) Ox‐24 antibody demonstrating a similar pattern of immunolabeling of neurons as seen with the polyclonal anti‐FH anti‐sera (A307/07); (G) MBI‐15 (FH‐specific) antibody immunolabeling of neuronal cytoplasm (A307/05); (H) Anti‐clusterin stained neurons from case A303; (I) CR1 positive neurons from GM of case A307.
Acknowledgments
We would like to thank: Dr George Gveric; Multiple Sclerosis Tissue Bank, Imperial College, London. Dr Claire Troakes; London Brains for Dementia Research, Institute of Psychiatry Kings College, London, UK. Ms Carolyn Sloane; The Thomas Willis Brain Bank, Oxford University, Oxford, UK (supported by the Medical Research Council (MRC), Brains for Dementia Research (BDR) (Alzheimer Society and Alzheimer Research UK), Autistica UK and the NIHR Oxford Biomedical Research Center). We also thank the British Neuropathological Society and the MS Society (grant #993) for financial support.
References
- 1. Barnett MH, Parrat JD, Cho ES, Prineas JW (2009) Immunoglobulins and complement in post mortem multiple sclerosis tissue. Ann Neurol 65:32–46. [DOI] [PubMed] [Google Scholar]
- 2. Bö L, Vedler CA, Nyland H, Trapp BD, Mörk SJ (2003) Intracortical multiple sclerosis lesions are not associated with increased lymphocyte infiltration. Mult Scler 9:323–331. [DOI] [PubMed] [Google Scholar]
- 3. Breij EC, Brink BP, Veerhuis R, van den Berg C, Vloet R, Yan R et al (2008) Homogeneity of active demyelinating lesions in established multiple sclerosis. Ann Neurol 63:16–25. [DOI] [PubMed] [Google Scholar]
- 4. Chard D, Miller D (2009) Grey matter pathology in clinically early multiple sclerosis: evidence from magnetic resonance imaging. J Neurol Sci 282:5–11. [DOI] [PubMed] [Google Scholar]
- 5. Compston DA, Morgan BP, Campbell AK, Wilkins P, Cole G, Thomas ND, Jasani B (1989) Immunocytochemical localization of terminal complement complex in multiple sclerosis. Neuropathol Appl Neurobiol 15:307–316. [DOI] [PubMed] [Google Scholar]
- 6. Crehan H, Hardy J, Pocock J (2013) Blockage of CR1 prevents activation of rodent microglia. Neurobiol Dis 54:139–149. [DOI] [PubMed] [Google Scholar]
- 7. Fisniku LK, Chard DT, Jackson JS, Anderson VM, Altmann DR, Miszkiel KA et al (2008) Gray matter atrophy is related to long‐term disability in multiple sclerosis. Ann Neurol 64:247–254. [DOI] [PubMed] [Google Scholar]
- 8. Gasque P, Singharo SK, Neal JW, Gotze O, Morgan BP (1997) Expression of the receptor for complement C5a (CD88) is upregulated on reactive astrocytes, microglia and endothelial cells in the inflamed human central nervous system. Am J Pathol 150:31–41. [PMC free article] [PubMed] [Google Scholar]
- 9. Gay D, Esiri M (1991) Blood‐brain barrier damage in acute multiple sclerosis plaques. An immunohistochemistry study. Brain 114:557–572. [DOI] [PubMed] [Google Scholar]
- 10. Goicoechea de Jorge E, Caesar JJ, Malik TH, Patel M, Colledge M, Johnson S et al (2013) Dimerization of complement factor H–related proteins modulates complement activation in vivo. Proc Natl Acad Sci USA 110:4685–4690. [DOI] [PMC free article] [PubMed] [Google Scholar]
- 11. Hakobyan S, Harris CL, Tortajada A, Goicoechea de Jorge E, Garcia–Layana A, Fernandez‐Robredo P et al (2008) Measurement of Factor H variants in plasma using variant specific monoclonal antibodies: application to assessing risk of age related macular degeneration. Invest Ophthalmol Vis Sci 49:1883–1890. [DOI] [PubMed] [Google Scholar]
- 12. Hauser SL, Oksenberg JR (2006) The neurobiology of multiple sclerosis: genes, inflammation and neurodegeneration. Neuron 52:61–76. [DOI] [PubMed] [Google Scholar]
- 13. Heinen SA, Hartmann N, Lauer U, Wiehl H‐M, Dahse S, Schirmer et al (2009) Factor H–related protein 1(CFHR‐1) inhibits complement C5 convertase activity and terminal complex formation. Blood 114:2439–2447. [DOI] [PubMed] [Google Scholar]
- 14. Howell OW et al (2011) Meningeal inflammation is widespread and linked to cortical pathology in multiple sclerosis. Brain 134:2755–2771. [DOI] [PubMed] [Google Scholar]
- 15. Ingram G, Hakobyan S, Hirst C, Harris CL, Pickersgill TP, Cossburn MD et al (2010) Complement regulator factor H as a serum biomarker of multiple sclerosis disease state. Brain 133:1602–1611. [DOI] [PubMed] [Google Scholar]
- 16. Ingram G, Loveless S, Howell OW, Hakobyan S, Dancey B, Harris CL et al (2014) Complement activation in multiple sclerosis plaques: an immunohistochemical analysis. Acta Neuropathol Commun 2:53. [DOI] [PMC free article] [PubMed] [Google Scholar]
- 17. Kuhlmann T, Ludwin S, Prat A, Antel J, Brück W, Lassman H (2017) An updated histological classification system for multiple sclerosis lesions. Acta Neuropathol 133:13–24. [DOI] [PubMed] [Google Scholar]
- 18. Lassman H (2011) Review: the architecture of inflammatory demyelinating lesions: implications for studies on pathogenesis. Neuropathol Appl Neurobiol 37:698–710. [DOI] [PubMed] [Google Scholar]
- 19. Lassman H, Brück W, Luchinetti CF (2007) The immunopathology of multiple sclerosis: an overview. Brain Pathol 17:210–218. [DOI] [PMC free article] [PubMed] [Google Scholar]
- 20. Liszewski MK, Java A, Schramm EC, Atkinson JP (2017) Complement dysregulation and disease: insights from contemporary genetics. Annu Rev Pathol Mech Dis 12:25–52. [DOI] [PMC free article] [PubMed] [Google Scholar]
- 21. Luchinetti CF, Bruck W, Rodriguez M, Lassmann H (1996) Distinct patterns of multiple sclerosis pathology indicates heterogeneity of pathogenesis. Brain Pathol 6:259–274. [DOI] [PMC free article] [PubMed] [Google Scholar]
- 22. Maligozzi R, Howell OW, Reeves R, Roncaroli F, Nicholas R et al (2010) A gradient of neuronal loss and meningeal inflammation in multiple sclerosis. Ann Neurol 68:477–493. [DOI] [PubMed] [Google Scholar]
- 23. Michailidou I, Willems JG, Kooi EJ, van Eden C, Gold SM, Geurts JJ et al (2015) Complement C1q C3‐associated synaptic changes in Multiple sclerosis hippocampus. Ann Neurol 77:1007–1026. [DOI] [PubMed] [Google Scholar]
- 24. Morgan BP, Gasque P (1996) Expression of complement in the brain: role in health and disease. Immunol Today 17:461–466. [DOI] [PubMed] [Google Scholar]
- 25. Noseworthy JH, Lucchinetti C, Rodriguez M, Weinshenker BG (2000) Multiple sclerosis. N Engl J Med 343:938–952. [DOI] [PubMed] [Google Scholar]
- 26. Peterson JW, Bö L, Mörk SJ, Chang A, Trapp BD (2001) Transected neurites, apoptotic neurons, and reduced inflammation in cortical multiple sclerosis lesions. Ann Neurol 50:389–400. [DOI] [PubMed] [Google Scholar]
- 27. Popescu BFGh, Lucchinetti CF (2012) Meningeal and cortical grey matter pathology in multiple sclerosis. BMC Neurol 12:11. [DOI] [PMC free article] [PubMed] [Google Scholar]
- 28. Ramaglia V, Hughes TR, Donev RM, Ruseva MM, Wu X, Huitinga I et al (2012) C3‐dependent mechanism of microglial priming relevant to multiple sclerosis. Proc Natl Acad Sci USA 109:965–970. [DOI] [PMC free article] [PubMed] [Google Scholar]
- 29. Reynolds R, Roncaroli F, Nicholas R, Radotra B, Gveric D, Howell O (2011) The Neuropathological basis of clinical progression in MS. Acta Neuropathol 122:155–170. [DOI] [PubMed] [Google Scholar]
- 30. Rocca MA, Absinta M, Filippi M (2012) The role of magnetic resonance imaging techniques in primary progressive MS. J Neurol 259:611–621. [DOI] [PubMed] [Google Scholar]
- 31. Schmidt CQ, Herbert AP, Mertens HD, Guariento M, Soares DC, Uhrin D et al (2010) The central portion of factor H (modules10–15) is compact and contains structurally deviant CCP module. J Mol Biol 395:105–122. [DOI] [PMC free article] [PubMed] [Google Scholar]
- 32. Singharo SK, Neal JW, Morgan BP, Gasque P (1999) Increased complement biosynthesis by microglia and complement activation on neurons in Huntington's disease. Exp Neurol 159:362–376. [DOI] [PubMed] [Google Scholar]
- 33. Thomas A, Gasque P, Vaudry D, Gonzalez B, Fontaine M (2000) Expression of a complete and functional complement system by human neuronal cells in vitro. Int Immunol 12:1015–1023. [DOI] [PubMed] [Google Scholar]
- 34. Thurman JM, Holers VM (2006) The central role of the alternative complement pathway in human disease. J Immunol 176:1305–1310. [DOI] [PubMed] [Google Scholar]
- 35. Van Horssen J, Brink BP, de Vries HE, van der Valk P, Bo L (2007) The blood‐brain barrier in cortical multiple sclerosis lesions. J Neuropathol Exp Neurol 66:321–328. [DOI] [PubMed] [Google Scholar]
- 36. Wang H, Zhang W, Fuller GN (2002) Tissue microarrays: application in neuropathology research, diagnosis and education. Brain Pathol 12:95–107. [DOI] [PMC free article] [PubMed] [Google Scholar]
- 37. Watkins LM, Neal JW, Loveless S, Michailidou I, Ramaglia V, Rees MI et al (2016) Complement is activated in progressive multiple sclerosis cortical grey matter lesions. J Neuroinflamm 13:161. [DOI] [PMC free article] [PubMed] [Google Scholar]
- 38. Zipfel P, Skerka C (2009) Complement regulators and inhibitory proteins. Nat Rev Immunol 9:729–740. [DOI] [PubMed] [Google Scholar]
Associated Data
This section collects any data citations, data availability statements, or supplementary materials included in this article.
Supplementary Materials
Additional Supporting Information may be found in the online version of this article at the publisher's web‐site:
Figure S1. Control Immunohistochemistry examples; non‐inflammatory control tissue and anti‐fibrinogen and IgG1 isotype controls. Panel A: Tissue sections from non‐inflammatory control cases (CO38, 0040, 0041) showing examples of complement staining in NAWM and NAGM. Panel B: lack of cellular fibrinogen staining in NAWM of TMA case MS2SS. Panel C: fibrinogen positive blood vessel wall surrounded by immuno‐negative neurons of NAGM of TMA case MS234. Panels D and E: fibrinogen staining in human kidney as a positive control. Panel F: IgG control staining. Panel G: no primary antibody negative control.
Figure S2. Control Immunohistochemistry examples. Tissue sections from Herpes simplex encephalitis [HSV (cases B5125‐9 and B5046‐15)] immunostained for C proteins investigated in this study; (A) polyclonal antibody to Clq immunolabels several neurons within GM; (B) C3b + glia (arrows) within the WM of temporal lobe; (C) C3b + degenerating neurons within the temporal cortex; (D) C1INH + neurons; (E) clusterin + immunolabeled axons (arrow) and glia within WM of temporal lobe; (F) clusterin + neurons and occasional glia within GM; (G) C5aR + cells with a microglia/macrophage morphology in a perivascular distribution; (H) Ramified C5aR + glia in WML edge. All images 40× magnification.
Figure S3. Control Immunohistochemistry examples. Sections from paraffin wax embedded formalin fixed Alzheimer's disease cerebral cortex immunostained for C proteins; (A) Clq antibody showing positive immunolabeling of pyramidal neurons (A303/09); (B) C3b immunolabeling neurons and amyloid plaques, and occasional glia (A307/07); (C) C1INH labeled glia (A173/05); (D) polyclonal anti‐FH staining with characteristic granular immunolabeling within the neuronal cytoplasm (A173/05); (E) MBC‐125 (FHR protein) immunolabeling of neuronal cytoplasm (A192/07); (F) Ox‐24 antibody demonstrating a similar pattern of immunolabeling of neurons as seen with the polyclonal anti‐FH anti‐sera (A307/07); (G) MBI‐15 (FH‐specific) antibody immunolabeling of neuronal cytoplasm (A307/05); (H) Anti‐clusterin stained neurons from case A303; (I) CR1 positive neurons from GM of case A307.