

Abstract
The accumulation of abnormal α‐synuclein is the major histopathological feature of Lewy body disease and multiple system atrophy (MSA), which are referred to as synucleinopathies. Cytoplasmic degradation systems, such as the autophagy‐lysosome and proteasome pathways, are involved in their pathogenesis. Autophagy is tightly regulated by several upstream proteins including UNC‐51‐like kinase 1/2, beclin1, vacuolar protein sorting‐associated protein 34 and autophagy/beclin1 regulator 1 (AMBRA1). Recently, we revealed that both cortical and brainstem‐type Lewy bodies were immunopositive for several upstream proteins of autophagy. Therefore, we conducted the present study to elucidate the role of upstream proteins of autophagy in the pathogenesis of MSA. Pathological and biochemical analyses using human brain samples revealed that AMBRA1 is a component of the pathological hallmarks of MSA and upstream proteins of autophagy are impaired in the MSA brain. In vitro and in vivo analyses revealed a ninefold stronger affinity of AMBRA1 with α‐synuclein phosphorylated at serine 129 compared with non‐phosphorylated α‐synuclein. Furthermore, a weak but significant correlation between AMBRA1 overexpression and reduction of abnormal α‐synuclein was observed. Silencing AMBRA1 function caused aggregates of α‐synuclein in the cytoplasm of mouse primary cultured neurons, which was simulated by the treatment of Bafilomycin, an autophagy inhibitor. Our results demonstrated for the first time that AMBRA1 is a novel hub binding protein of α‐synuclein and plays a central role in the pathogenesis of MSA through the degradative dynamics of α‐synuclein. These results raise the possibility that molecular modulation targeting AMBRA1 can be a promising candidate for the treatment of synucleinopathies.
Keywords: AMBRA1, autophagy, α‐synuclein, multiple system atrophy, synucleinopathy
Introduction
Multiple system atrophy (MSA) is an adult‐onset, sporadic, rapidly progressing, fatal neurodegenerative disease that presents with a various combination of cerebellar ataxia, poorly L‐dopa‐responsive parkinsonism and dysautonomia. MSA is now categorized into two clinical groups, depending on the predominant motor presentation: a cerebellar variant related to olivopontocerebellar atrophy (MSA‐C) and a parkinsonian variant reflecting striatonigral degeneration (MSA‐P) 10. The accumulation of misfolded proteins in proteinaceous inclusions is considered to be a common feature of many neurodegenerative disorders. MSA is pathologically characterized by: (i) the widespread occurrence of glial cytoplasmic inclusions (GCIs), to a lesser extent, (ii) neuronal cytoplasmic inclusions (NCIs), (iii) neuronal nuclear inclusions (NNIs) and (iv) glial nuclear inclusions (GNIs) 16, 29, 34, 35, 36. As the severity and distribution of neuronal loss is associated with the density of GCIs, MSA is considered as a primary oligodendrogliopathy 49. GCIs are visualized by silver staining, such as the Gallyas‐Braak method 36, and ultrastructurally consist of granule‐associated filaments 28, 29, 36. The major component of GCIs is α‐synuclein (α‐syn), which is also phosphorylated at residue Ser129 as in the Lewy bodies of Parkinson's disease (PD) and dementia with Lewy bodies (DLB) 13, 48. Thus, MSA, along with PD and DLB, is regarded as a synucleinopathy. In normal brain, α‐syn is localized in the presynaptic nerve terminals 12, 15, at the nuclear envelope 20, within the nucleus 22, 26 and in the cytoplasm of neurons 14, 17, 41. In patients with MSA, the solubility of α‐syn within GCIs alters, resulting in the formation of aberrantly insoluble, phosphorylated, filamentous aggregations of α‐syn and finally neuronal cell death.
Macroautophagy (herein referred to as autophagy) is a highly conserved degradation pathway whereby not only cytosolic components but also aberrant proteins are sequestered within double‐membraned vesicles, known as autophagosomes. Autophagy is divided mainly into three processes: (i) initiation of autophagy, (ii) formation of autophagosomes and (iii) degradation of the proteins after fusion with lysosomes 4. Several studies reported that quantitative and qualitative abnormalities of autophagosomal proteins occur in the affected regions of MSA as well as of Lewy body disease 40, 46, indicating that the relatively late processes (ii and iii in the three processes listed above) of autophagy are disrupted in the brains of these patients. However, significant implications for the initiation of autophagy in MSA remain largely unknown.
Autophagy is tightly regulated by several upstream proteins such as UNC‐51‐like kinase 1 (ULK1), ULK2, beclin1, vacuolar protein sorting‐associated protein 34 (VPS34) and autophagy/beclin1 regulator 1 (AMBRA1). Activation and modification of these proteins initiate autophagy through inhibition of the mammalian target of rapamycin 4. Recently, we performed an extensive study of the alterations of upstream proteins of autophagy (ULK1, ULK2, beclin1, VPS34 and AMBRA1) in Lewy body disease, and demonstrated that both cortical and brainstem‐type Lewy bodies were intensely immunopositive for AMBRA1, whereas only brainstem‐type Lewy bodies were moderately immunostained with antibodies against the other key proteins 24.
In the present study, we focused on the involvement of the upstream proteins of autophagy in the pathogenesis of MSA. On the basis of the results of pathological staining using human brains, we assumed close relationship between AMBRA1 and α‐syn pathology in MSA. Further studies provided new evidence that AMBRA1 was a novel key partner of native as well as phosphorylated (abnormal) α‐syn. Especially, AMBRA1 had a ninefold stronger affinity of AMBRA1 with abnormal α‐syn compared with native α‐syn, and was associated with the degradation of native and abnormal α‐syn. Collectively, our results indicate that the upstream proteins of autophagy, especially AMBRA1, might be highly involved in the pathogenesis of MSA. AMBRA1 could sense abnormally phosphorylated α‐syn and serve as an efficient degradation mechanism for abnormal α‐syn.
Materials and Methods
Antibodies
Rabbit polyclonal antibodies against ULK1 (Thermo Fisher Scientific, Waltham, MA), ULK2 (Thermo Fisher Scientific), VPS34 (Thermo Fisher Scientific), beclin1 (Novus Biologicals, Littleton, CO), AMBRA1 (ProSci‐Incorporated, Poway, CA), AMBRA1 (Cell Signaling Technology, Danvers, MA), AMBRA1 (Proteintech Inc., Chicago, IL), elongin B (Abcam, Cambridge, MA), p62 (MBL, Nagoya, Japan), microtubule‐associated protein light chain 3 (LC3) (Sigma, St. Louis, MO), TNF receptor associated factor 6 (TRAF6) (Sigma) and β‐actin (Sigma), goat polyclonal antibody against Bip (Santa Cruz, Dallas, TX), rabbit monoclonal antibody against phosphorylated α‐syn (p‐α‐syn) (Abcam) and Myc (Cell Signaling Technology), and mouse monoclonal antibodies against α‐syn (Abcam, 4D6; Abcam, syn211), p‐α‐syn (Wako, Osaka, Japan; #64), dynein intermediate chain (Abcam), Flag (Sigma), RGHHHHHH His (RH) (QIAGEN, Hilden, Germany), Myc (Cell Signaling Technology) and HaloTag (Promega, Madison, WI) were utilized as primary antibodies. TRAF6 mediates ULK1 to promote autophagy 31. Elongin B cooperates with AMBRA1 to mediate a positive feedback loop of autophagy with other E3 ligases 1.
Specificity of the primary antibodies
As reported previously 24, the specificity of the primary antibodies (ULK1, ULK2, beclin1, VPS34 and AMBRA1) was examined by western blot analysis. The specificity of other primary antibodies related to autophagy (TRAF6, elongin B) were reported in the literature 1.
Human subjects and immunohistochemistry
Tissue samples were obtained from the Department of Neuropathology, Institute of Brain Science, Hirosaki University Graduate School of Medicine, Hirosaki, and the Department of Pathology, Brain Research Institute, University of Niigata, Niigata, Japan. Twelve autopsy cases were investigated in this study; these included cases of MSA (aged 49–83 years, average 65.8 years, n = 6), and normal controls (aged 53–84 years, average 64.6 years, n = 6). For routine histological investigations, the brain and spinal cord were fixed with 10% buffered formalin for 3–4 weeks.
Four‐micrometer‐thick sections were cut from the upper pons of patients with MSA and control subjects, and immunostained using the avidin‐biotin‐peroxidase complex method with diaminobenzidine as the chromogen. The primary antibodies used were anti‐ULK1 (1:100), anti‐ULK2 (1:500), anti‐beclin1 (1:100), anti‐VPS34 (1:100) and anti‐AMBRA1 antibodies (ProSci‐Incorporated; 1:500). The sections were pretreated in an autoclave for 10 min in 10 mmol citrate buffer (pH 6.0).
Paraffin sections from the pons of MSA patients were processed for double‐label immunofluorescence. Deparaffinized sections were incubated overnight at 4°C with a mixture of monoclonal anti‐p‐α‐syn (#64; 1:500) and polyclonal anti‐AMBRA1 antibodies (ProSci‐Incorporated; 1:50). The sections were then rinsed and incubated with anti‐rabbit IgG tagged with Alexa Fluor 488 (Invitrogen, Carlsbad, CA; 1:1000) or anti‐mouse IgG tagged with Alexa Fluor 594 (Invitrogen; 1:1000) for 2 h at 4°C. The sections were mounted with Vectashield (Vector Laboratories, Inc., Burlingame, CA) and examined with a confocal microscope (EZ‐Ci; Nikon, Tokyo, Japan). Semi‐quantitative analysis was performed to evaluate the proportion of AMBRA1‐positive inclusions relative to the number of p‐α‐syn‐positive inclusions based on 10 randomly chosen low‐power fields.
Cell culture and gene constructs
Green fluorescent protein‐LC3 transgenic mice were purchased from RIKEN BioResource Center (Tsukuba, Japan), and the genotype was confirmed by conventional PCR method 25. Primary control neurons were harvested from Green fluorescent protein‐LC3 transgenic mice at embryonic day 18. Briefly, cerebral cortices were removed, cells were plated (0.75 × 10⁵ cells/cm2) in neurobasal medium containing B27 supplement (Invitrogen), antibiotics and L‐glutamine. Half the volume of culture medium was exchanged every 3 days.
HEK293 cells were purchased from the Japanese Collection of the Research Bioresources Cell Bank (Osaka, Japan), and maintained in Dulbecco's modified Eagle medium supplemented with 10% fetal calf serum and antibiotics.
Human AMBRA1 tagged with Flag was purchased from ViGene Biosciences (CH899054) (Rockville, MD). Deletion mutants of AMBRA1 tagged with Myc (full‐length, FL; amino‐terminal, F1; central terminal, F2; and C‐terminal, F3) and human α‐syn (WT α‐syn) cDNA were prepared as described previously 11, 45. α‐syn cDNA was subcloned into pcDNA3 (Invitrogen) tagged with RH or Flag, and pFN21A with HaloTag (Promega). Mutagenesis was performed according to the manufacturer's instructions (Takara, Otsu, Japan), followed by sequencing to confirm the mutation site. Serine (S) was changed into glutamic acid (E) for a phosphorylation‐mimic mutant (S129E α‐syn).
Western blot analysis and immunocytochemistry of cultured cells and brain lysates
At 12 h after transfection with 0.25 μg of cDNA containing Flag‐tagged AMBRA1, 0.25 μg of HaloTag‐tagged S129E α‐syn was transfected into HEK293 cells and incubated for 24 h. cDNA was transfected into HEK293 cells using X‐tremeGENE 9® (Roche, Basel, Switzerland). The cultured cells were then harvested to assess the expression level of proteins in the total lysates. The cells were lysed with sample buffer (75 mM Tris‐HCl, pH 6.8, 4% sodium dodecyl sulfate, 25% glycerol, 5% β‐mercaptoethanol), and western blot analysis was performed as reported previously 51. Rabbit polyclonal antibodies against AMBRA1 (Cell Signaling Technology; 1:1000), p62 (1:2000), LC3 (1:4000), and β‐actin (1:10 000), goat polyclonal antibody against Bip (1:200) and mouse monoclonal antibodies against HaloTag (1:2000) were utilized as primary antibodies.
At 12 h after transfection with mouse Silencer® Select siRNA AMBRA1 (5′‐GGGUGAUGACGAACCAGAAtt‐3′) (Thermo Fisher Scientific) or control siRNA (Thermo Fisher Scientific), mouse primary cultured neurons were treated with or without Bafilomycin, a specific autophagy inhibitor. siRNA was transfected into the primary cultured neurons using ScreenFectTM siRNA® (Wako). The neurons were then incubated overnight at 4°C with anti‐α‐syn (4D6; 1:1000) antibody. The sections were then rinsed and incubated with anti‐mouse IgG tagged with Alexa Fluor 594 (Invitrogen; 1:1000) for 2 h at 4°C. The sections were mounted with Vectashield (Vector Laboratories) and examined as described above. In order to count aggregates of α‐syn in the cytoplasm, semi‐quantitative analysis was performed based on randomly 10 chosen low‐power fields.
Brain tissues were dissected out at autopsy and frozen rapidly at −70ºC. For the present study, frozen tissues from the cerebellar white matter of patients with MSA (aged 39–82 years, average 69.2 years, n = 5) and age‐matched normal controls (aged 64–76 years, average 70.8 years, n = 5) were employed. Western blot analysis was performed as described above. Anti‐ULK1 (1:1000), anti‐ULK2 (1:1000), anti‐beclin1 (1:1000), anti‐VPS34 (1:1000), anti‐AMBRA1 (1:1000), anti‐TRAF6 (1:1000), anti‐p62 (1:2000), anti‐LC3 (1:4000) and anti‐β‐actin (1:10 000) antibodies were used as primary antibodies.
Immunoprecipitation analysis of cultured cells and human brain samples
HEK293 cells were transfected with a combination of Flag‐tagged AMBRA1 and RH‐tagged WT α‐syn or S129E α‐syn, or a combination of Myc‐tagged AMBRA1 (FL, F1‐3) and RH‐tagged WT α‐syn. Pre‐immunoprecipitated lysate was diluted twofold with immunoprecipitation (IP) buffer and used as the input sample. Lysates were incubated with a mouse anti‐Flag, anti‐Myc or IgG alone binding with Protein G‐coupled magnetic beads for 0.5 h (Invitrogen). Following incubation, the beads were washed three times with Tris‐buffered saline with 0.1% Tween 20, eluted in a loading buffer, applied to SDS‐polyacrylamide gel electrophoresis, and western blot analysis was performed as described previously 51. IP was also performed using a TALON‐based system and following the protocol described previously 45. Anti‐α‐syn (4D6; 1:1000), anti‐Flag (1:1000), anti‐RH (1:1000) and anti‐Myc (1:1000) antibodies were used as primary antibodies.
Frozen brain tissues (middle temporal cortex and cerebellar white matter, 0.05 g) from MSA (aged 69–82 years, average 74.8 years, n = 4) and control subjects (aged 71–79 years, average 73 years, n = 4) were homogenized in IP buffer (20 mM Tris, pH 7.4, 150 mM NaCl, 2 mM MgCl2, 0.5% NP‐40, 10% glycerol with a protease inhibitor cocktail [Complete Mini EDTA‐free; Roche Applied Science]). The protein concentration in the lysates was determined using a BCA assay (Pierce, Rockford, IL). Lysates containing equal amounts of proteins (20 mg) were incubated with the rabbit anti‐AMBRA1 antibody or IgG alone binding with Protein G‐coupled magnetic beads for 0.5 h (Invitrogen). Following incubation, the beads were washed 3 times with Tris‐buffered saline with 0.1% Tween 20, eluted in a loading buffer, applied to SDS‐polyacrylamide gel electrophoresis, and western blot analysis was performed as described previously 51. The primary antibodies used were anti‐AMBRA1 (Cell Signaling Technology; 1:1000), anti‐α‐syn (4D6; 1:1000), anti‐p‐α‐syn (Abcam, 1:2000; Wako, 1:1000), anti‐elongin B (1:1000), anti‐dynein intermediate chain (1:1000) and anti‐LC3 (1:4000).
Proximity ligation assay of cultured cells and human subjects
A proximity ligation assay (PLA) was performed using Duolink kits supplied by Sigma. Anti‐α‐syn (syn211; 1:500) and anti‐AMBRA1 (ProSci‐Incorporated; 1:100) antibodies were utilized as primary antibodies for PLA 7, 38. For pretreatment, the cells were fixed with 4% paraformaldehyde, and permeabilized with 0.1% Triton X‐100 for 10 min. According to the manufacturer's protocol, anti‐α‐syn (syn211; 1:500) and anti‐AMBRA1 (ProSci‐Incorporated; 1:100) antibodies were applied to the samples and they were incubated overnight at 4°C. Then, PLA probes (Minus and Plus) detecting each primary antibody were added to the samples for 1 h at 37°C. PLA probe hybridization and ligation was performed using ligation solution for 30 min at 37°C. Polymerase solution was then added to the samples for 100 min at 37°C. The samples were mounted with Duolink in situ Mounting Medium with DAPI and examined using a confocal microscope as described above.
For PLA of human samples, five autopsy cases were investigated in this study: MSA (n = 1) and normal controls (n = 4). The brains were fixed with 10% buffered formalin for 3–4 weeks. Anti‐p‐α‐syn (#64; 1:2000) and anti‐AMBRA1 (ProSci‐Incorporated; 1:500) were utilized as primary antibodies for PLA. PLA was performed according to the manufacturer's protocol.
Protein purification and surface plasmon resonance analysis
AMBRA1 and α‐syn proteins were harvested from HEK293 cells and lysed with IP buffer and immunoprecipitated by the Flag or HaloTag system (Promega), respectively. Flag peptide was used for AMBRA1 purification. Halo‐α‐syn was digested with TEV protease to detach HaloTag from α‐syn. All proteins were dialyzed into phosphate‐buffered saline. Protein concentration was determined by the BCA assay described above.
Binding of α‐syn to AMBRA1 was analyzed by surface plasmon resonance (SPR) using a Biacore 2000 (GE Healthcare Japan, Tokyo, Japan). Binding reactions cause a change in SPR resonance, which was detected optically and measured in resonance units. AMBRA1 was immobilized on a sensor surface via its primary amine groups. The carboxymethylated dextran surface of the chip (CM5 sensor chip; GE Healthcare Bio‐Sciences AB, Björkgatan, Sweden) was activated with 50 mM N‐hydroxysuccinimide and 200 mM N‐ethyl‐N´‐(dimethylaminopropyl) carbodiimide at 25°C with a flow rate of 10 µL/min. AMBRA1 (70 µL at 0.1 µg/µL) was immobilized at 25°C with a flow rate of 10 µL/min. One surface was used as the negative control and contained no coupled protein. The remaining activated groups were blocked with 1 M ethanolamine (pH 8.5). The binding assays were performed at 25°C by using WT α‐syn or S129E α‐syn as analytes at different concentrations ranging from 20 to 100 nM in 10 mM HEPES (pH 7.4) containing 150 mM NaCl, 3.4 mM EDTA and 0.005% (v/v) surfactant P20, and applied at 20 µL/min. Association was monitored for 120 s followed by a dissociation phase. All binding assays were performed in duplicate, and the standard deviation was within 10%. BIA evaluation software (version 4.1.1) was used to calculate the different equilibrium dissociation constants (K D) using a 1:1 binding model 9.
Statistical analysis
Statistical analyses were performed using a two‐sample t test. Differences were considered statistically significant at P <0.05.
Ethics
All studies and procedures were carried out with the approval of the Committee of Medical Ethics of Hirosaki University Graduate School of Medicine, Hirosaki, Japan.
Results
AMBRA1 is incorporated in GCIs, NCIs and threads in MSA
First, to examine whether upstream proteins of autophagy are involved in inclusion formation in MSA, brain specimen from patients with MSA and normal controls were examined immunohistochemically. In normal controls, the neuronal cytoplasm was weakly positive for ULK1, ULK2, VPS34 and AMBRA1, as reported previously 24. The cytoplasm of oligodendroglia was weakly positive for AMBRA1, but not for the other proteins (Supporting Information Fig. 1). In the brains of patients with MSA, anti‐p‐α‐syn and anti‐AMBRA1 antibodies intensely stained GCIs, NCIs and threads (Figure 1A–F). NNIs and GNIs were not positive for AMBRA1. Although GCIs, GNIs and NNIs were negative for ULK1, NCIs were unstained or barely stained with anti‐ULK1 antibody (Supporting Information Fig. 2A–D). No GCIs, NCIs, GNIs or NNIs were positive for ULK2, VPS34 or beclin1.
Figure 1.
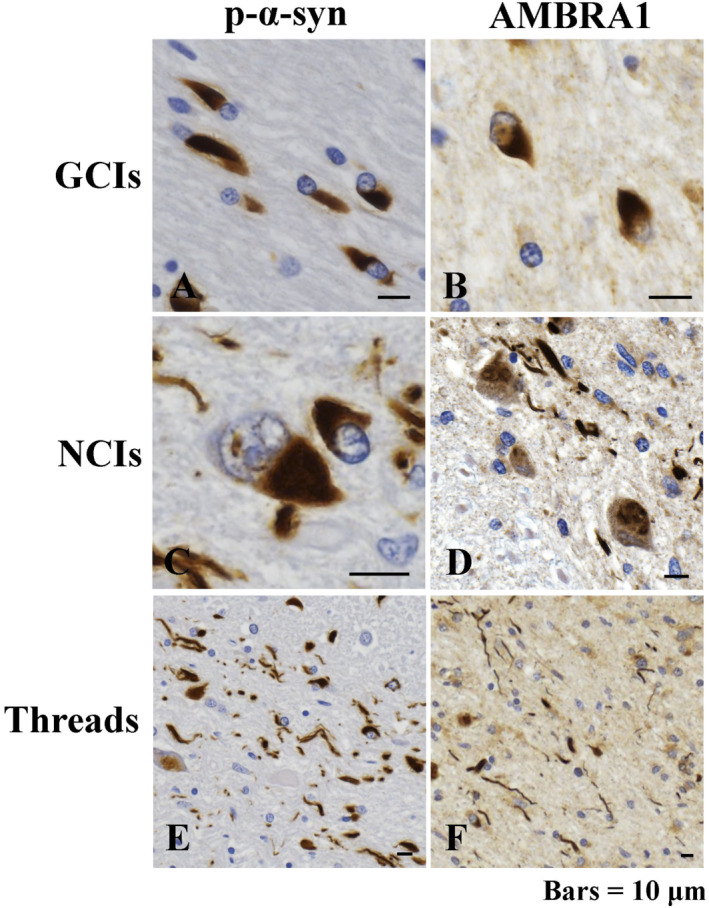
Immunoreactivity of phosphorylated α‐synuclein (p‐α‐syn) and AMBRA1 in the brains of patients with multiple system atrophy (MSA). Immunoreactivity for p‐α‐syn (A, C, E) and AMBRA1 (B, D, F) in glial cytoplasmic inclusions (GCIs) (A, B), neuronal cytoplasmic inclusions (NCIs) (C, D) and threads (E, F). Bars = 10 μm.
Double immunofluorescence analysis revealed co‐localization of AMBRA1 and p‐α‐syn in GCIs, NCIs and threads (Figure 2A–I). The average proportion of AMBRA1‐positive inclusions relative to the number of p‐α‐syn‐positive inclusions was 29.1% in GCIs and 28.3% in NCIs.
Figure 2.
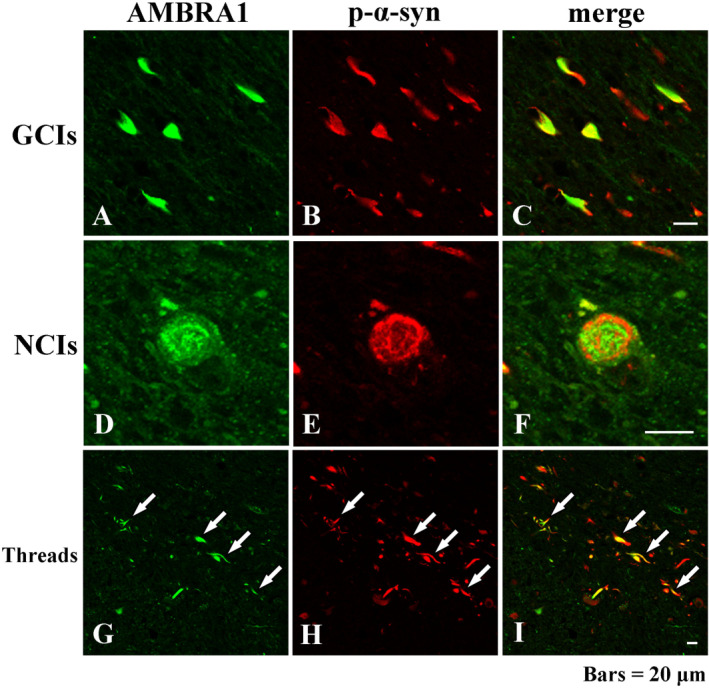
Double‐labeling immunofluorescence demonstrating co‐localization of AMBRA1 and p‐α‐syn in GCIs (A–C), NCIs (D–F) and threads (white arrows) (G–I). AMBRA1 appears green, and p‐α‐syn appears red. Bars = 20 μm.
In the advanced stage of MSA, significant alteration of upstream proteins of autophagy is observed
Next, we performed western blot analysis using total brain lysate of cerebellar white matter of normal controls (n = 5) and MSA (n = 5). The raw data are shown in Figure 3A. In the brains of patients with MSA, there was a significant increase in the expression of ULK1 (Figure 3B), ULK2 (Figure 3C) and AMBRA1 (Figure 3D). On the other hand, TRAF6, which promotes autophagy through mediation with ULK1, was significantly decreased in patients with MSA (Figure 3E) There was no difference in the levels of beclin1, VPS34, p62 and LC3‐II, the autophagosome‐bound form, relative to LC3‐I between normal controls and MSA patients (Figure 3F–I).
Figure 3.
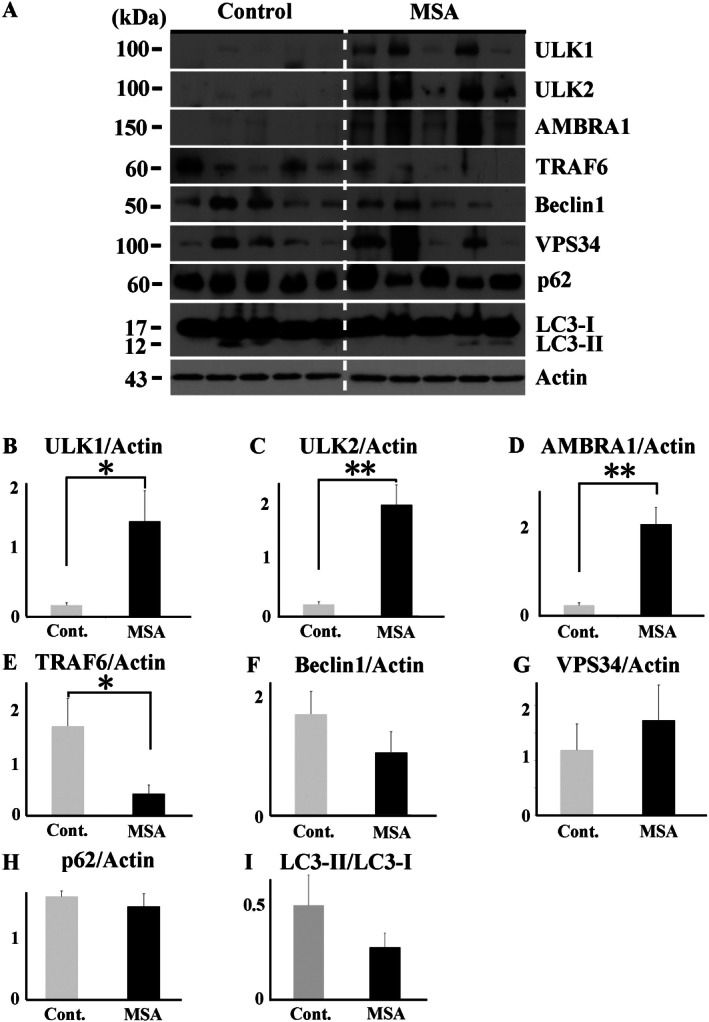
Western blot analysis of total brain lysates from MSA patients and normal controls. Raw data for the levels of ULK1, ULK2, AMBRA1, TRAF6, beclin1, VPS34, p62, LC3 and actin in the cerebellar white matter of patients with MSA (n = 5) and normal controls (n = 5) (A). In patient with MSA, there were significantly increased expression levels of ULK1 (B), ULK2 (C) and AMBRA1 (D). On the other hand, TFAF6 was significantly decreased in patients with MSA (E). No significant difference in the levels of beclin1 (F), VPS34 (G), p62 (H) and LC3‐II relative to LC3‐I (I) between MSA patients and normal controls. *P < 0.05; **P < 0.01.
AMBRA1 interacts with WT α‐synuclein in mammalian cells
On the basis of the results that immunoreactivity of AMBRA1 was present in GCIs and NCIs in MSA as well as Lewy bodies in Lewy body disease 24, we speculated that there was a specific association between AMBRA1 and the pathogenesis of MSA, especially α‐syn. Thus, we investigated whether AMBRA1 and WT α‐syn form a complex, and, if so, to map the AMBRA1 region responsible for binding to α‐syn. For this purpose, we utilized the full‐length (FL), amino‐terminal (F1), central terminal (F2) and C‐terminal (F3) forms of AMBRA1 11 (Figure 4A). All of the forms were tagged with Myc. We co‐transfected HEK293 cells with each form of AMBRA1 and RH‐tagged WT α‐syn. As shown in Figure 4B, we performed TALON purification of protein extracts (input), in which cobalt strongly attracts RH‐tagged proteins. Purified RH‐tagged WT α‐syn was then examined by western blotting using an anti‐RH and anti‐Myc antibodies, demonstrating WT α‐syn bound to the C‐terminal (F3) region of AMBRA1 (Figure 4B). Reciprocal IP was also carried out using an anti‐Myc antibody and 4D6 antibody, and purified AMBRA1 was analyzed by western blotting, confirming the association of F3 AMBRA1 and WT α‐syn (data not shown). To visualize the interaction of these proteins further, we performed PLA, by which protein binding is visualized as red signals. In the absence of the primary antibodies, no signals were seen (Figure 4C), whereas, with antibodies against WT α‐syn and AMBRA1, red signals were found in the cytoplasm (Figure 4D; arrowheads). To confirm the significance of these signals further, WT α‐syn and AMBRA1 were co‐transfected into cells, revealing increased signal intensity (Figure 4E; arrows). Thus, AMBRA1 binds to WT α‐syn at the AMBRA1 C‐terminal.
Figure 4.
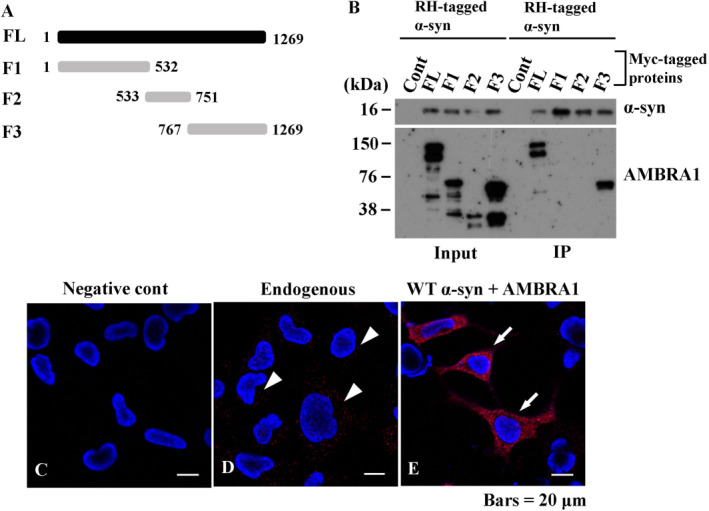
Interaction of AMBRA1 with wild type (WT) α‐syn in mammalian cells. (A) Myc‐tagged AMBRA1 constructs are illustrated. FL, full length; F1–3, fragments 1–3. (B) Characterization of the site of AMBRA1 responsible for α‐syn binding. HEK293 cells were co‐transfected with Myc‐tagged AMBRA1 and RH‐tagged WT α‐syn. Protein extracts (input) were subjected to TALON purification under native conditions, in which cobalt attracts RH‐tagged protein. Purified WT α‐syn bound to the F3 portion of AMBRA1. (C–E) Proximity ligation assay (PLA) in mammalian cells. (C) No signals are recognized in the absence of the primary antibodies. (D) With the use of anti‐α‐syn (syn211) and AMBRA1 antibodies as primary antibodies for PLA, binding of endogenous α‐syn and AMBRA1 are visualized as red signals (white arrowheads). (E) Co‐transfection of WT α‐syn and AMBRA1 showed intense signals (white arrows). Bars = 20 μm.
AMBRA1 has a ninefold stronger affinity toward S129E α‐syn than to WT α‐syn
The major component of GCIs is α‐syn, which is also phosphorylated at residue Ser129, as in the Lewy bodies of PD and DLB 13, 48. Therefore, we examined the relationship between AMBRA1 and α‐syn with or without phosphorylation. Consistent with the previous result of IP (Figure 4B), western blot analysis showed AMBRA1 bound with WT α‐syn. Conversely, S129E α‐syn generated a high molecular smear band in the IP samples (right lower panel in Figure 5A). Neither a band for AMBRA1 nor WT α‐syn was detected by IgG binding with Protein G‐coupled magnetic beads alone (Supporting Information Fig. 3). Next, kinetic analysis of the binding of WT and S129E α‐syn to immobilized AMBRA1 was carried out. Sensorgrams showed stronger binding to S129E α‐syn at a lower K D value of 41.0 nM compared to WT α‐syn (K D = 355 nM) (Figure 5B,C). The association rate (k a) was 9.65 × 10³ M−1 s−1, which was higher than that of WT α‐syn (k a = 7.22 × 10² M−1 s−1). WT α‐syn and S129E α‐syn demonstrated similar dissociation rates (k d) of 2.56 × 10⁻⁴ s−1 and 3.96 × 10⁻⁴ s−1, respectively. The K D value of WT α‐syn was ninefold larger than that of S129E α‐syn. These results together suggest that the faster association of AMBRA1 to S129E α‐syn contributes to its stronger binding to the phosphorylated form than to WT α‐syn.
Figure 5.
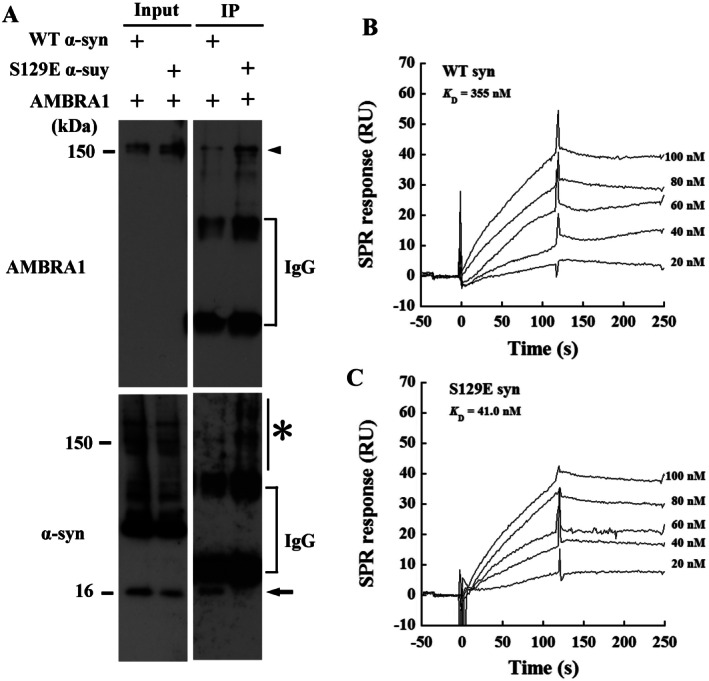
Interaction and affinity of AMBRA1 with phospho‐mimic S129E α‐syn in mammalian cells. HEK293 cells were co‐transfected with a combination of Flag‐tagged AMBRA1 and WT α‐syn, or phospho‐mimic S129E α‐syn. Inputs were subjected to immunoprecipitation (IP) using an anti‐Flag antibody. (A) Purified complexes were then analyzed by immunoblotting with an anti‐Flag antibody, showing bands of 150 kDa corresponding to the molecular weight of AMBRA1 in AMBRA1‐transfected cells (arrowhead, top). In cells transfected with AMBRA1 and WT α‐syn, an anti‐α‐syn (RH and 4D6) antibodies detected a band of 16 kDa in input and IP (arrow). A high molecular weight smear appeared in cells transfected with AMBRA1 and S129E α‐syn (asterisk, bottom). (B, C) Sensorgrams of the binding of WT α‐syn and S129E mutant to immobilized AMBRA1. Various concentrations of WT α‐syn and S129E mutant were injected onto the AMBRA1‐immobilized sensor chip. RU, resonance units.
AMBRA1 interacts with non‐phosphorylated and phosphorylated α‐syn in the human brains
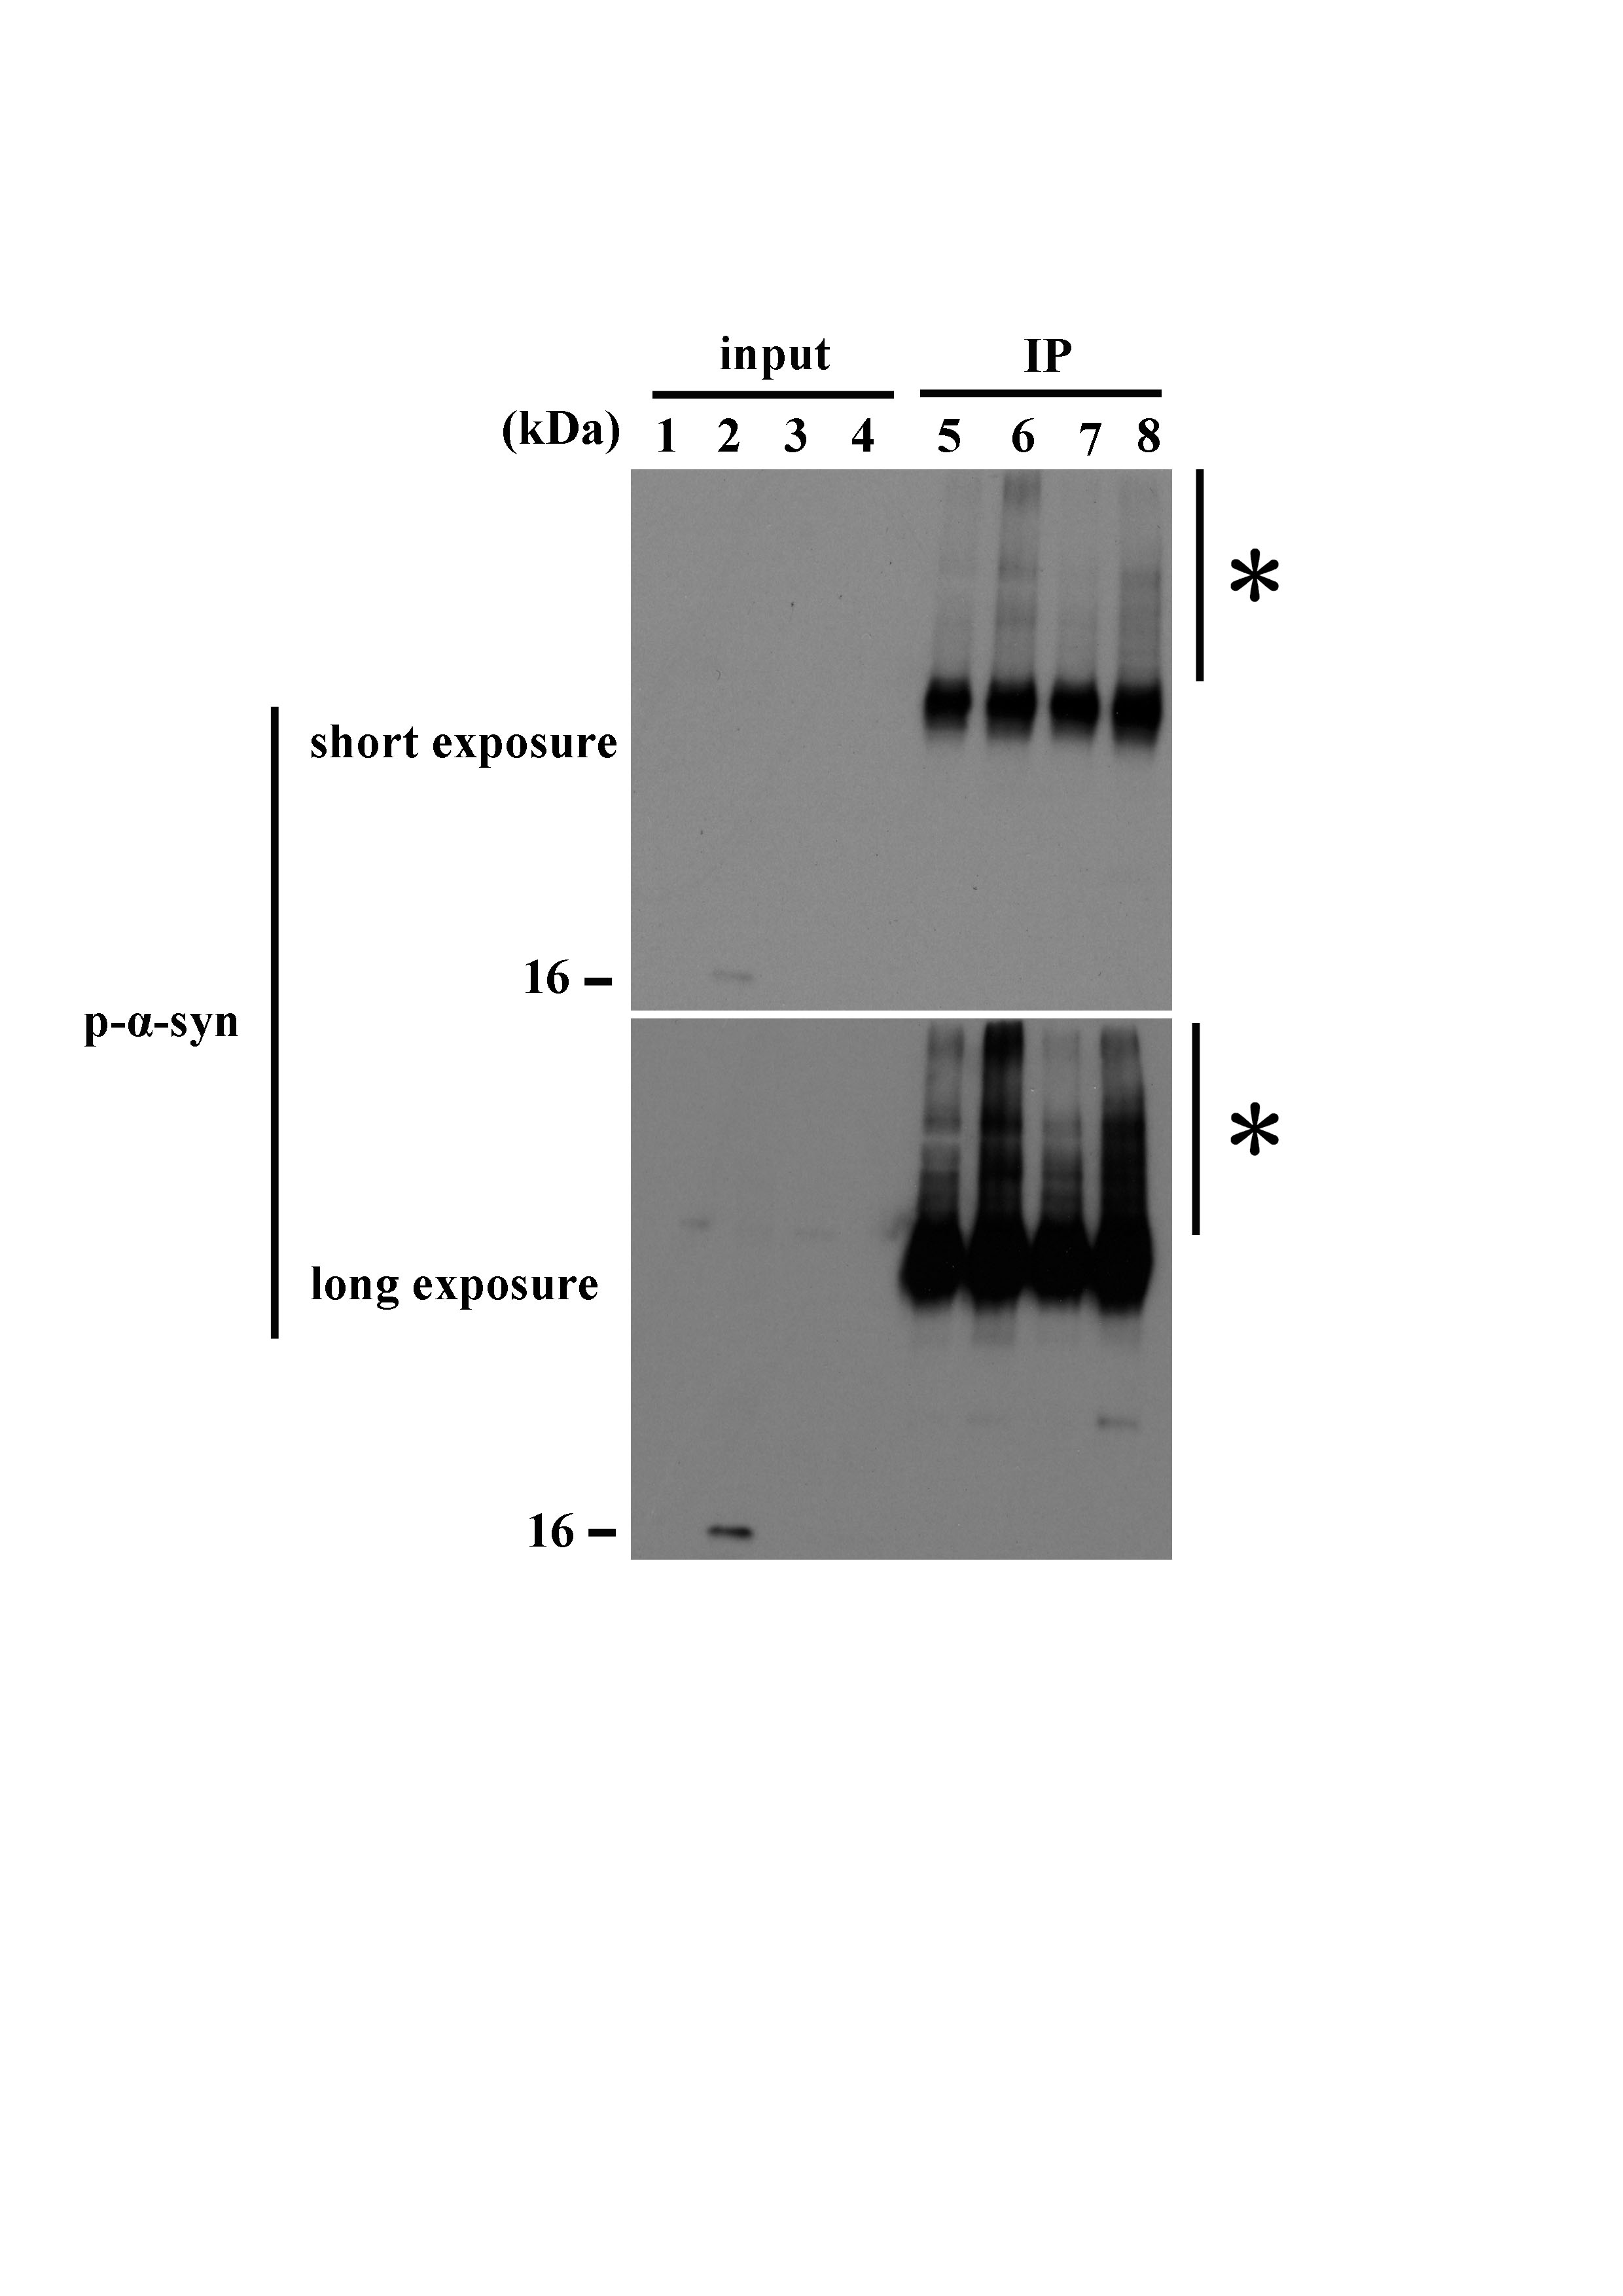
To elucidate the protein‐protein interactions of AMBRA1 in the brains of patients with MSA, we immunoprecipitated AMBRA1 using an anti‐AMBRA1 antibody. Representative cases of each brain region are shown in Figure 6. Cerebral cortex (normal controls, lanes 1 and 5; MSA patients, lanes 2 and 6), and cerebellar white matter (normal controls, lanes 3 and 7; MSA patients, lanes 4 and 8). First, a molecular mass of 150 kDa corresponding to AMBRA1 was more evident in the cerebral cortex (lanes 2 and 6) or cerebellar white matter (lanes 4 and 8) of MSA patients (Figure 6A). Next, we observed that AMBRA1 was associated with native α‐syn in the brains of both normal controls and MSA patients (Figure 6B). In an IP sample of the cerebral cortex of a MSA patient, an anti‐p‐α‐syn antibody detected a band with a molecular mass of 52 kDa corresponding to a band detected by an anti‐AMBRA1 antibody (Figure 6A,C; arrow). In the cerebral cortex of the representative MSA patient, and the cerebral cortex and cerebellar white matter of the other MSA patients, the appearance of a high molecular smear of phosphorylated α‐syn was clearly observed (Supporting Information Fig. 4). As AMBRA1 is already reported to bind to several AMBRA1‐interacting proteins including elongin B, LC3 and dynein intermediate chain 1, 3, 21, these proteins were also examined. The expression level of elongin B was increased in the input of MSA. Accordingly, AMBRA1 formed a complex with elongin B in IP. AMBRA1 also formed a complex with dynein intermediate chain and LC3‐I, the cytosolic form (data not shown). Finally, to validate the association of AMBRA1 with phosphorylated α‐syn further, PLA was performed in the brains of MSA patients. In the absence of primary antibodies, no signals were detected (Figure 6D), whereas, in the presence of primary antibodies for AMBRA1 and phosphorylated α‐syn, binding of AMBRA1 and phosphorylated α‐syn was demonstrated in GCIs (Figure 6E) and NCIs (Figure 6F).
Figure 6.
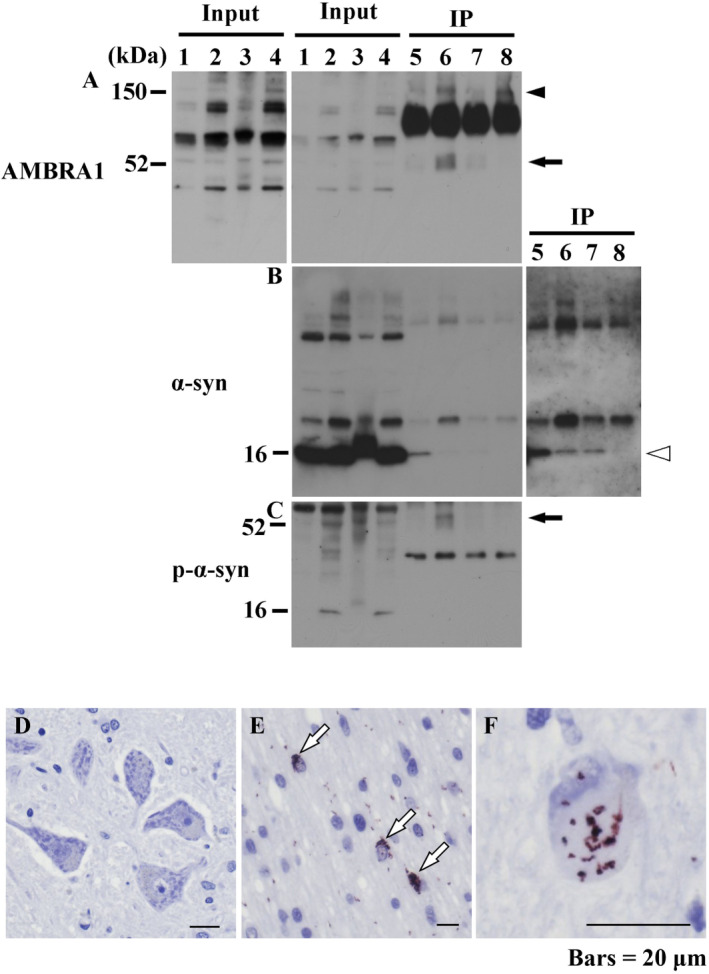
Protein‐protein interactions of AMBRA1 in the brains of MSA patients. Protein extracts from the cerebral cortex of normal controls and MSA patients, and cerebellar white matter of normal controls and MSA patients were immunoprecipitated using an anti‐AMBRA1 antibody. Representative cases of each brain region are shown in this figure. (A) An anti‐AMBRA1 antibody was utilized for western blot analysis of purified proteins, showing a more intense band of AMBRA1 in the cerebral cortex (lanes 2 and 6) and cerebellar white matter of MSA patients (lanes 4 and 8) than normal controls (the cerebral cortex, lanes 1 and 5; the cerebral cortex, lanes 3 and 7). A band with molecular mass of 52 kDa was observed in the cerebral cortex of MSA (arrow). (B) An anti‐α‐syn antibody (4D6) detected intense bands with a molecular weight of 16 kDa corresponding to native α‐syn in comparison with the same region between MSA patients and normal controls (white arrowhead) (right box; long time exposure). (C) For western blot analysis of immunoprecipitated proteins, a rabbit anti‐p‐α‐syn antibody was utilized. In inputs of MSA, a rabbit anti‐p‐α‐syn antibody detected a 16 kDa band. In an IP sample of the cerebral cortex of MSA, a rabbit anti‐p‐α‐syn antibody detected a band of 52 kDa, corresponding to the band detected by the anti‐AMBRA1 antibody (arrow). (D–F) PLA in the brain of MSA patients. (D) No signals were observed in the absence of primary antibodies for AMBRA1 and p‐α‐syn. Signals in GCIs (white arrows) (E) and NCIs (F). Bars = 20 μm.
AMBRA1 is associated with the effective degradation of abnormal α‐syn
To observe the role of AMBRA1 in the degradation of abnormal α‐syn, we overexpressed AMBRA1 in HEK293 cells with a burden of S129E α‐syn. First, as it is known that excessive α‐syn load halts autophagy 43, 50, 0.25 μg of S129E α‐syn plasmid was chosen as the optimal dose for gene delivery. Next, to determine the ideal dose for AMBRA1 transfection, we transfected various amount of AMBRA1 plasmid. Transfection of more than 0.5 μg of AMBRA1 plasmid increased Bip expression, an endoplasmic reticulum stress marker (Figure 7A). To avoid cellular stress, we chose the optimal dose of 0.25 μg AMBRA1 in HEK293 cells. In HEK293 cells co‐transfected with AMBRA1 and S129E α‐syn, the increased expression of AMBRA1 reduced the levels of p62, a substrate of autophagy, and S129E α‐syn along with decrease of LC3‐II/LC3‐I ratio, compared with empty vector‐transfected cells (Figure 7B–D). Although overexpression of AMBRA1 significantly activated autophagy and reduced abnormal α‐syn, activation of single molecule related to autophagy was considered to produce a limited effect on degradation of α‐syn.
Figure 7.
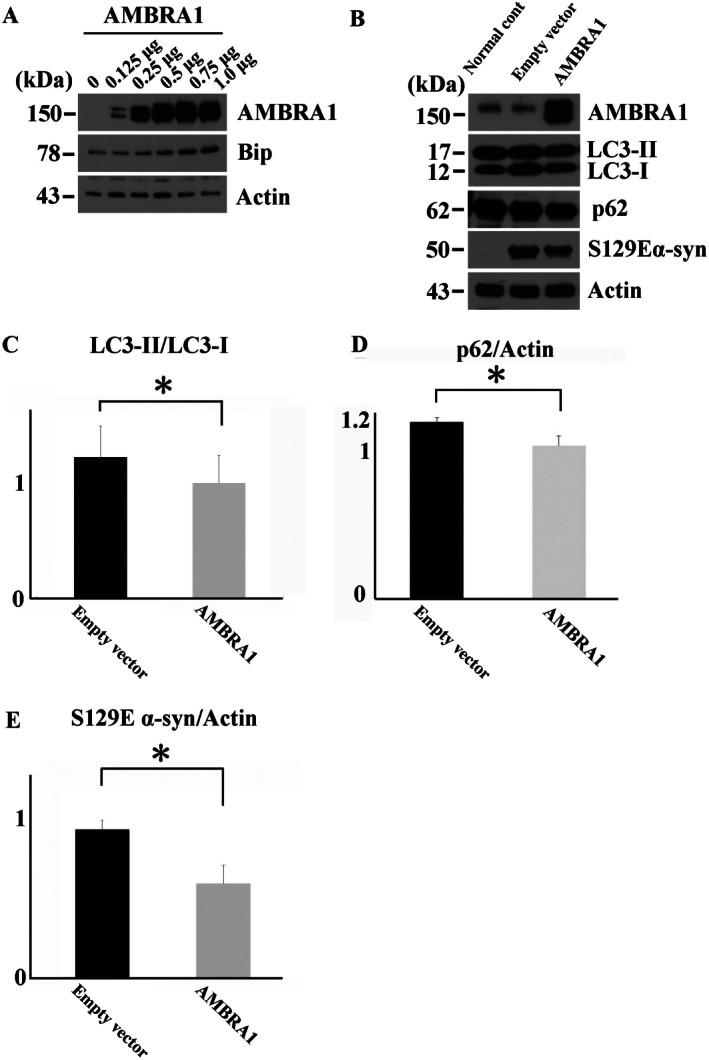
Overexpression of AMBRA1 in the degradation of S129E α‐syn in mammalian cells. (A) Increased expression of Bip, an endoplasmic reticulum stress marker, after transfection with more than 0.5 μg AMBRA1. (B) Expression levels of AMBRA1, p62, LC3, S129E α‐syn and actin in cells treated with 0.25 μg S129E α‐syn with HaloTag and 0.25 μg AMBRA1 or its empty vector. Significant decrease in the LC3‐II/LC3‐I ratio (C) and p62 in AMBRA1 overexpressing cells (D) along with a reduction of S129E α‐syn (E). The molecular weight of S129E α‐syn with HaloTag is 50 kDa. Values are expressed as means and standard deviation of independent three experiments. *P < 0.05.
Thus, to further articulate the role of AMBRA1 in the accumulation of α‐syn, we silenced the function of AMBRA1 in mouse primary cultured neurons and investigated the expression of α‐syn using fluorescent immunostaining. We confirmed that AMBRA1 siRNA silenced an expression band of AMBRA1 (Figure 8A). Silencing AMBRA1 function significantly increased the number of dot‐like structures of α‐syn in the cytoplasm (Figure 8B–F). The treatment of Bafilomycin, an inhibitor of the late phase of autophagy, also caused similar dot‐like structures in the cytoplasm and some of the structures were co‐localized with autophagosomes (Supporting Information Fig. 5A‐D). These findings indicate that AMBRA1 might be associated with degradation of α‐syn, especially the turnover of normal α‐syn.
Figure 8.
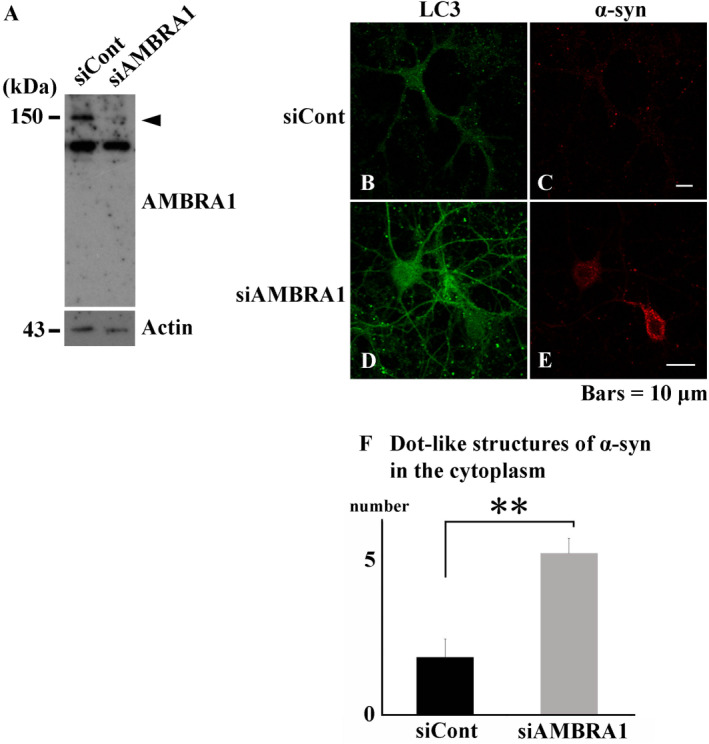
Silencing AMBRA1 function in mouse primary cultured neurons. (A) Decreased expression level of AMBRA1 by AMBRA1 siRNA (arrowhead). (B–E) Immunofluorescence analysis demonstrating transfection of AMBRA1 siRNA caused dot‐like structures of α‐syn in the cytoplasm, compared with that of control siRNA. (F) Semi‐quantitative analysis showing significantly increased number of dot‐like structures of α‐syn in the cytoplasm. LC3 appears green, and α‐syn appears red. Bars = 10 μm. **P < 0.01.
Discussion
The significant findings of the present study are that (i) in PLA and IP analysis, AMBRA1 made a complex with non‐phosphorylated as well as phosphorylated α‐syn, (ii) in SPR analysis, AMBRA1 interacted nine times more strongly with the abnormal form of α‐syn than with WT α‐syn, (iii) in western blot analysis and immunocytochemistry of cultured cells, AMBRA1 was associated with the efficient degradation of α‐syn, (iv) in immunohistochemistry of human brain specimen, AMBRA1 was incorporated into the pathological hallmarks of MSA and (v) in western blot analysis of human brain lysate, impairment of upstream autophagy could occur in the advanced stage of MSA. As for the pathogenesis of MSA, accumulation of misfolded α‐syn in oligodendroglia is one of the major features, and triggers dysfunction of myelin formation 8, 42. Furthermore, the autophagy‐lysosome system or proteasome system in the clearance of abnormal proteins is associated with protein aggregate formation in oligodendroglia of MSA 40. Indeed, ubiquitin, p62, NBR1, HDAC6, GATE‐16, NEDD8 and LC3, which are related to the protein clearance mechanism, are detected within GCIs of MSA 23, 27, 33, 46, 47. The involvement of these proteins suggests that cells attempt to combat the accumulation of abnormal proteins. However, none of these proteins form a stable complex with native α‐syn under normal conditions, suggesting that the incorporation of these proteins into GCls might simply reflect a secondary response for protection against cellular toxicity. Conversely, our results have shown that AMBRA1 was a stable protein partner of α‐syn. In SPR analysis, AMBRA1 interacted with phosphorylated α‐syn with a ninefold stronger affinity compared to WT α‐syn. In addition, in mouse primary cultured neurons of the present study, silencing AMBRA1 clearly increased dot‐like structures of endogenous α‐syn, which was simulated by the treatment of Bafilomycin, an inhibitor of fusion between autophagosomes and lysosomes. Some of unresolved autophagosomes were co‐localized with normal α‐syn. These findings indicate that native α‐syn can be degraded through the mediation of AMBRA1. Although activation of a single molecule related with autophagy had a limited effect on degradation of abnormal protein, a weak but significant correlation between overexpression of AMBRA1 and reduction of abnormal α‐syn was also observed. Thus, AMBRA1 might be implicated in both turnover of native α‐syn and degradation of abnormal α‐syn through autophagy. We previously reported that AMBRA1 was incorporated into Lewy bodies 24. In addition, the present study clearly showed AMBRA1 immunoreactivity in GCIs, NCIs and threads of MSA. Taken together, our results strongly indicate that AMBRA1 might play a role in the pathogenesis of synucleinopathies including MSA and can be a bona fide hub protein for the clearance of abnormal α‐syn. Deposition of abnormal α‐syn occurs at the relatively late stage of GCI formation 49. In the present study, not all α‐syn‐positive inclusions were immunostained with anti‐AMBRA1 antibody. In patients with MSA, the proportion of AMBRA1‐positive inclusions relative to the number of p‐α‐syn‐positive inclusions was 29.1% in GCIs and 28.3% NCIs. An overload of abnormal α‐syn is known to halt autophagy 43, 50. Excess α‐syn might prevent autophagy from the proper degradation of abnormal α‐syn, resulting in passing a point of no return, in which the impaired autophagy‐lysosome pathway is no longer able to recover a fatal cellular state. Accumulation of AMBRA1 might occur as a result of exceeding the cellular capacity to degrade abnormal α‐syn.
Malfunction of autophagy is now a common feature of neurodegenerative disorders including Lewy body disease (PD and DLB), Alzheimer's disease and amyotrophic lateral sclerosis 2, 24, 32, 39, 44. In the present study, ULK1, ULK2 and AMBRA1 in MSA were significantly increased, while TRAF6, an autophagy promotor through the mediation of ULK1, was significantly decreased. Furthermore, the levels of AMBRA1‐related proteins such as beclin1 or VPS34 were unchanged between normal controls and MSA patients, suggesting impairment of autophagosome initiation can happen in MSA. Tanji et al reported that in the cerebellar white matter of MSA patients, which chiefly contains oligodendroglia, the expression level of GATE‐16 was significantly reduced, whereas that of LC3‐II was barely observed and statistically insignificant between normal control and MSA. Although the cerebellum contains neurons as well as oligodendroglia, matured and lipidated LC3 was detected in a detergent‐insoluble fractionation of MSA. These findings implied that maturation of autophagosomes might be also hampered in the advanced stage of MSA 46. Together with these findings, in the advanced stage of MSA, malfunction of autophagy might occur in various stages of autophagy. The present study also indicated that the impairment pattern of upstream autophagy can be different among synucleinopathies. In the advanced stage of PD and DLB, only beclin1 or VPS34 is significantly increased 24. Although Lewy body disease and MSA are categorized as synucleinopathies, the underlying pathogenesis can differ among synucleinopathies.
AMBRA1 has structurally and functionally unique features. Among the upstream proteins of autophagy, AMBRA1 is a newly identified protein comprising 1300 amino acid residues and possesses large intrinsically disordered regions, which enable AMBRA1 to interact with various proteins 3. In fact, under normal conditions, AMBRA1 along with beclin1 is tethered to dynein light chains. On the induction of autophagy, ULK1 phosphorylates AMBRA1 and AMBRA1 then detaches from dynein light chains to the endoplasmic reticulum, initiating the elongation of autophagosomes 6. AMBRA1 functions as a co‐factor of other E3 ligases such as cullin 5 to form a positive feedback loop of autophagy through mediation with elongin B 1. In the present study, AMBRA1 formed a complex with native α‐syn at the C terminal of AMBRA1. It also bound to elongin B, LC3‐I (the cytosolic form) and dynein motor chain. Interestingly, a common interactor of LC3 and dynein motor chain is p‐α‐syn and both of them bind to the C terminal of AMBRA1 3, 21. We also demonstrated that AMBRA1 might have a role in both turnover of normal α‐syn and degradation of abnormal α‐syn. Thus, the C terminal of AMBRA1 might be an active center for protein degradation, especially of α‐syn.
It is worthy of mention that the binding partner of AMBRA1 can be altered in the disease condition. Indeed, the present in vitro study showed that AMBRA1 bound more strongly to S129E α‐syn than to WT α‐syn. In an IP study of the brains of MSA patients, the protein levels of native α‐syn binding to AMBRA1 seemed to be decreased in MSA patients compared with the cerebral cortex or cerebellar white matter of normal controls. Thus, AMBRA1 might detach from native α‐syn and recruit phosphorylated α‐syn. In this point, AMBRA1 might also have another aspect of a reconnaissance protein for α‐syn dynamics. In patients with MSA, disease progression and the severity of symptom are considerably different even in the same clinical entity. Recently, Nardacchi et al reported that in patients with HIV‐1, high baseline autophagic activity limited disease progress, suggesting that the baseline activity of autophagy might be an influencing factor of disease progression, even in neurodegenerative diseases 30. Monitoring the molecular binding pattern of AMBRA1 with α‐syn might lead to the establishment of a new biomarker to evaluate individual vulnerability to the accumulation of abnormal α‐syn.
How abnormal α‐syn propagates is a matter of debate. In fact, abnormal α‐syn spreads from neuron to neuron, neuron to astrocyte and neuron to oligodendroglia 5, 18, 37. Indeed, an overload of abnormal α‐syn caused by the dysfunction of autophagy in neurons could trigger the excretion of abnormal α‐syn, resulting in its propagation 19. Schwarz et al. demonstrated that in cultured oligodendroglia of rat brain, inhibition of proteasomal activity caused the compensatory recruitment of LC3 and p62 to protein aggregates 40. Under normal conditions, AMBRA1 immunoreactivity was found in both neurons and oligodendroglia. At this point, we have not identified which specific cellular compartment of AMBRA1 is related to the clearance of abnormal α‐syn. In the present study, the impairment of upstream autophagy was observed in the cerebellar white matter of MSA patients, which chiefly contains oligodendroglia. However, our results also showed AMBRA1 immunoreactivity was present not only in GCIs but also in NCIs and threads. These findings suggest that both neuronal and oligodendroglial AMBRA1 might be associated with the abnormal accumulation of α‐syn. Further study is necessary to decipher the complicated mechanism of MSA.
The accumulation of abnormal α‐syn can halt the proper function of autophagy. AMBRA1 is a novel α‐syn‐binding protein and is implicated in the pathogenesis of MSA through autophagy. AMBRA1 can have strong potentialities of being both a powerful surveillance protein and an effective degradation protein for abnormal α‐syn.
Disclosure
All authors have no conflicts of interests to disclose.
Supporting information
Additional Supporting Information may be found in the online version of this article at the publisher's web‐site:
Figure 1. Weak immunoreactivity for AMBRA1 in oligodendroglia of normal control (arrowheads).
Figure 2. Immunohistochemistry and double immunofluorescence staining of ULK1 in NCIs. (A) Weak immunoreactivity for ULK1 in NCIs. (B‐D) Co‐localization of ULK1 and p‐α‐syn in NCIs (white arrowheads). ULK1 appears green and p‐α‐syn appears red. Bars = 20 μm
Figure 3. Immunoprecipitation of cultured cells using IgG binding with Protein G‐coupled magnetic beads only. No bands for AMBRA1 or WT α‐syn were detected by IgG binding with Protein G‐coupled magnetic beads.
Figure 4. Immunoprecipitation in the brains of MSA patients. Protein extracts from the cerebral cortex of MSA patients and normal controls, and cerebellar white matter of MSA patients and normal controls were immunoprecipitated using an anti‐AMBRA1 antibody. In IP samples of the cerebral cortex and cerebellar white matter of MSA patients, a rabbit anti‐p‐α‐syn antibody more clearly detected a high molecular smear band compared with normal controls.
Figure 5. Immunofluorescence analysis of α‐syn after treatment with Bafilomycin. (A‐F) Occurrence of LC3‐positive autophagosomes and α‐syn‐positive aggregates after treatment with Bafilomycin. Co‐localization of some autophagosomes with α‐syn‐positive aggregates (white arrowheads). LC3 appears green, and α‐syn appears red. Bars = 10 μm
Acknowledgments
This work was supported by JSPS KAKENHI Grant Numbers 16K19503 (to Y.M.), 26430050 (to K.T.), 26430049 (to F.M.) and 16K15473 (to K.W.), The Karoji Memorial Foundation for Medical Research (to Y.M.), a Grant for Hirosaki University Institutional Research (to K.T., K.W.), the Collaborative Research Project (2810) of the Brain Research Institute, Niigata University (to K.T.), the Research Committee for Ataxic Disease (to H.S., K.W.) from the Ministry of Health, Labour and Welfare, Japan and PRIN2015 20152CB22L (to G.M.F.).
Reference
- 1. Antonioli M, Albiero F, Nazio F, Vescovo T, Perdomo AB, Corazzari M et al (2014) AMBRA1 interplay with cullin E3 ubiquitin ligases regulates autophagy dynamics. Dev Cell 31:734–746. [DOI] [PubMed] [Google Scholar]
- 2. Choi AM, Ryter SW, Levine B (2013) Autophagy in human health and disease. N Engl J Med 368:651–662. [DOI] [PubMed] [Google Scholar]
- 3. Cianfanelli V, De Zio D, Di Bartolomeo S, Nazio F, Strappazzon F, Cecconi F (2015) Ambra1 at a glance. J Cell Sci 128:2003–2008. [DOI] [PubMed] [Google Scholar]
- 4. Damme M, Suntio T, Saftig P, Eskelinen EL (2015) Autophagy in neuronal cells: general principles and physiological and pathological functions. Acta Neuropathol 129:337–362. [DOI] [PubMed] [Google Scholar]
- 5. Desplats P, Lee HJ, Bae EJ, Patrick C, Rockenstein E, Crews L et al (2009) Inclusion formation and neuronal cell death through neuron‐to‐neuron transmission of alpha‐synuclein. Proc Natl Acad Sci USA 106:13010–13015. [DOI] [PMC free article] [PubMed] [Google Scholar]
- 6. Di Bartolomeo S, Corazzari M, Nazio F, Oliverio S, Lisi G, Antonioli M et al (2010) The dynamic interaction of AMBRA1 with the dynein motor complex regulates mammalian autophagy. J Cell Biol 191:155–168. [DOI] [PMC free article] [PubMed] [Google Scholar]
- 7. El‐Agnaf OM, Salem SA, Paleologou KE, Curran MD, Gibson MJ, Court JA et al (2006) Detection of oligomeric forms of alpha‐synuclein protein in human plasma as a potential biomarker for Parkinson's disease. FASEB J 20:419–425. [DOI] [PubMed] [Google Scholar]
- 8. Ettle B, Kerman BE, Valera E, Gillmann C, Schlachetzki JC, Reiprich S et al (2016) α‐Synuclein‐induced myelination deficit defines a novel interventional target for multiple system atrophy. Acta Neuropathol 132:59–75. [DOI] [PMC free article] [PubMed] [Google Scholar]
- 9. Fägerstam LG, Frostell‐Karlsson A, Karlsson R, Persson B, Rönnberg I (1992) Biospecific interaction analysis using surface plasmon resonance detection applied to kinetic, binding site and concentration analysis. J Chromatogr 597:397–410. [DOI] [PubMed] [Google Scholar]
- 10. Fanciulli A, Wenning GK (2015) Multiple‐system atrophy. N Engl J Med 372:249–263. [DOI] [PubMed] [Google Scholar]
- 11. Fimia GM, Stoykova A, Romagnoli A, Giunta L, Di Bartolomeo S, Nardacci R et al (2007) Ambra1 regulates autophagy and development of the nervous system. Nature 447:1121–1125. [DOI] [PubMed] [Google Scholar]
- 12. Fortin DL, Troyer MD, Nakamura K, Kubo S, Anthony MD, Edwards RH (2004) Lipid rafts mediate the synaptic localization of alpha‐synuclein. J Neurosci 24:6715–6723. [DOI] [PMC free article] [PubMed] [Google Scholar]
- 13. Fujiwara H, Hasegawa M, Dohmae N, Kawashima A, Masliah E, Goldberg MS et al (2002) α‐Synuclein is phosphorylated in synucleinopathy lesions. Nat Cell Biol 4:160–164. [DOI] [PubMed] [Google Scholar]
- 14. Goers J, Manning‐Bog AB, McCormack AL, Millett IS, Doniach S, Di Monte DA et al (2003) Nuclear localization of alpha‐synuclein and its interaction with histones. Biochemistry 42:8465–8471. [DOI] [PubMed] [Google Scholar]
- 15. Kahle PJ, Neumann M, Ozmen L, Muller V, Jacobsen H, Schindzielorz A et al (2000) Subcellular localization of wild‐type and Parkinson's disease‐associated mutant alpha‐synuclein in human and transgenic mouse brain. J Neurosci 20:6365–6373. [DOI] [PMC free article] [PubMed] [Google Scholar]
- 16. Kato S, Nakamura H (1990) Cytoplasmic argyrophilic inclusions in neurons of pontine nuclei in patients with olivopontocerebellar atrophy: immunohistochemical and ultrastructural studies. Acta Neuropathol 79:584–594. [DOI] [PubMed] [Google Scholar]
- 17. Kontopoulos E, Parvin JD, Feany MB (2006) Alpha‐synuclein acts in the nucleus to inhibit histone acetylation and promote neurotoxicity. Hum Mol Genet 15:3012–3023. [DOI] [PubMed] [Google Scholar]
- 18. Lee HJ, Suk JE, Patrick C, Bae EJ, Cho JH, Rho S et al (2010) Direct transfer of alpha‐synuclein from neuron to astroglia causes inflammatory responses in synucleinopathies. J Biol Chem 285:9262–9272. [DOI] [PMC free article] [PubMed] [Google Scholar]
- 19. Lee HJ, Cho ED, Lee KW, Kim JH, Cho SG, Lee SJ (2013) Autophagic failure promotes the exocytosis and intercellular transfer of α‐synuclein. Exp Mol Med 45:e22. [DOI] [PMC free article] [PubMed] [Google Scholar]
- 20. Maroteaux L, Campanelli JT, Scheller RH (1988) Synuclein: a neuron‐specific protein localized to the nucleus and presynaptic nerve terminal. J Neurosci 8:2804–2815. [DOI] [PMC free article] [PubMed] [Google Scholar]
- 21. McFarland MA, Ellis CE, Markey SP, Nussbaum RL (2008) Proteomics analysis identifies phosphorylation‐dependent alpha‐synuclein protein interactions. Mol Cell Proteomics 7:2123–2137. [DOI] [PMC free article] [PubMed] [Google Scholar]
- 22. McLean PJ, Ribich S, Hyman BT (2000) Subcellular localization of alpha‐synuclein in primary neuronal cultures: effect of missense mutations. J Neural Transm Suppl 58:53–63. [DOI] [PubMed] [Google Scholar]
- 23. Miki Y, Mori F, Tanji K, Kakita A, Takahashi H, Wakabayashi K (2011) Accumulation of histone deacetylase 6, an aggresome‐related protein, is specific to Lewy bodies and glial cytoplasmic inclusions. Neuropathology 31:561–568. [DOI] [PubMed] [Google Scholar]
- 24. Miki Y, Tanji K, Mori F, Utsumi J, Sasaki H, Kakita A et al (2016) Alteration of upstream autophagy‐related proteins (ULK1, ULK2, Beclin1, VPS34 and AMBRA1) in Lewy body disease. Brain Pathol 26:359–370. [DOI] [PMC free article] [PubMed] [Google Scholar]
- 25. Mizushima N, Yamamoto A, Matsui M, Yoshimori T, Ohsumi Y (2004) In vivo analysis of autophagy in response to nutrient starvation using transgenic mice expressing a fluorescent autophagosome marker. Mol Biol Cell 15:1101–1111. [DOI] [PMC free article] [PubMed] [Google Scholar]
- 26. Mori F, Tanji K, Yoshimoto M, Takahashi H, Wakabayashi K (2002) Immunohistochemical comparison of α‐ and β‐synuclein in adult rat central nervous system. Brain Res 941:118–126. [DOI] [PubMed] [Google Scholar]
- 27. Mori F, Nishie M, Piao YS, Kito K, Kamitani T, Takahashi H, Wakabayashi K (2005) Accumulation of NEDD8 in neuronal and glial inclusions of neurodegenerative disorders. Neuropathol Appl Neurobiol 31:53–61. [DOI] [PubMed] [Google Scholar]
- 28. Murayama S, Arima K, Nakazato Y, Satoh J, Oda M, Inose T (1992) Immunocytochemical and ultrastructural studies of neuronal and oligodendroglial cytoplasmic inclusions in multiple system atrophy. 2. Oligodendroglial cytoplasmic inclusions. Acta Neuropathol 84:32–38. [DOI] [PubMed] [Google Scholar]
- 29. Nakazato Y, Yamazaki H, Hirato J, Ishida Y, Yamaguchi H (1990) Oligodendroglial microtubular tangles in olivopontocerebellar atrophy. J Neuropathol Exp Neurol 49:521–530. [DOI] [PubMed] [Google Scholar]
- 30. Nardacci R, Amendola A, Ciccosanti F, Corazzari M, Esposito V, Vlassi C et al (2014) Autophagy plays an important role in the containment of HIV‐1 in nonprogressor‐infected patients. Autophagy 10:1167–1178. [DOI] [PMC free article] [PubMed] [Google Scholar]
- 31. Nazio F, Strappazzon F, Antonioli M, Bielli P, Cianfanelli V, Bordi M et al (2013) mTOR inhibits autophagy by controlling ULK1 ubiquitylation, self‐association and function through AMBRA1 and TRAF6. Nat Cell Biol 15:406–416. [DOI] [PubMed] [Google Scholar]
- 32. Nixon RA, Yang DS (2011) Autophagy failure in Alzheimer's disease–locating the primary defect. Neurobiol Dis 43:38–45. [DOI] [PMC free article] [PubMed] [Google Scholar]
- 33. Odagiri S, Tanji K, Mori F, Kakita A, Takahashi H, Wakabayashi K (2012) Autophagic adapter protein NBR1 is localized in Lewy bodies and glial cytoplasmic inclusions and is involved in aggregate formation in α‐synucleinopathy. Acta Neuropathol 124:173–186. [DOI] [PubMed] [Google Scholar]
- 34. Ozawa T, Paviour D, Quinn NP, Josephs KA, Sangha H, Kilford L et al (2004) The spectrum of pathological involvement of the striatonigral and olivopontocerebellar systems in multiple system atrophy: clinicopathological correlations. Brain 127:2657–2671. [DOI] [PubMed] [Google Scholar]
- 35. Papp MI, Lantos PL (1992) Accumulation of tubular structures in oligodendroglial and neuronal cells as the basic alteration in multiple system atrophy. J Neurol Sci 107:172–182. [DOI] [PubMed] [Google Scholar]
- 36. Papp MI, Kahn JE, Lantos PL (1989) Glial cytoplasmic inclusions in the CNS of patients with multiple system atrophy (striatonigral degeneration, olivopontocerebellar atrophy and Shy‐Drager syndrome). J Neurol Sci 94:79–100. [DOI] [PubMed] [Google Scholar]
- 37. Reyes JF, Rey NL, Bousset L, Melki R, Brundin P, Angot E (2014) Alpha‐synuclein transfers from neurons to oligodendrocytes. Glia 62:387–398. [DOI] [PubMed] [Google Scholar]
- 38. Roberts RF, Wade‐Martins R, Alegre‐Abarrategui J (2015) Direct visualization of alpha‐synuclein oligomers reveals previously undetected pathology in Parkinson's disease brain. Brain 138:1642–1657. [DOI] [PMC free article] [PubMed] [Google Scholar]
- 39. Sasaki S (2011) Autophagy in spinal cord motor neurons in sporadic amyotrophic lateral sclerosis. J Neuropathol Exp Neurol 70:349–359. [DOI] [PubMed] [Google Scholar]
- 40. Schwarz L, Goldbaum O, Bergmann M, Probst‐Cousin S, Richter‐Landsberg C (2012) Involvement of macroautophagy in multiple system atrophy and protein aggregate formation in oligodendrocytes. J Mol Neurosci 47:256–266. [DOI] [PubMed] [Google Scholar]
- 41. Specht CG, Tigaret CM, Rast GF, Thalhammer A, Rudhard Y, Schoepfer R (2005) Subcellular localisation of recombinant alpha‐ and gamma‐synuclein. Mol Cell Neurosci 28:326–334. [DOI] [PubMed] [Google Scholar]
- 42. Stefanova N, Wenning GK (2016) Review: multiple system atrophy: emerging targets for interventional therapies. Neuropathol Appl Neurobiol 42:20–32. [DOI] [PMC free article] [PubMed] [Google Scholar]
- 43. Tanik SA, Schultheiss CE, Volpicelli‐Daley LA, Brunden KR, Lee VM (2013) Lewy body‐like α‐synuclein aggregates resist degradation and impair macroautophagy. J Biol Chem 288:15194∓15115210. [DOI] [PMC free article] [PubMed] [Google Scholar]
- 44. Tanji K, Mori F, Kakita A, Takahashi H, Wakabayashi K (2011) Alteration of autophagosomal proteins (LC3, GABARAP and GATE‐16) in Lewy body disease. Neurobiol Dis 43:690–697. [DOI] [PubMed] [Google Scholar]
- 45. Tanji K, Tanaka T, Mori F, Kito K, Takahashi H, Wakabayashi K, Kamitani T (2006) NUB1 suppresses the formation of Lewy body‐like inclusions by proteasomal degradation of synphilin‐1. Am J Pathol 169:553–565. [DOI] [PMC free article] [PubMed] [Google Scholar]
- 46. Tanji K, Odagiri S, Maruyama A, Mori F, Kakita A, Takahashi H, Wakabayashi K (2013) Alteration of autophagosomal proteins in the brain of multiple system atrophy. Neurobiol Dis 49:190–198. [DOI] [PubMed] [Google Scholar]
- 47. Terni B, Rey MJ, Boluda S, Torrejón‐Escribano B, Sabate MP, Calopa M et al (2007) Mutant ubiquitin and p62 immunoreactivity in cases of combined multiple system atrophy and Alzheimer's disease. Acta Neuropathol 113:403–416. [DOI] [PubMed] [Google Scholar]
- 48. Wakabayashi K, Yoshimoto M, Tsuji S, Takahashi H (1998) αSynuclein immunoreactivity in glial cytoplasmic inclusions in multiple system atrophy. Neurosci Lett 249:180–182. [DOI] [PubMed] [Google Scholar]
- 49. Wenning GK, Stefanova N, Jellinger KA, Poewe W, Schlossmacher MG (2008) Multiple system atrophy: a primary oligodendrogliopathy. Ann Neurol 64:239–246. [DOI] [PubMed] [Google Scholar]
- 50. Winslow AR, Chen CW, Corrochano S, Acevedo‐Arozena A, Gordon DE, Peden AA et al (2010) α‐Synuclein impairs macroautophagy: implications for Parkinson's disease. J Cell Biol 190:1023–1037. [DOI] [PMC free article] [PubMed] [Google Scholar]
- 51. Zhang HX, Tanji K, Mori F, Wakabayashi K (2008) Epitope mapping of 2E2‐D3, a monoclonal antibody directed against human TDP‐43. Neurosci Lett 434:170–174. [DOI] [PubMed] [Google Scholar]
Associated Data
This section collects any data citations, data availability statements, or supplementary materials included in this article.
Supplementary Materials
Additional Supporting Information may be found in the online version of this article at the publisher's web‐site:
Figure 1. Weak immunoreactivity for AMBRA1 in oligodendroglia of normal control (arrowheads).
Figure 2. Immunohistochemistry and double immunofluorescence staining of ULK1 in NCIs. (A) Weak immunoreactivity for ULK1 in NCIs. (B‐D) Co‐localization of ULK1 and p‐α‐syn in NCIs (white arrowheads). ULK1 appears green and p‐α‐syn appears red. Bars = 20 μm
Figure 3. Immunoprecipitation of cultured cells using IgG binding with Protein G‐coupled magnetic beads only. No bands for AMBRA1 or WT α‐syn were detected by IgG binding with Protein G‐coupled magnetic beads.
Figure 4. Immunoprecipitation in the brains of MSA patients. Protein extracts from the cerebral cortex of MSA patients and normal controls, and cerebellar white matter of MSA patients and normal controls were immunoprecipitated using an anti‐AMBRA1 antibody. In IP samples of the cerebral cortex and cerebellar white matter of MSA patients, a rabbit anti‐p‐α‐syn antibody more clearly detected a high molecular smear band compared with normal controls.
Figure 5. Immunofluorescence analysis of α‐syn after treatment with Bafilomycin. (A‐F) Occurrence of LC3‐positive autophagosomes and α‐syn‐positive aggregates after treatment with Bafilomycin. Co‐localization of some autophagosomes with α‐syn‐positive aggregates (white arrowheads). LC3 appears green, and α‐syn appears red. Bars = 10 μm