Abstract
Objective
To measure the palatal thickness of both hard and soft tissues and to determine safe regions for the placement of mini-implants. The influences of sex and age on palatal thickness were also examined.
Materials and Methods
Cone-beam computed tomography images of 30 patients (12 males, 18 females), including 15 adults and 15 adolescents, were used in this study. The thicknesses of palatal hard tissue, soft tissue, and hard+soft tissues were measured at the coronal planes of first premolars, second premolars, first molars, and second molars (P1, P2, M1, and M2 planes, respectively).
Results
The hard tissue was thickest at the P1 plane, followed by at the P2, M1, and M2 planes, while the thickness of soft tissue was similar among the four planes. The trends in the changes of palatal thickness from midline to the lateral sides (V-pattern) were similar for the four planes. Palatal thickness was influenced by sex, age, and their interaction. Mapping of recommended and optimal sites for palatal mini-implants was accomplished.
Conclusions
Sex and age factors could influence palatal thickness. Therefore, the findings might be helpful for clinicians in guiding them to choose the optimal sites for palatal mini-implants.
Keywords: Palatal thickness, Mini-implants, CBCT, Orthodontics, Mini-screws
INTRODUCTION
Orthodontic mini-implants have been widely used in practice for a variety of tooth movements, including molar protraction, segment protraction, anterior tooth retraction, and distalization of an entire arch.1–4 Although mini-implants can be inserted either buccally or palatally to achieve diverse tooth movements, palatal mini-implants are usually preferred based on their superior stability.5 A recent clinical application of palatal mini-implants is “miniscrew-assisted rapid palatal expansion” (MARPE), widely used for maxillary transverse deficiency. MARPE applies expansion forces directly to the palatal bone through mini-implants and achieves more skeletal expansion compared to conventional tooth-borne palatal expansion.6 The median and paramedian areas of the palate consist of thick cortical bone that offers enough bone quality and quantity to support mini-implants.7 This area has the advantages of having no significant anatomical structures, such as nerves, blood vessels, or roots, that can interfere with the placement of mini-implants.8 Additionally, palatal regions are suitable for mini-implant insertion as a result of keratinized tissues covering the palatal bones and because there are no or minimal potential soft tissue irritations.9 The thickness of palatal soft tissues may influence an orthodontist's decision on the length of mini-implants and affects biomechanical stability and overall success rates of mini-implants.10 Thus, both palatal hard and soft tissue thickness should be considered in the planning of palatal mini-implant insertion.
The success of palatal mini-implants depends on bone quality and quantity, since stability is achieved by mechanical retention rather than by osseointegration.11,12 As a result of the additional bone height provided by the nasal crest, the midsagittal area of the palate is considered to be a safe location for mini-implants.13 However, midpalatal mini-implants have a high failure rate for adolescents because of inadequate ossification.13,14 Ryu et al.9 showed that palatal thickness was significantly lower in early mixed-dentition patients than in late-mixed– and permanent-dentition patients. To ensure stability, midpalatal regions should be avoided for adolescent patients as a result of incomplete suture ossification,15 and the suitable sites for the insertion of palatal mini-implants, especially midpalatal mini-implants, depend on the maturation of patients. Thus, because of the different growth patterns noted between male and female patients, patients' age and sex should be considered in the decision for the optimal implant placement sites.
Although several studies16–18 have evaluated the thickness of palatal bone, few studies have investigated the thickness of palatal soft tissues or examined the influences of age and sex on palatal mini-implant insertion. Therefore, the objectives of this study were to determine the thickness of palatal hard and soft tissues and to examine the interactions of age and sex on palatal thickness in order to guide clinicians in choosing the optimal sites for palatal mini-implants.
MATERIALS AND METHODS
This study was approved by the Ethical Committee of West China Hospital of Stomatology, Sichuan University.
Participants
The sample consisted of cone-beam computed tomography (CBCT) images of 30 systematically healthy patients (12 males, 18 females) who visited the West China Hospital of Stomatology, Sichuan University. Three grouping methods were applied for these patients: they were grouped by sex (12 males and 18 females), age (15 adolescents [14.4 ± 2.8 years of age] and 15 adults [25.6 ± 2.98 years of age]), and by sex and age (6 male adolescents, 9 female adolescents, 6 male adults, and 9 female adults). The exclusion criteria were (1) cleft palate or cleft lip; (2) impacted teeth in the palatal region; (3) obvious full or partial alveolar resorption; (4) pathological lesions in the jaw; (5) dental implants or dentures; and (6) previous palatal surgery.
CBCT Examinations
CBCT data were obtained using a three-dimensional volume scanner (MCT-1, J Morita Mfg Corp, Kyoto, Kyoto-fu, Japan) based on a cone-beam technique. The following settings were used: 85 kV (anterior posterior-latero lateral), 5.0 mA (anterior posterior), and 5.0 mA (latero lateral); exposure time, 17.5 seconds; and slice thickness, 0.5 mm.
Measurements of Palates
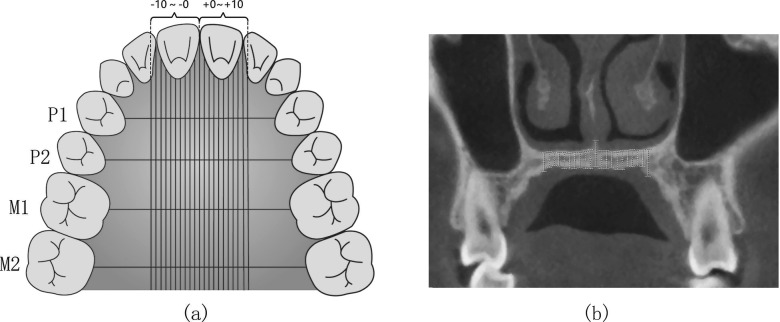
Four coronal planes were selected passing through the mesial-distal midpoints of bilateral first premolars, second premolars, first molars, and second molars, respectively. The planes were respectively marked as P1, P2, M1, and M2 (Figure 1a). The thickness of palatal hard tissue was defined as the distance between the upper and lower edges of palatal bone, while the thickness of palatal soft tissue was measured as the distance between the lower edge of palatal bone and the lower edge of palatal soft tissue. The thickness of hard+soft tissue was defined as the distance between the upper edge of palatal bone and the lower edge of palatal soft tissue. The thickness of the hard and soft tissue was measured every 1 mm (0 mm, 1 mm, …, 10 mm) away from the midpalatal suture. The point at the midpalatal suture was defined as point 0, and the other points were defined as points 1 to 10. (Figure 1b).
Figure 1.
Different measurement sites (−10 to ∼+10) at different planes (P1, P2, M1, and M2) in transverse and coronal views. a. Four coronal planes and measurement sites; b. An example of measurement sites at one coronal plane.
Statistical Analyses
The measurements were repeated randomly by the same author 2 weeks after the first measurement. The intraclass coefficient (ICC) test was used to analyze the reliability between the two measurements (ICC = 0.863). The average of the two independent measurements was used for the final data.
Two-way analysis of variance (ANOVA) was used to compare palatal thickness (hard tissue, soft tissue, and hard+soft tissues) among the four planes (P1, P2, M1, and M2) and among different distances (−10 to +10 mm) away from the midpalatal sutures. One-way ANOVA was applied to analyze the differences in palatal thickness of the same measuring point among different sex and age groups. Factorial design ANOVA was used to determine the interactions between age and sex. All data were analyzed using SPSS 25.0 and GraphPad 7.0, and a P value of less than .05 was considered statistically significant.
RESULTS
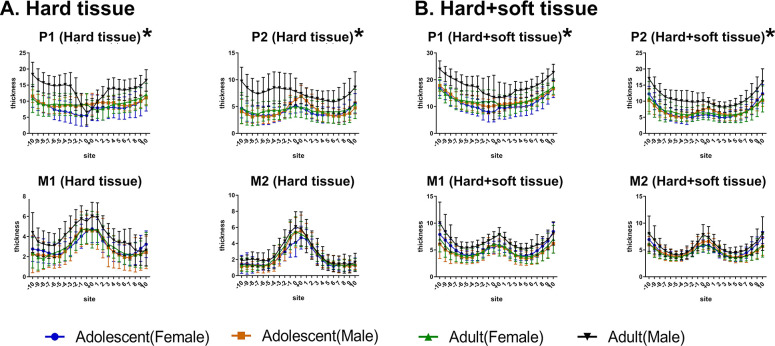
Since no statistical differences were detected between left and right sides for palatal thickness (hard tissue, soft tissue, and hard+soft tissues) (P = .296), the left and right side measurements were combined for statistical analyses. Two-way ANOVA with repeated measures revealed that the thickness of hard tissues was significantly influenced by different coronal planes (P1, P2, M1, and M2) (P < .001), different sites away from the midpalatal suture (0 to 10 mm) (P < .001), and by their interaction (P < .001).
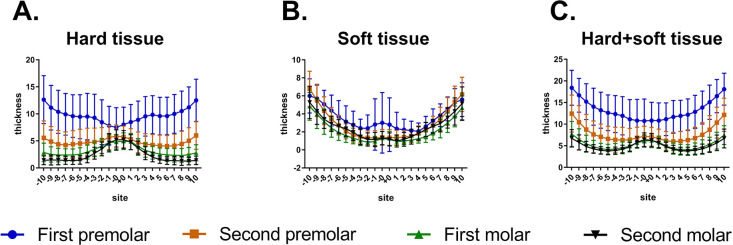
As displayed in Figure 2, for different sites away from the midpalatal suture, post hoc one-way ANOVA showed that, at the P1 plane, hard tissue thickness increased from point 0 to point 10 (P < .001), and soft tissue thickness decreased from point 0 to point 3 and then gradually increased from point 3 to point 10 (P < .001). The trends in the changes of hard+soft tissue thickness were similar to those of the hard tissue at the P1 plane. At the P2 plane, hard tissue thickness deceased from point 0 to point 7 and slightly increased thereafter, and soft tissue thickness gradually increased from point 0 to point 10. The trends in the changes of hard+soft tissue thickness were consistent with those of hard tissue thickness at the P2 plane. The trends in the changes of palatal thickness (hard, soft, and hard+soft) at the M1 and M2 planes were similar to those at the P2 plane.
Figure 2.
Comparison of palatal thickness of different sites and different planes. (A) Hard tissue. (B) Soft tissue. (C) Hard+soft tissue.
As depicted in Figure 2, hard tissues were thickest at the P1 plane among the four planes. Post hoc one-way ANOVA revealed that significant differences were found from point 3 to point 10 for hard tissues among the four planes (P < .001). For the soft tissue, the thickest was found at the P1 plane. For the hard+soft tissues, significant differences were found among the four different planes at all sites away from the midpalatal suture (P < .001), except between the M1 and M2 planes (these two planes were similar).
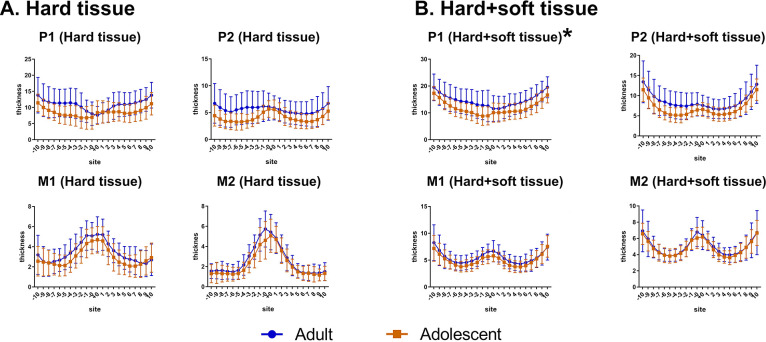
For different age groups (Figure 3), two-way ANOVA demonstrated that hard+soft tissue of adults was thicker than that of adolescents at the P1 plane (P = .039). No significant differences were detected for hard tissue or soft tissue thickness between age groups at the P1 plane (P > .05). No significant differences in palatal thickness (hard, soft, and hard+soft) were found between adults and adolescents at the other planes (P2, M1, and M2) (P > .05).
Figure 3.
Comparison of the thickness at different planes in adults and adolescents. (A) Hard tissue. (B) Hard+soft tissue.
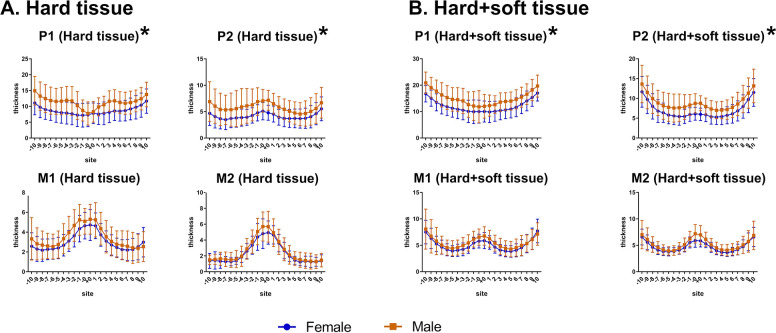
Between males and females (Figure 4), two-way ANOVA revealed that palatal hard tissues were significantly thicker in males than in females at the P1 (P = .025) and P2 (P = .030) planes, while they were not different at the M1 and M2 planes (P > .05). Likewise, similar results were found for hard+soft tissues (P1: P = .022, P2: P = .039, M1 and M2: P > .05) but not for soft tissues (P > .05).
Figure 4.
Comparison of the thickness at different planes at the same point in males and females. (A) Hard tissue. (B) Hard+soft tissue.
For the interactions between age and sex (Figure 5), factorial ANOVA showed that there were interaction effects between age and sex for the hard tissue at the P1 (P = .007) and P2 (P = .002) planes. Similar results were found for hard+soft tissues (P1: P = .002; P2: P = .002). However, no interactions were found for soft tissues (P > .05). Specifically, male adults had the thickest hard tissue and hard+soft tissue compared to the other subgroups that were similar to each other (female adults, male adolescents, and female adolescents).
Figure 5.
The interactions between sex and age on palatal tissue thickness. (A) Hard tissue. (B) Hard+soft tissue.
DISCUSSION
In this study, palatal thicknesses of hard tissue, soft tissue, and hard+soft tissues were evaluated to determine suitable sites for the insertion of orthodontic palatal mini-implants. Palatal tissues (hard, soft, and hard+soft) at the P1 plane were thickest among all the planes. Sex and age could influence palatal thickness.
Results showed that the thicknesses of hard tissue and hard+soft tissue at the P1 plane were thickest among the four planes, followed by those at the the P2, M1, and M2 planes. Kang et al.19 reported that the bone thickness decreased laterally and posteriorly, in agreement with the findings of this study. It could be considered that this change was attributed to embryonic development. Development of the hard palate consists of the primary palate and the secondary palate. They fuse in the fetal development process and form the anterior and posterior palate.20 Vertical thickening of the secondary palate is limited as a result of rapid development of the tongue, so the thickness of the posterior palate is relatively thinner.
In the coronal sections, the thickness of the hard tissue at the P1 plane gradually thickened from point 0 to point 10, with similar results for the hard+soft tissue thickness. For the other planes (P2, M1, and M2), palatal thickness (hard and hard+soft tissues) decreased first and slightly increased thereafter. These findings were consistent with previous studies20 that revealed that palatal tissues were thickened laterally from the midline. The midpalatal tissues may be thicker due to the fusion of bilateral palatal tissues at midpalatal sites and the presence of the nasal septum. The lateral sides of the hard palate were thicker, mainly due to the existence of alveolar bone and teeth. Thus, the areas between the midpalatal regions and the lateral sides were relatively thin, resulting in a V-pattern of the palatal thickness from median to lateral sites.
The hard tissues and hard+soft tissues of males were thicker than those of females at the P1 and P2 planes. Several studies7,19 reported that males had significantly greater palatal bone thickness than did females, in accordance with the current results. Manni et al.21 showed that compared to males, the failure risk of mini-implants was significantly higher in females, likey as a result of decreased bone thickness.
No significant difference was detected in the palatal tissue thickness between adults and adolescents. Consistent with these results, Gracco et al.22 found no differences in palatal bone thickness between adults and adolescents. However, Ryu et al.9 showed that there was significantly lower bone thickness in adolescents than in adults. These inconsistent results could be attributed to different patient selection. In the present study and the study by Gracco et al.,22 patients in the adolescent group were all in the late stages of the mixed dentition, while Ryu et al.9 included both early- and late-mixed–dentition patients.
For the hard tissue and hard+soft tissues, the current results showed that age and sex had interactions at the P1 and P2 plane, but not for soft tissue. Thus, the patients were divided into four subgroups based on sex and age: male adults, female adults, male adolescents, and female adolescents. In particular, male adults had the thickest hard tissue and hard+soft tissue compared to the other subgroups. It was previously shown23 that the midpalatal suture was broad and became slightly sinuous at birth and then developed into a typical squamous suture until the age of 16 years in females and 18 years in males. Considering that the palatal sutures of adolescents were less ossified, a mini-implant implantation site near the middle of the hard palate should not be chosen. Since thin hard tissue may lead to a risk of perforation into the incisive canal or the nasal cavity, the stable retention of mini-implants requires thick hard tissue.
This study demonstrated that soft tissue thickness gradually increased from the midline to the lateral side of palate and was not affected by sex or age factors. Previous studies24,25 showed that inflammation surrounding a mini-implant was the most significant predictor of mini-implant failure. Prolonged inflammation in soft tissues led to peri-implantitis, resulting in the breakdown of bone around mini-implants. Baumgaertel26 found that thin soft tissue could effectively reduce the incidence of inflammation around mini-implants. The proper length of mini-implants may be influenced by soft tissue thickness; thus, orthodontists should choose longer mini-implants to insert into the lateral side of the palate in order to gain enough stability. However, in terms of mechanical considerations, Wilmes et al.27 reported that longer mini-implants might cause higher torque during insertion, which can lead to the microdamage of the bone and the consequent loss of the mini-implants.
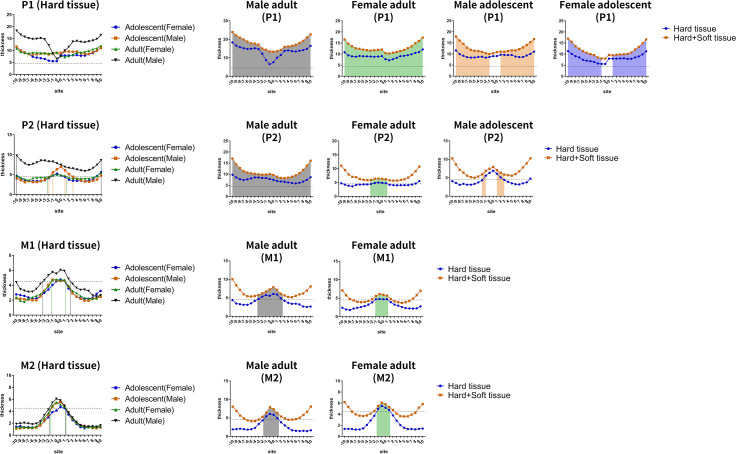
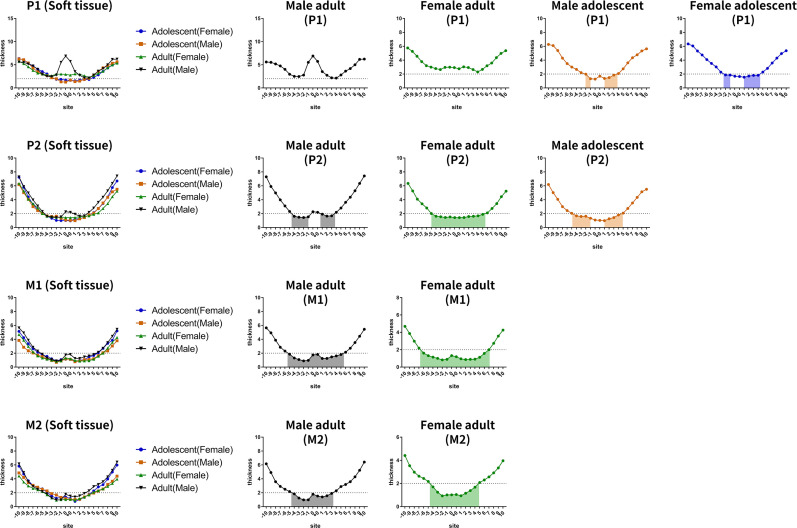
A recent study28 found that mini-implants with insertion depths greater than 4.5 mm in bone had high success rates. Thus, the recommended regions were mapped (hard tissue thickness greater than 4.5 mm) to display the optimal regions (hard tissue thickness greater than 4.5 mm and soft tissue thickness less than 2mm) for palatal mini-screws for the different combinations of sex and age (Figures 6 through 8). The ideal locations for placement of palatal mini-implants were −10 mm to +10 mm (male and female adults), −10 mm to −1 mm and +1 mm to +10 mm (male and female adolescents) between teeth 14 and 24; −10 mm to 10 mm (male adults), −2 mm to +1 mm (female adults), −2 mm to −1 mm and +1 mm to +3 mm (male adolescents) between teeth 15 and 25; −3 mm to +2 mm (male adults) and −1 mm to +1 mm (female adults) between teeth 16 and 26; and −2 mm to +1 mm (male adults) and −1 mm to +1 mm (female adults) between teeth 17 and 27.
Figure 6.
Thickness of hard tissue at different planes for different subgroups (male adults, female adults, male adolescents, and female adolescents). Horizontal dotted lines at the thickness of 4.5 mm are drawn in each diagram, and the resulting colored areas (thickness greater than 4.5 mm) were indicative of recommended palatal regions for mini-implants. Sites near midpalatal sutures of adolescents were avoided in consideration of anatomical factors.
Figure 8.
The green regions are recommended for the placement of palatal mini-implants where the thickness of palatal hard tissue was greater than 4.5 mm. The yellow regions are the optimal sites for palatal mini-implants, where the thickness of palatal hard tissue was greater than 4.5 mm and the thickness of soft tissue was less than 2 mm. For adolescents, midpalatal areas should be avoided for the insertion of mini-implants.
Figure 7.
Thickness of soft tissue at different planes for different subgroups (male adults, female adults, male adolescents, and female adolescents). Different colored lines and blocks indicate different sex and age groups. Horizontal dotted lines at the thickness of 2 mm are drawn in each diagram, and the colored areas indicate that the soft tissue thickness was less than 2 mm.
For MARPE patients requiring the placement of palatal mini-implants, four palatal mini-implants are inserted to achieve bone-borne rapid palatal expansion, with two anterior mini-implants placed at the P1 plane and two posterior ones placed at the M1 plane. From the standpoint of mini-implant stability, the posterior two mini-implants are very susceptible to loosening and failure in adolescents and some female adults due to inadequate palatal bone. Thus, hybrid bone-borne and tooth-borne palatal expanders with four palatal mini-implants are recommended for adolescents who require MARPE treatment.
CONCLUSIONS
In conclusion, palatal thickness decreased from anterior to posterior and from median to lateral in a V-pattern. Palatal thickness was influenced by sex, age, and their interaction. A mapping of recommended and optimal regions for palatal mini-implants is suggested for clinicians.
ACKNOWLEDGMENTS
This work was supported and funded by the National Natural Science Foundation of China (Contracts 81571004, 81500884, and 81400549), the Applied and Fundamental Research Program funded by the Department of Science and Technology of Sichuan Province (Contract 2018JY0558), and the Research Grant of the Health Commission of Sichuan Province (Contract 19PJ233).
REFERENCES
- 1.Kyung SH, Lee JY, Shin JW, et al. Distalization of the entire maxillary arch in an adult. Am J Orthod Dentofacial Orthop. 2009;135(suppl 4):S123–S132. doi: 10.1016/j.ajodo.2008.01.015. [DOI] [PubMed] [Google Scholar]
- 2.Uribe F, Mehr R, Mathur A, Janakiraman N, Allareddy V. Failure rates of mini-implants placed in the infrazygomatic region. Prog Orthod. 2015;16(31) doi: 10.1186/s40510-015-0100-2. [DOI] [PMC free article] [PubMed] [Google Scholar]
- 3.Sivamurthy G, Sundari S. Stress distribution patterns at mini-implant site during retraction and intrusion—a three-dimensional finite element study. Prog Orthod. 2016;17(4) doi: 10.1186/s40510-016-0117-1. [DOI] [PMC free article] [PubMed] [Google Scholar]
- 4.Kassem HE, Marzouk ES. Prediction of changes due to mandibular autorotation following miniplate-anchored intrusion of maxillary posterior teeth in open bite cases. Prog Orthod. 2018;19(13) doi: 10.1186/s40510-018-0213-5. [DOI] [PMC free article] [PubMed] [Google Scholar]
- 5.Mohammed H, Wafaie K, Rizk MZ, et al. Role of anatomical sites and correlated risk factors on the survival of orthodontic miniscrew implants: a systematic review and meta-analysis. Prog Orthod. 2018;19:36. doi: 10.1186/s40510-018-0225-1. [DOI] [PMC free article] [PubMed] [Google Scholar]
- 6.Celenk-Koca T, Erdinc A, Hazar S, et al. Evaluation of miniscrew-supported rapid maxillary expansion in adolescents: a prospective randomized clinical trial. Angle Orthod. 2018;88:702–709. doi: 10.2319/011518-42.1. [DOI] [PMC free article] [PubMed] [Google Scholar]
- 7.Yadav S, Sachs E, Vishwanath M, et al. Gender and growth variation in palatal bone thickness and density for mini-implant placement. Prog Orthod. 2018;19:43. doi: 10.1186/s40510-018-0241-1. [DOI] [PMC free article] [PubMed] [Google Scholar]
- 8.Ludwig B, Glasl B, Kinzinger GS, Walde KC, Lisson JA. The skeletal frog appliance for maxillary molar distalization. J Clin Orthod. 2011;45:77–84. quiz 91. [PubMed] [Google Scholar]
- 9.Ryu JH, Park JH, Vu Thi Thu T, et al. Palatal bone thickness compared with cone-beam computed tomography in adolescents and adults for mini-implant placement. Am J Orthod Dentofacial Orthop. 2012;142:207–212. doi: 10.1016/j.ajodo.2012.03.027. [DOI] [PubMed] [Google Scholar]
- 10.Motoyoshi M, Hirabayashi M, Uemura M, Shimizu N. Recommended placement torque when tightening an orthodontic mini-implant. Clin Oral Implants Res. 2006;17:109–114. doi: 10.1111/j.1600-0501.2005.01211.x. [DOI] [PubMed] [Google Scholar]
- 11.Kim HJ, Yun HS, Park HD, Kim DH, Park YC. Soft-tissue and cortical-bone thickness at orthodontic implant sites. Am J Orthod Dentofacial Orthop. 2006;130:177–182. doi: 10.1016/j.ajodo.2004.12.024. [DOI] [PubMed] [Google Scholar]
- 12.Sumer AP, Caliskan A, Uzun C, et al. The evaluation of palatal bone thickness for implant insertion with cone beam computed tomography. Int J Oral Maxillofac Surg. 2016;45:216–220. doi: 10.1016/j.ijom.2015.09.012. [DOI] [PubMed] [Google Scholar]
- 13.Kyung SH, Hong SG, Park YC. Distalization of maxillary molars with a midpalatal miniscrew. J Clin Orthod. 2003;37:22–26. [PubMed] [Google Scholar]
- 14.Henriksen B, Bavitz B, Kelly B, Harn SD. Evaluation of bone thickness in the anterior hard palate relative to midsagittal orthodontic implants. Int J Oral Maxillofac Implants. 2003;18:578–581. [PubMed] [Google Scholar]
- 15.Schlegel KA, Kinner F, Schlegel KD. The anatomic basis for palatal implants in orthodontics. Int J Adult Orthod Orthognath Surg. 2002;17:133–139. [PubMed] [Google Scholar]
- 16.Gupta P, Jan SM, Behal R, Mir RA, Shafi M. Accuracy of cone-beam computerized tomography in determining the thickness of palatal masticatory mucosa. J Indian Soc Periodontol. 2015;19:396–400. doi: 10.4103/0972-124X.156876. [DOI] [PMC free article] [PubMed] [Google Scholar]
- 17.Sabban H, Mahdian M, Dhingra A, Lurie AG, Tadinada A. Evaluation of linear measurements of implant sites based on head orientation during acquisition: an ex vivo study using cone-beam computed tomography. Imaging Sci Dent. 2015;45:73–80. doi: 10.5624/isd.2015.45.2.73. [DOI] [PMC free article] [PubMed] [Google Scholar]
- 18.Nienkemper M, Santel N, Honscheid R, Drescher D. Orthodontic mini-implant stability at different insertion depths—sensitivity of three stability measurement methods. J Orofacial Orthop Fortschritte Kieferorthopadie. 2016;77:296–303. doi: 10.1007/s00056-016-0036-2. [DOI] [PubMed] [Google Scholar]
- 19.Kang S, Lee SJ, Ahn SJ, Heo MS, Kim TW. Bone thickness of the palate for orthodontic mini-implant anchorage in adults. Am J Orthod Dentofacial Orthop. 2007;131(suppl 4):S74–S81. doi: 10.1016/j.ajodo.2005.09.029. [DOI] [PubMed] [Google Scholar]
- 20.Schoenwolf GC, Bleyl SB, Brauer PR, Francis-West PH. Larsen's Human Embryology 5th ed. Philadelphia, Pa: Churchill Livingstone; 2015. [Google Scholar]
- 21.Manni A, Cozzani M, Tamborrino F, De Rinaldis S, Menini A. Factors influencing the stability of miniscrews. A retrospective study on 300 miniscrews. Eur J Orthod. 2011;33:388–395. doi: 10.1093/ejo/cjq090. [DOI] [PubMed] [Google Scholar]
- 22.Gracco A, Lombardo L, Cozzani M, Siciliani G. Quantitative cone-beam computed tomography evaluation of palatal bone thickness for orthodontic miniscrew placement. Am J Orthod Dentofacial Orthop. 2008;134:361–369. doi: 10.1016/j.ajodo.2007.01.027. [DOI] [PubMed] [Google Scholar]
- 23.Revelo B, Fishman LS. Maturational evaluation of ossification of the midpalatal suture. Am J Orthod Dentofacial Orthop. 1994;105:288–292. doi: 10.1016/S0889-5406(94)70123-7. [DOI] [PubMed] [Google Scholar]
- 24.Chen YJ, Chang HH, Lin HY, et al. Stability of miniplates and miniscrews used for orthodontic anchorage: experience with 492 temporary anchorage devices. Clin Oral Implants Res. 2008;19:1188–1196. doi: 10.1111/j.1600-0501.2008.01571.x. [DOI] [PubMed] [Google Scholar]
- 25.Yao CC, Chang HH, Chang JZ, et al. Revisiting the stability of mini-implants used for orthodontic anchorage. J Formos Med Assoc. 2015;114:1122–1128. doi: 10.1016/j.jfma.2014.08.001. [DOI] [PubMed] [Google Scholar]
- 26.Baumgaertel S. Hard and soft tissue considerations at mini-implant insertion sites. J Orthod. 2014;41(suppl 1):S3–S7. doi: 10.1179/1465313314Y.0000000104. [DOI] [PubMed] [Google Scholar]
- 27.Wilmes B, Ottenstreuer S, Su YY, Drescher D. Impact of implant design on primary stability of orthodontic mini-implants. J Orofac Orthop. 2008;69:42–50. doi: 10.1007/s00056-008-0727-4. [DOI] [PubMed] [Google Scholar]
- 28.Ichinohe M, Motoyoshi M, Inaba M, et al. Risk factors for failure of orthodontic mini-screws placed in the median palate. J Oral Sci. 2019;61:13–18. doi: 10.2334/josnusd.17-0377. [DOI] [PubMed] [Google Scholar]


