Abstract
Objectives
To compare the effects of two different force magnitudes on maxillary posterior segment intrusion using mini-screws. The null hypothesis was that there would be no difference between the two force magnitudes.
Materials and Methods
Adult patients with skeletal open bite and a dental open bite ranging from 3 to 8 mm were recruited for this trial. The comparator group had 200 g of intrusive force applied for posterior segment intrusion, whereas 400 g of force was applied in the intervention group. Primary outcomes were the amount of posterior teeth intrusion and anterior open bite closure.
Results
Twenty-two subjects were randomized to include 11 participants in each group. One participant dropped out in each group, leaving us with 10 subjects to be analyzed per group. There was statistically significant posterior teeth intrusion of 2.42 ± 2.06 and 2.26 ± 1.87 mm for the comparator and intervention groups, respectively, with no difference between them. Statistically significant open bite closure was achieved in both groups, measuring 2.24 ± 1.18 and 3.15 ± 1.06 mm in the comparator and intervention groups, respectively, with no difference between them.
Conclusions
Both the 200 g and 400 g intrusive forces yielded similar outcomes in terms of posterior teeth intrusion and anterior open bite closure.
Keywords: Molar intrusion, Open bite, Force magnitude, Mini-screw
INTRODUCTION
Skeletal open bite is one of the most difficult malocclusions to treat and retain.1,2 This difficulty may be attributed to a complex multifactorial etiology, which ranges from the inheritance of a hyperdivergent growth pattern to environmental factors such as digit sucking and tongue thrusting.3,4
One of the most prominent components of skeletal open bite is excessive vertical growth of the posterior maxillary dento-alveolus,2,5,6 with resultant downward and backward mandibular rotation. Such rotation hinges the mandible open and contributes to the development of a skeletal open bite.6
In the past decade, temporary anchorage devices (TADs) have been widely implemented in orthodontic treatment when special anchorage demands were required. Using TADs has expanded the envelope of conservative treatment and made maxillary, and sometimes mandibular, buccal segment intrusion possible and effective7–9 without the need for surgical intervention and with comparable results.10
The literature is replete with approaches that have been adopted to achieve maxillary buccal segment intrusion with a diversity of skeletal anchorage devices, force delivery systems, and force magnitudes. Despite being not clearly stated in some studies,8,9,11,12 the reported force magnitudes for maxillary posterior segment intrusion ranged from 150 g13–15 to 500 g.16–19 Yet evidence is still lacking with regard to which force magnitude is best to provide the optimum outcomes.17
The aim of the current study was to compare the effects of two different force magnitudes used for maxillary buccal segment intrusion in terms of the amount of posterior segment intrusion and anterior open bite closure as the primary outcomes.
MATERIALS AND METHODS
Trial Design
The study was a two-arm, parallel, randomized clinical trial with an allocation ratio of 1:1. No changes were done after commencement of the study. The protocol for this trial was registered at clinical trials.gov (identifier NCT02901678).
Participants, Eligibility Criteria, and Settings
This study was carried out in the clinic of the Orthodontic Department, Faculty of Dentistry–Cairo University, after approval was obtained from the Center of Evidence-Based Dentistry and Research Ethics Committee. All subjects were acquainted with the study procedures and signed an informed consent. Participant eligibility criteria are presented in Table 1.
Table 1. .
Patient Eligibility Criteria
| Inclusion Criteria |
Exclusion Criteria |
| Adult patients aged 18 to 25 y Skeletal open bite, as verified from the lateral cephalograms Dental open bite ranging from 3 to 8 mm Skeletal Class I or mild to moderate skeletal Class II Normal incisal show at rest and on smiling Minimal if any tooth size arch length discrepancy necessitating extraction No history of previous orthodontic treatment | Moderate to severe crowding requiring teeth extraction Dental open bites without evidence of skeletal component Decreased incisal show at rest and on smiling Medically compromised patients or those with chronic use of medications such as corticosteroids and smoking |
Sample Size Calculation
The sample size was calculated based on a type I error probability of .05, and the power of the statistical test was set at 80% using two previous studies.14,16 Means of 1.8 (standard deviation [SD] = ±0.7) and 3.37 (SD = ±1.21) were reported for the comparator and intervention groups, respectively, resulting in an effect size of 1.58 mm. Considering dropouts, a sample size of 16 patients was considered appropriate. Twenty patients were included in the analysis, 10 in each group.
Randomization and Blinding
A computer-generated random sequence was completed using a Microsoft Office Excel 2013 sheet by SK, with a 1:1 allocation ratio. Numbers from 1 to 22 were written on opaque papers and folded four times, placed in sealed opaque envelopes, and kept in a box until time of implementation. On the day of loading, each subject was asked to pick an opaque envelope and uncover the number. As a result of the nature of the study, the operator could not be blinded; however, the patients and assessors were blinded.
Interventions and Data Analysis
Preintrusion phase.
All patients received a segmented, fixed appliance on the maxillary posterior segments bilaterally, including first and second premolars as well as first and second molars. Roth prescription brackets (0.022 × 0.028 inches) were used (Gemini brackets; 3M Unitek, St. Paul, MN, USA). Levelling and alignment were done until we reached 0.019 × 0.025-inch stainless-steel archwires.
Intrusion phase.
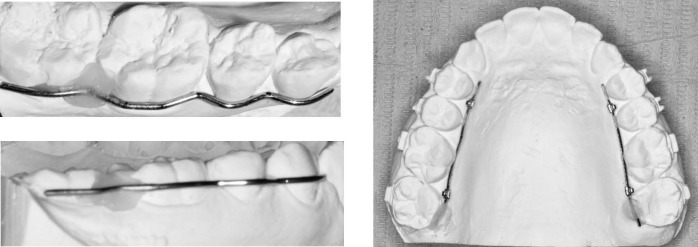
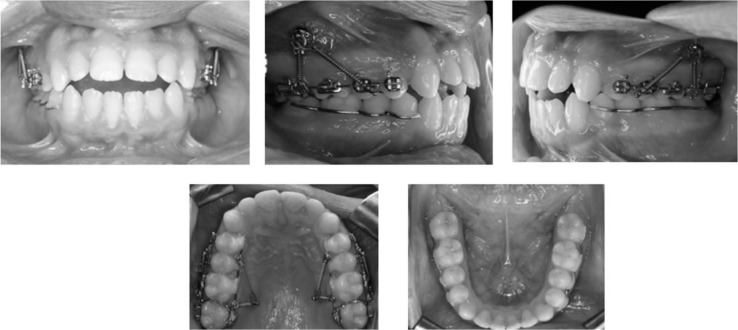
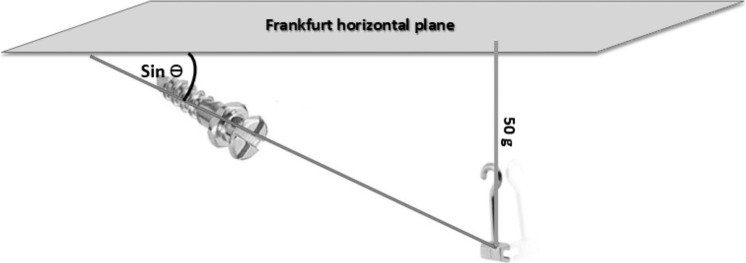
Four mini-screws (10 × 1.6 mm; 3M Unitek TAD) were placed for each patient: two infrazygomatic20 and two palatal screws between the first and second molars. The palatal screws were inserted 8 to 10 mm from the gingival margin and perpendicular to the vertical palatal shelf. Two weeks later, the secondary stability of mini-screws was checked, and patients were sent to take cone-beam computed tomographic (CBCT) scans (i-CAT CBCT unit; Imaging Sciences International, Hatfield, Pa) (T1). Upper and lower working models were obtained to fabricate palatal wires for intrusion as well as lower buccal stabilizing wires (Figure 1). Intrusion was started using closed nickel-titanium (Ni-Ti) coil springs (Morelli, Sorocaba, São Paulo, Brazil). Each mini-screw had two coil springs attached to it and to the corresponding crimpable hooks buccally and palatally (Figure 2). The net intrusion force magnitude applied at one side by the coil springs was 200 g for the comparator group and 400 g for the intervention group. To ensure accurate force measurements, the preintrusion CBCT was used to analyze the forces at each coil spring in order to obtain the resultant force required for application in both groups (Figure 3). The lower posterior segment was stabilized using 0.9-mm-thick laboratory wire bonded on their buccal surface.
Figure 1.
Indirect fabrication of the upper palatal wires for intrusion and lower buccal stabilizing wires to minimize lower tooth extrusion.
Figure 2.
The appliance assembly showing infrazygomatic and palatal mini-screws, coil springs, and the lower stabilizing wires.
Figure 3.
Diagram showing calculation of the applied force for the anterior coil springs using the angle calculated from the Anatomage software.
Patients were recalled every 2 weeks to check the appliance integrity and to measure the anterior open bite clinically using a digital caliper (VINCA DCLA-0605). Recalibration of the Ni-Ti coil springs was done every month to ensure a continuous force delivery system. After 6 months, another CBCT was taken, from which the amount of molar intrusion was measured (T2).
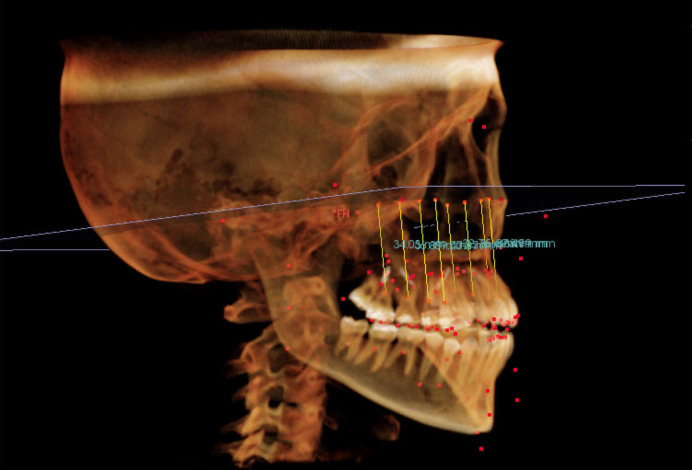
A customized three-dimensional analysis was specifically created for this study on InVivo 5 (Anatomage) software version 5.3r (Anatomage, San Jose, Calif). The amount of maxillary teeth intrusion was measured as the change in the perpendicular distance from the molar trifurcation or the premolar center (midpoint between buccal cusp tip and root apex of the premolar, automatically generated by the software after locating these two landmarks) to the Frankfurt horizontal plane. Pooling of the result for each group was calculated to facilitate comparison and interpretation (Figure 4). Tipping of intruded teeth mesio-distally and bucco-lingually was also measured for individual teeth and the whole right and left segments to assess if bodily segmental intrusion was possible. Lower teeth extrusion was also measured as the change in distance from molar bifurcation or premolar center to the mandibular plane, with calculation of the pooled result.
Figure 4.
Intrusion measurements on a CBCT image: distance from center of premolars or molar trifurcation to the Frankfurt horizontal plane.
Clinical measurement of anterior open bite was used to calculate the mean open bite closure in both groups. The CBCT measurements were excluded for this variable because of their low intra- and interobserver reliability.
Statistical Analysis
Statistical analysis was performed with SPSS version 17 (SPSS Inc, Chicago, Ill) for Windows. The Shapiro-Wilk test of normality was used to test the normality hypothesis of all quantitative variables. For the most part, the variables were found to be normally distributed, allowing the use of parametric tests. A paired-sample t-test was applied for comparing the changes from pre to post within each group, and an independent sample t-test was used for comparing the difference pre to post between the two groups. For reliability analysis of inter- and intraobserver reliability of all measured variables, concordance correlation coefficients, including 95% confidence limits, were used.
RESULTS
Participant Flow
Out of the 22 patients included in the study, one patient was lost in each group, leaving us with 20 patients, 10 in each group (Figure 5).
Figure 5.
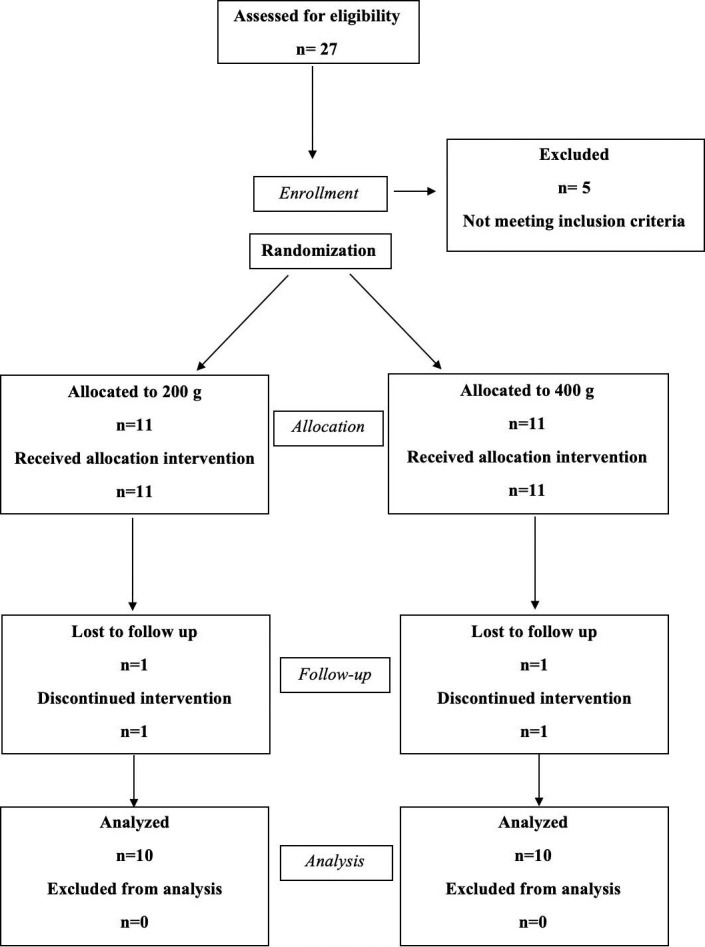
CONSORT participant flow diagram.
Baseline Characteristics
At baseline, information regarding age, amount of open bite, and mandibular plane inclination relative to the cranial base was gathered and compared. Baseline characteristics were similar for both groups, with no statistically significant differences (Table 2).
Table 2. .
Demographic Data and Baseline Characteristic Differences in the Comparison (Control) and Intervention Groups
| Variable |
Group |
Mean |
SD |
Mean Difference |
Std Error Difference |
95% CI |
P Value |
|
| Lower |
Upper |
|||||||
| Age | Control | 19.22 | 1.45 | 0.27 | 0.72 | −1.25 | 1.79 | .71363 |
| Intervention | 18.95 | 1.77 | ||||||
| Open bite | Control | 5.01 | 0.93 | −0.74 | 0.66 | −2.12 | 0.65 | .278734 |
| Intervention | 5.75 | 1.87 | ||||||
| SN/MP | Control | 42.31 | 5.91 | 0.82 | 2.82 | −5.10 | 6.75 | .774328 |
| Intervention | 41.49 | 6.68 | ||||||
SN/MP indicates mandibular plane inclination relative to the anterior cranial base; SD, standard deviation; Std, standard; CI, confidence interval; and P value > .05, nonsignificant.
Intrusion and Open Bite Closure Measurements
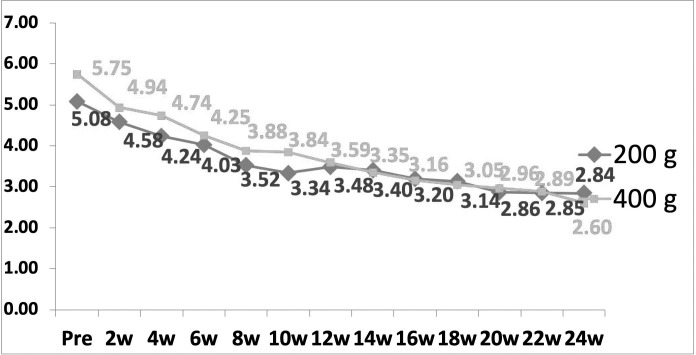
The amount of intrusion was statistically significant for all maxillary posterior teeth and for the pooled results in both groups. However, there was no statistically significant difference between the groups regarding intrusion of any tooth or the pooled results (Table 3). Mean buccal segment intrusion was 2.42 ± 2.06 and 2.26 ± 1.87 mm for the comparator and the intervention groups, respectively. The tipping movements, as viewed sagittally and frontally, were statistically insignificant for all teeth within or between the groups (Table 4). The open bite closure measurements were statistically significant for intervals 1, 2, 4, and 10 in the comparator group and for intervals 1, 3, and 8 in the intervention group and for the overall duration in both groups, with no statistically significant difference between the two groups (Table 5). The mean open bite closure measured 2.24 ± 1.18 and 3.15 ± 1.06 mm for the comparator and the intervention groups, respectively (Figure 6). Clinical photographs of a patient from the comparator group are shown in Figure 7. The extrusion of the lower posterior teeth was statistically significant in both groups, with a value of 0.84 ± 1.22 and 0.57 ± 0.55 mm for the comparator and intervention groups, respectively, with no statistically significant difference between the groups (Table 6).
Table 3. .
Descriptive and Comparative Statistics for Intrusion Measurementsa
| Comparator Group |
Intervention Group |
Intergroup Differences |
||||||||||||||||||||||
| Variable |
Mean |
SD |
SEM |
Mean |
SD |
SEM |
95% CI |
P Value |
Mean |
SD |
SEM |
Mean |
SD |
SEM |
95% CI |
P Value |
Mean Difference |
SD |
95% CI |
P Value |
||||
| Lower |
Upper |
Lower |
Upper |
Lower |
Upper |
|||||||||||||||||||
| UR4-FH | Pre | 40.9 | 3.84 | 1.21 | 0.91 | 1 | 0.32 | 0.2 | 1.62 | .01789* | 39.24 | 2.38 | 0.75 | 1.53 | 1.59 | 0.5 | 0.39 | 2.67 | .01414* | −0.62 | 0.59 | −1.87 | 0.63 | .31166 |
| Post | 39.99 | 3.8 | 1.2 | 37.71 | 3.03 | 0.96 | ||||||||||||||||||
| UR5-FH | Pre | 39.54 | 4.13 | 1.31 | 1.32 | 1.09 | 0.35 | 0.54 | 2.11 | .00402* | 38.15 | 1.82 | 0.58 | 1.61 | 1.26 | 0.4 | 0.71 | 2.52 | .00296* | −0.29 | 0.53 | −1.4 | 0.82 | .59122 |
| Post | 38.22 | 3.71 | 1.17 | 36.54 | 2.58 | 0.82 | ||||||||||||||||||
| UR6-FH | Pre | 38.22 | 4.37 | 1.38 | 2.29 | 0.94 | 0.3 | 1.62 | 2.97 | .00003* | 37.26 | 1.8 | 0.57 | 2.52 | 1.28 | 0.41 | 1.61 | 3.44 | .00016* | −0.23 | 0.5 | −1.29 | 0.83 | .65192 |
| Post | 35.92 | 4.11 | 1.3 | 34.74 | 2.51 | 0.79 | ||||||||||||||||||
| UR7-FH | Pre | 36.68 | 4.36 | 1.38 | 2.77 | 1.49 | 0.47 | 1.71 | 3.84 | .00023* | 34.87 | 1.77 | 0.56 | 3.31 | 2.78 | 0.88 | 2.33 | 6.3 | .00084* | −1.54 | 1 | −3.63 | 0.56 | .14017 |
| Post | 33.9 | 4.32 | 1.37 | 30.56 | 4.12 | 1.3 | ||||||||||||||||||
| UL4-FH | Pre | 41.5 | 3.24 | 1.03 | 1.54 | 2.39 | 0.76 | −0.17 | 3.26 | .04166* | 39.74 | 2.29 | 0.72 | 1.21 | 1.6 | 0.51 | 0.06 | 2.36 | .04109* | 0.34 | 0.91 | −1.58 | 2.25 | .71649 |
| Post | 39.96 | 4.09 | 1.29 | 38.54 | 2.59 | 0.82 | ||||||||||||||||||
| UL5-FH | Pre | 40.54 | 3.19 | 1.01 | 2.56 | 2.17 | 0.69 | 1.01 | 4.11 | .00461* | 39.02 | 1.88 | 0.59 | 1.73 | 0.91 | 0.29 | 1.08 | 2.39 | .00020* | 0.83 | 0.74 | −0.73 | 2.39 | .27935 |
| Post | 37.97 | 3.89 | 1.23 | 37.29 | 1.91 | 0.61 | ||||||||||||||||||
| UL6-FH | Pre | 38.86 | 3.59 | 1.14 | 2.93 | 0.95 | 0.3 | 2.25 | 3.61 | .00000* | 36.61 | 2.27 | 0.72 | 2.22 | 1.38 | 0.44 | 1.23 | 3.21 | .00067* | 0.71 | 0.53 | −0.41 | 1.82 | .20094 |
| Post | 35.94 | 3.43 | 1.09 | 34.39 | 2.59 | 0.82 | ||||||||||||||||||
| UL7-FH | Pre | 36.96 | 3.39 | 1.07 | 3.51 | 2.85 | 0.9 | 2.96 | 7.04 | .00035* | 34.29 | 2.03 | 0.64 | 2.91 | 1.99 | 0.63 | 1.48 | 4.33 | .00126* | 2.09 | 1.1 | −0.22 | 4.4 | .07295 |
| Post | 31.96 | 3.98 | 1.26 | 31.38 | 2.75 | 0.87 | ||||||||||||||||||
| Pooled intrusion | Pre | 39.15 | 4 | 0.45 | 2.42 | 2.06 | 0.23 | 1.96 | 2.88 | .00000* | 37.4 | 2.73 | 0.31 | 2.26 | 1.87 | 0.21 | 1.84 | 2.67 | .00000* | 0.16 | 0.31 | −0.45 | 0.77 | .60629 |
| Post | 36.73 | 4.61 | 0.52 | 35.14 | 3.86 | 0.43 | ||||||||||||||||||
U indicates upper; R, right; L, left; SD, standard deviation; SEM, standard error mean; CI, confidence interval; P ≥ .05, non-significant; and P ≤ .05, significant (*).
Table 4. .
Mesio-Distal Tipping Relative to Frankfurt Horizontal Plane (Tooth/FH) and Change in Torque Relative to Mid–Sagittal Plane (Tooth/MSP) of Intruded Teeth in Both Groupsa
| Group |
Mean |
SD |
SEM |
Mean Difference |
SD |
95% CI |
P Value |
||
| Lower |
Upper |
||||||||
| UR4/FH | C | 0.78 | 12.75 | 4.03 | −0.32 | 10.21 | −21.77 | 21.14 | .97566 |
| I | 1.09 | 29.67 | 9.38 | ||||||
| UR4/MSP | C | −1.35 | 9.04 | 2.86 | −2.13 | 3.40 | −9.28 | 5.01 | .53879 |
| I | 0.78 | 5.82 | 1.84 | ||||||
| UR5/FH | C | −4.68 | 15.97 | 5.05 | 3.66 | 7.50 | −12.09 | 19.42 | .63107 |
| I | −8.34 | 17.54 | 5.55 | ||||||
| UR5/MSP | C | −0.47 | 5.92 | 1.87 | −3.77 | 2.60 | −9.23 | 1.68 | .16356 |
| I | 3.30 | 5.70 | 1.80 | ||||||
| UR6/FH | C | −3.52 | 5.55 | 1.75 | 2.03 | 4.72 | −7.89 | 11.94 | .67295 |
| I | −5.54 | 13.85 | 4.38 | ||||||
| UR6/MSP | C | −1.56 | 7.77 | 2.46 | −7.51 | 3.25 | −14.34 | −0.69 | .32836 |
| I | 5.96 | 6.73 | 2.13 | ||||||
| UR7/FH | C | 1.58 | 13.18 | 4.17 | 5.49 | 5.53 | −6.12 | 17.10 | .33356 |
| I | −3.91 | 11.48 | 3.63 | ||||||
| UR7/MSP | C | 0.64 | 6.13 | 1.94 | −4.34 | 2.92 | −10.48 | 1.81 | .15524 |
| I | 4.98 | 6.92 | 2.19 | ||||||
| UL4/FH | C | −5.00 | 8.17 | 2.58 | −9.63 | 8.94 | −28.40 | 9.15 | .29552 |
| I | 4.62 | 27.05 | 8.55 | ||||||
| UL4/MSP | C | 0.03 | 6.33 | 2.00 | −0.74 | 2.38 | −5.73 | 4.26 | .76010 |
| I | 0.77 | 4.05 | 1.28 | ||||||
| UL5/FH | C | −10.87 | 23.53 | 7.44 | 4.40 | 8.48 | −13.42 | 22.22 | .61026 |
| I | −15.27 | 12.86 | 4.07 | ||||||
| UL5/MSP | C | 1.62 | 8.03 | 2.54 | 1.16 | 3.07 | −5.29 | 7.60 | .71049 |
| I | 0.46 | 5.44 | 1.72 | ||||||
| UL6/FH | C | −6.13 | 9.17 | 2.90 | −0.73 | 3.82 | −8.75 | 7.29 | .85109 |
| I | −5.40 | 7.85 | 2.48 | ||||||
| UL6/MSP | C | 2.55 | 5.15 | 1.63 | −2.41 | 2.34 | −7.33 | 2.52 | .31801 |
| I | 4.96 | 5.33 | 1.69 | ||||||
| UL7/FH | C | − | 7.20 | 2.28 | 5.65 | 3.28 | −1.24 | 12.53 | .10224 |
| I | −9.34 | 7.46 | 2.36 | ||||||
| UL7/MSP | C | 2.06 | 4.71 | 1.49 | −1.52 | 2.66 | −7.11 | 4.08 | .57609 |
| I | 3.58 | 6.99 | 2.21 | ||||||
| UR/FH | C | −1.46 | 12.29 | 1.94 | 2.72 | 3.58 | −4.41 | 9.84 | .44997 |
| I | −4.18 | 19.00 | 3.00 | ||||||
| UR/MSP | C | −0.68 | 7.09 | 1.12 | −4.44 | 1.51 | −7.44 | −1.43 | .43099 |
| I | 3.75 | 6.38 | 1.01 | ||||||
| UL/FH | C | −6.42 | 13.49 | 2.13 | −0.08 | 3.43 | −6.90 | 6.75 | .98202 |
| I | −6.35 | 16.97 | 2.68 | ||||||
| UL/MSP | C | 1.57 | 6.02 | 0.95 | −0.88 | 1.31 | −3.48 | 1.73 | .50486 |
| I | 2.44 | 5.67 | 0.90 | ||||||
U indicates upper; R, right; L, left; FH, Frankfurt horizontal plane; MSP, mid–sagittal plane; C, comparator group; I, intervention group; SD, standard deviation; SEM, standard error mean; CI, confidence interval; and P ≥ .05, nonsignificant.
Table 5. .
Open Bite Closure as Measured Clinically Every 2 Weeks and the Total Value in Both Groupsa
| Mean |
SD |
Mean Difference |
SD |
SEM |
P Value |
||||||||||
| Interval |
C |
I |
C |
I |
C |
I |
C-I |
C |
I |
C |
I |
C |
I |
C-I |
|
| 1 | W2 | 4.584 | 4.938 | 0.89 | 1.79 | −0.498 | −0.810 | 0.31 | 0.44 | 0.57 | 0.15 | 0.18 | .0093* | .0015* | >.05 |
| pre | 5.082 | 5.748 | 0.95 | 1.87 | |||||||||||
| 2 | W4 | 4.243 | 4.740 | 0.92 | 1.79 | −0.341 | −0.198 | −0.14 | 0.16 | 0.37 | 0.05 | 0.12 | .0002* | .1212 | >.05 |
| W2 | 4.584 | 4.938 | 0.89 | 1.79 | |||||||||||
| 3 | W6 | 4.032 | 4.252 | 1.40 | 1.73 | −0.211 | −0.488 | 0.28 | 0.55 | 0.31 | 0.18 | 0.10 | .2814 | .0007* | >.05 |
| W4 | 4.243 | 4.740 | 0.92 | 1.79 | |||||||||||
| 4 | W8 | 3.524 | 3.875 | 1.37 | 1.47 | −0.508 | −0.377 | −0.13 | 0.56 | 1.11 | 0.19 | 0.35 | .0257* | .3103 | >.05 |
| W6 | 4.032 | 4.252 | 1.40 | 1.73 | |||||||||||
| 5 | W10 | 3.338 | 3.841 | 1.11 | 1.60 | −0.187 | −0.034 | −0.15 | 0.44 | 0.93 | 0.15 | 0.29 | .2358 | .9102 | >.05 |
| W8 | 3.524 | 3.875 | 1.37 | 1.47 | |||||||||||
| 6 | W12 | 3.480 | 3.590 | 1.13 | 1.46 | 0.142 | −0.251 | 0.39 | 0.48 | 0.44 | 0.16 | 0.14 | .4024 | .1042 | >.05 |
| W10 | 3.338 | 3.841 | 1.11 | 1.60 | |||||||||||
| 7 | W14 | 3.403 | 3.351 | 1.28 | 1.35 | −0.077 | −0.239 | 0.16 | 0.30 | 0.60 | 0.10 | 0.19 | .4716 | .2400 | >.05 |
| W12 | 3.480 | 3.590 | 1.13 | 1.46 | |||||||||||
| 8 | W16 | 3.197 | 3.155 | 1.55 | 1.30 | −0.207 | −0.196 | −0.01 | 0.34 | 0.11 | 0.11 | 0.04 | .1027 | .0004* | >.05 |
| W14 | 3.403 | 3.351 | 1.28 | 1.35 | |||||||||||
| 9 | W18 | 3.137 | 3.045 | 1.61 | 1.51 | −0.060 | −0.110 | 0.05 | 0.30 | 0.42 | 0.10 | 0.13 | .5703 | .4257 | >.05 |
| W16 | 3.197 | 3.155 | 1.55 | 1.30 | |||||||||||
| 10 | W20 | 2.861 | 2.960 | 1.51 | 1.57 | −0.276 | −0.085 | −0.19 | 0.24 | 0.24 | 0.08 | 0.08 | .0087* | .2978 | >.05 |
| W18 | 3.137 | 3.045 | 1.61 | 1.51 | |||||||||||
| 11 | W22 | 2.847 | 2.887 | 1.52 | 1.81 | −0.014 | −0.073 | 0.06 | 0.29 | 0.49 | 0.10 | 0.16 | .8855 | .6490 | >.05 |
| W20 | 2.861 | 2.960 | 1.51 | 1.57 | |||||||||||
| 12 | W24 | 2.844 | 2.601 | 1.63 | 1.73 | −0.002 | −0.286 | 0.28 | 0.35 | 0.43 | 0.12 | 0.13 | .9852 | .0626 | >.05 |
| W22 | 2.847 | 2.887 | 1.52 | 1.81 | |||||||||||
| Total | W24 | 2.844 | 2.601 | 1.63 | 1.73 | −2.238 | −3.147 | 1.18 | 1.06 | 0.39 | 0.33 | .0004** | .0000** | ||
| Pre | 5.082 | 5.748 | 0.95 | 1.87 | |||||||||||
W indicates week; SD, standard deviation; SEM, standard mean error; C, comparator group; I, intervention group; C-I, difference between comparison and intervention; P ≥ .05, nonsignificant; P ≤ .05, significant (*); and P ≤ .01, highly significant (**). Each interval defines a period of 2 weeks.
Figure 6.
Mean open bite measurements every 2 weeks in both groups.
Figure 7.
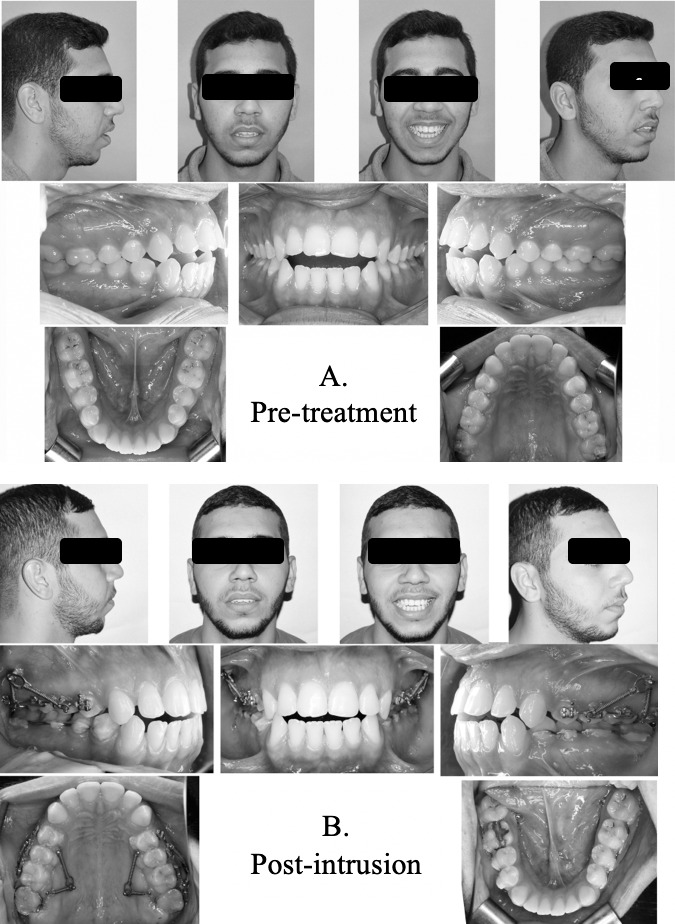
Extra- and intraoral photographs of a patient in the comparator group. (A) Pretreatment and (B) postintrusion.
Table 6. .
Extrusion Measurements of Lower Posterior Teeth in Both Groupsa
| Group |
Mean |
SD |
SEM |
Mean Difference |
SD |
95% CI |
P Value |
||
| Lower |
Upper |
||||||||
| LR4 center-MP | C | 0.73 | 0.75 | 0.24 | 0.56 | 0.27 | 0.00 | 1.12 | .48588 |
| I | 0.17 | 0.27 | 0.09 | ||||||
| LR5 center-MP | C | 0.43 | 0.58 | 0.18 | 0.12 | 0.22 | −0.34 | 0.58 | .58567 |
| I | 0.31 | 0.31 | 0.10 | ||||||
| LR6 fur-MP | C | 1.69 | 2.74 | 0.87 | 0.96 | 0.93 | −1.00 | 2.92 | .31413 |
| I | 0.73 | 0.49 | 0.16 | ||||||
| LR7 fur-MP | C | 1.10 | 0.71 | 0.22 | 0.49 | 0.29 | −0.11 | 1.09 | .10493 |
| I | 0.61 | 0.50 | 0.17 | ||||||
| LL4 center-MP | C | 0.35 | 0.66 | 0.21 | −0.27 | 0.28 | −0.86 | 0.32 | .34926 |
| I | 0.62 | 0.55 | 0.18 | ||||||
| LL5 center-MP | C | 0.38 | 0.43 | 0.13 | −0.09 | 0.21 | −0.53 | 0.35 | .66040 |
| I | 0.47 | 0.48 | 0.16 | ||||||
| LL6 fur-MP | C | 0.43 | 0.41 | 0.13 | −0.13 | 0.22 | −0.59 | 0.33 | .56391 |
| I | 0.56 | 0.54 | 0.18 | ||||||
| LL7 fur-MP | C | 1.62 | 0.98 | 0.31 | 0.49 | 0.40 | −0.36 | 1.35 | .24137 |
| I | 1.13 | 0.75 | 0.25 | ||||||
| Pooled extrusion lower | C | 0.84 | 1.22 | 0.14 | 0.27 | 0.16 | −0.04 | 0.58 | .09027 |
| I | 0.57 | 0.55 | 0.07 | ||||||
LR indicates lower right; LL, lower left; MP, mandibular plane; fur, bifurcation; Pooled extrusion lower, mean values for extrusion of all lower eight teeth; C, comparator group; I, intervention group; SD, standard deviation; SEM, standard mean error; CI, confidence interval; and P ≥ .05, nonsignificant.
Harms
Soft tissue overgrowth around the heads of the infrazygomatic mini-screws was observed in some cases. Patients were given strict oral hygiene instructions, together with blowing exercises (to be performed twice daily) to minimize this soft tissue overgrowth.
Two mini-screws, one in the infrazygomatic region and one on the palatal side, became loose in two different patients during the intrusion phase. These screws were replaced and loading was delayed for 2 weeks, at which point intrusion was resumed.
DISCUSSION
A debate in the literature regarding the force magnitude required for effective skeletal anchorage–supported posterior segment intrusion has been reported.17 Different authors used variable forces and reported different amounts of intrusion. The minimum intrusive force used was 50 g per side,21 while the more commonly used forces ranged between 100 and 200 g.13,14,22 On the other hand, Kato and Kato23 suggested that a force of 100 g was insufficient for posterior segment intrusion and stated that increasing the force up to 300 g permitted progressive intrusion. Later, a range of 200 to 400 g for segmental posterior intrusion was suggested.24 Less commonly, heavier forces were used, ranging from 400 g16 up to 500 g,17–19 to achieve adequate amounts of intrusion. Since most of these studies used different methodologies, their results could not be compared directly. The current study was conducted to compare the effects of 200 g vs 400 g of force for posterior teeth intrusion in the treatment of skeletal open bite. Choosing 200 g as the comparison force magnitude was done based on recommendations from an experimental study by Schwarz25 that emphasized that a force of 20 g per root was suitable for intrusion.
A segmented fixed appliance was chosen in the current study in order to avoid any extrusion of the incisor teeth if a continuous arch was used since the patients chosen had normal incisor show at rest and on smiling. Incisor bonding was delayed after the end of the intrusion phase, as was also reported in other studies.9,11,15,18 Likewise, Marzouk et al.19 bonded the upper arch in three separate segments, aiming to minimize incisor extrusion. On the other hand, Xun et al.14 used full arch mechanics during posterior segment intrusion; hence, their reported amount of open bite closure could not be attributed to posterior teeth intrusion alone.
The primary outcome of the current trial was assessment of the amount of posterior teeth intrusion using 200 g vs 400 g of intrusive force supported by skeletal anchorage. There was no statistically significant difference between the two groups in the intrusion measurements, in which a mean buccal segment intrusion of 2.42 and 2.26 mm were achieved for the comparator and intervention groups, respectively. This was consistent with the results of Carrillo et al.,26 who reported no difference in the amount of intrusion with varying force magnitudes. On the other hand, Xun et al.14 achieved 1.8 mm of maxillary first molar intrusion using 150 g, as compared to 3.37 mm achieved by Akan et al.16 using 400 g for the same purpose. The difference in the results between these two studies could be due to the use of mini-plates together with an acrylic splint, in the latter study which might have contributed to the greater amount of intrusion observed.
Using a force of 200 g resulted in an amount of intrusion that was comparable to that reported by Scheffler and Proffit15 and Xun et al.,14 who used 150 g of intrusive force and achieved 2.3 and 1.8 mm of molar intrusion, respectively. As for the 400 g force group, the results of the current study were close to that reported by de Oliveira et al.18 and Foot et al.,17 with 2.9 and 2.6 mm of upper molar intrusion, respectively. On the other hand, Akan et al.16 and Marzouk et al.19 reported a greater amount of 3.3 to 3.6 mm of intrusion. The difference in the results could be due to the use of an occlusal splint or transpalatal arches in their studies.
Analyzing individual teeth intrusion amounts, the amount of intrusion increased gradually as the tooth was located more posteriorly, closer to the line of traction. Intrusion at the second molar was more than double that at the first premolar in both groups. Considering the posterior segment as one unit, with the center of resistance between the second premolar and the first molar,27 the resultant forces from the four coil springs passed distal to this center of resistance. Such a force system resulted in clockwise rotation of the posterior segment. This clockwise moment might have augmented the intrusive movement at the molars and diminished it at the premolars.
The current study revealed comparable clinical and statistical effects of using 200 g vs 400 g for maxillary buccal segment intrusion. However, lower magnitudes of intrusion forces have always been recommended25 as being more biologically tolerable.
Limitations and Generalizability
Although the study had a 6-month observation period, most of the patients did not achieve positive overbite during this time. Perhaps longer observation periods, together with control of interferences at the canine and lower teeth extrusion, would result in greater open bite closure. This study was conducted in a single center and by a single operator; however, all attempts to reduce bias were considered. Results were consistent with those of previous reports regarding the primary outcome, thus supporting that the results can be generalized.
CONCLUSIONS
There was no statistically significant difference in the amount of posterior teeth intrusion between 200 g and 400 g of applied intrusive force.
Significant amounts of posterior teeth intrusion and open bite closure were achieved in both groups.
Extrusion of the lower buccal segment together with interferences at the canines during maxillary buccal segment intrusion could have some limiting effects during open bite closure, which should be considered in further studies.
ACKNOWLEDGMENTS
The authors would like to thank Dr Sherif Elkordy (SK) for his contribution toward random-sequence generation and secondary assessment of the radiographic measurements.
DISCLOSURE
The authors declare no financial competing interests. No financial conflicts of interest are declared.
REFERENCES
- 1.Ngan P, Fields H. Open bite: a review of etiology and management. Pediatr Dent. 1997;19:91–98. [PubMed] [Google Scholar]
- 2.Wang Y-C, Ko EW-C. The nature of open bite. J Taiwan Assoc Orthod. 2005;17:35–41. [Google Scholar]
- 3.Serrao G, Sforza C, Dellavia C, Antinori M, Ferrario VF. Relation between vertical facial morphology and jaw muscle activity in healthy young men. Progr Orthod. 2003;4:45–51. doi: 10.1034/j.1600-9975.2002.02031.x. [DOI] [PubMed] [Google Scholar]
- 4.de Oliveira JML, Dutra ALT, Pereira CM, de Toledo OA. Etiology and treatment of anterior open bite. Health Sci Inst J. 2011;29:92–95. [Google Scholar]
- 5.Kucera J, Marek I, Tycova H, Baccetti T. Molar height and dentoalveolar compensation in adult subjects with skeletal open bite. Angle Orthod. 2011;81:564–569. doi: 10.2319/081910-488.1. [DOI] [PMC free article] [PubMed] [Google Scholar]
- 6.Pakshir H, Fattahi H, Jahromi SS, Baghdadabadi NA. Predominant dental and skeletal components associated with open-bite malocclusion. J World Fed Orthod. 2014;3:169–173. [Google Scholar]
- 7.Umemori M, Sugawara J, Mitani H, Nagasaka H, Kawamura H. Skeletal anchorage system for open-bite correction. Am J Orthod Dentofacial Orthop. 1999;115:166–174. doi: 10.1016/S0889-5406(99)70345-8. [DOI] [PubMed] [Google Scholar]
- 8.Sherwood KH, Burch JG, Thompson WJ. Closing anterior open bites by intruding molars with titanium miniplate anchorage. Am J Orthod Dentofacial Orthop. 2002;122:593–600. doi: 10.1067/mod.2002.128641. [DOI] [PubMed] [Google Scholar]
- 9.Erverdi N, Keles A, Nanda R. The use of skeletal anchorage in open bite treatment: a cephalometric evaluation. Angle Orthod. 2004;74:381–390. doi: 10.1043/0003-3219(2004)074<0381:TUOSAI>2.0.CO;2. [DOI] [PubMed] [Google Scholar]
- 10.Kuroda S, Sakai Y, Tamamura N, Deguchi T, Takano-Yamamoto T. Treatment of severe anterior open bite with skeletal anchorage in adults: comparison with orthognathic surgery outcomes. Am J Orthod Dentofacial Orthop. 2007;132:599–605. doi: 10.1016/j.ajodo.2005.11.046. [DOI] [PubMed] [Google Scholar]
- 11.Deguchi T, Kurosaka H, Oikawa H, et al. Comparison of orthodontic treatment outcomes in adults with skeletal open bite between conventional edgewise treatment and implant-anchored orthodontics. Am J Orthod Dentofacial Orthop. 2011;139:S60–S68. doi: 10.1016/j.ajodo.2009.04.029. [DOI] [PubMed] [Google Scholar]
- 12.Hart TR, Cousley RR, Fishman LS, Tallents RH. Dentoskeletal changes following mini-implant molar intrusion in anterior open bite patients. Angle Orthod. 2015;85:941–948. doi: 10.2319/090514-625.1. [DOI] [PMC free article] [PubMed] [Google Scholar]
- 13.Yao C-CJ, Lee J-J, Chen H-Y, Chang Z-CJ, Chang H-F, Chen Y-J. Maxillary molar intrusion with fixed appliances and mini-implant anchorage studied in three dimensions. Angle Orthod. 2005;75:754–760. doi: 10.1043/0003-3219(2005)75[754:MMIWFA]2.0.CO;2. [DOI] [PubMed] [Google Scholar]
- 14.Xun C, Zeng X, Wang X. Microscrew anchorage in skeletal anterior open-bite treatment. Angle Orthod. 2007;77:47–56. doi: 10.2319/010906-14R.1. [DOI] [PubMed] [Google Scholar]
- 15.Scheffler NR, Proffit WR. Miniscrew-supported posterior intrusion for treatment of anterior open bite. J Clin Orthod. 2014;48:158–168. [PubMed] [Google Scholar]
- 16.Akan S, Kocadereli I, Aktas A, Taşar F. Effects of maxillary molar intrusion with zygomatic anchorage on the stomatognathic system in anterior open bite patients. Eur J Orthod. 2011;35:93–102. doi: 10.1093/ejo/cjr081. [DOI] [PubMed] [Google Scholar]
- 17.Foot R, Dalci O, Gonzales C, Tarraf NE, Darendeliler MA. The short-term skeleto-dental effects of a new spring for the intrusion of maxillary posterior teeth in open bite patients. Progr Orthod. 2014;15:56. doi: 10.1186/s40510-014-0056-7. [DOI] [PMC free article] [PubMed] [Google Scholar]
- 18.de Oliveira TFM, Nakao CY, Gonçalves JR, Santos-Pinto A. Maxillary molar intrusion with zygomatic anchorage in open bite treatment: lateral and oblique cephalometric evaluation. Oral Maxillofac Surg. 2015;19:71–77. doi: 10.1007/s10006-014-0457-2. [DOI] [PubMed] [Google Scholar]
- 19.Marzouk E, Abdallah E, El-Kenany W. Molar intrusion in open-bite adults using zygomatic miniplates. Int J Orthod. 2015;26:47–54. [PubMed] [Google Scholar]
- 20.Baumgaertel S, Tran T. Buccal mini-implant site selection: the mucosal fallacy and zones of opportunity. J Clin Orthod. 2012;46:434. [PubMed] [Google Scholar]
- 21.Tasanapanont J, Wattanachai T, Apisariyakul J, et al. Biochemical and clinical assessments of segmental maxillary posterior tooth intrusion. Int J Dent. 2017. 2017(2):1–7. [DOI] [PMC free article] [PubMed]
- 22.H-a Lee, Y-c Park. Treatment and posttreatment changes following intrusion of maxillary posterior teeth with miniscrew implants for open bite correction. Korean J Orthod. 2008;38:31–40. [Google Scholar]
- 23.Kato S, Kato M. Intrusion of molars with implants as anchorage: a report of two cases. Clin Implant Dent Related Res. 2006;8:100–106. doi: 10.1111/j.1708-8208.2006.00005.x. [DOI] [PubMed] [Google Scholar]
- 24.Kravitz ND, Kusnoto B, Tsay TP, Hohlt WF. The use of temporary anchorage devices for molar intrusion. J Am Dent Assoc. 2007;138:56–64. doi: 10.14219/jada.archive.2007.0021. [DOI] [PubMed] [Google Scholar]
- 25.Schwarz AM. Tissue changes incidental to orthodontic tooth movement. Int J Orthod Oral Surg Radiogr. 1932;18:331–352. [Google Scholar]
- 26.Carrillo R, Rossouw PE, Franco PF, Opperman LA, Buschang PH. Intrusion of multiradicular teeth and related root resorption with mini-screw implant anchorage: a radiographic evaluation. Am J Orthod Dentofacial Orthop. 2007;132:647–655. doi: 10.1016/j.ajodo.2006.08.017. [DOI] [PubMed] [Google Scholar]
- 27.Burstone CJ, Choy K. The Biomechanical Foundation of Clinical Orthodontics. Quintessence Publishing Company, Inc; Hanover Park, IL, USA: 2015. [Google Scholar]


