

Abstract
Altered mitochondrial function is characteristic in the substantia nigra in Parkinson's disease (PD). Information about mitochondria in other brain regions such as the cerebral cortex is conflicting mainly because most studies have not contemplated the possibility of variable involvement depending on the region, stage of disease progression and clinical symptoms such as the presence or absence of dementia. RT‐qPCR of 18 nuclear mRNAs encoding subunits of mitochondrial complexes and 12 mRNAs encoding energy metabolism‐related enzymes; western blotting of mitochondrial proteins; and analysis of enzymatic activities of complexes I, II, II, IV and V of the respiratory chain were assessed in frontal cortex area 8 and the angular gyrus of middle‐aged individuals (MA), and those with incidental PD (iPD), long‐lasting PD with parkinsonism without dementia (PD) and long‐lasting PD with dementia (PDD). Up‐regulation of several genes was found in frontal cortex area 8 in PD when compared with MA and in the angular gyrus in iPD when compared with MA. Marked down‐regulation of genes encoding mitochondrial subunits and energy metabolism‐related enzymes occurs in frontal cortex but only of genes coding for energy metabolism‐related enzymes in the angular gyrus in PDD. Significant decrease in the protein expression levels of several mitochondrial subunits encoded by these genes occurs in frontal cortex area 8 and angular gyrus in PDD. Moreover, expression of MT‐ND1 which is encoded by mitochondrial DNA is also reduced in PDD. Reduced enzymatic activity of complex III in frontal cortex area 8 and angular gyrus is observed in PD, but dramatic reduction in the activity of complexes I, II, II and IV in both regions characterizes PDD. Dementia in the context of PD is linked to region‐specific deregulation of genomic genes encoding subunits of mitochondrial complexes and to marked reduction in the activity of mitochondrial complexes I, II, III and IV.
Keywords: cerebral cortex, energy metabolism, dementia, incidental PD, mitochondria, oxidative phosphorylation, Parkinson disease, PDD, respiratory chain
Introduction
Parkinson's disease (PD) is a chronic, progressive neurodegenerative disorder which in typical cases starts in the autonomic nervous system and olfactory bulb and then progresses to the medulla oblongata, pons and midbrain, and limbic system, eventually involving the neocortex several years after the beginning of symptoms. The classification of disease progression into six stages is based on the presence of the hallmark pathological lesions and is useful to explain clinical manifestations which parallel neuropathological lesions in typical cases, at least at the first and middle stages of the disease 8, 14, 15, 27. Hallmark pathological lesions are Lewy bodies and neurites (LB inclusions) composed of abnormal α‐synuclein 28.
Altered mitochondrial function mainly characterized by reduced complex I activity and increased oxidative damage is well documented in the substantia nigra in PD where dopaminergic neurons projecting to the striatum degenerate and LB inclusions are abundant. This is accompanied by oxidative damage 41. Combined phosphorus and proton magnetic resonance spectroscopic imaging have also shown mitochondrial dysfunction in midbrain and putamen in PD 26. Mitochondrial degeneration and oxidation of several mitochondrial‐associated proteins have also been observed in α‐synuclein transgenic mice used as a model of PD 32, 38.
Oxidative damage is not restricted to the substantia nigra and striatum in PD. Increased expression of oxidative stress markers and altered oxidative responses occur in the frontal cortex 1, 25, 34, 39. This is further supported by the identification in the frontal cortex of proteins which are damaged as a result of oxidation, including α‐synuclein, β‐synuclein, UCHL1, SOD1, SOD2 and DJ‐1 9, 10, 11, 12, 13, 33. Moreover, several key proteins are targets of oxidative damage in the frontal cortex even at very early stages of PD, such as aldolase A, enolase 1 and glyceraldehyde dehydrogenase (GAPDH), all of them involved in glycolysis and energy metabolism 23.
Oxidative damage and disassembly of complex I subunits, functional impairment of complex I activity and adaptive responses are found in the frontal cortex at advanced stages of PD, in some cases in patients who probably suffered from dementia 29, 36, 37, and in PD plus dementia 22. Altered mitochondrial function is also observed in dementia with Lewy bodies (DLB) 36. However, little information is available regarding mitochondrial alterations in the cerebral cortex with disease progression from early pre‐motor stages of PD to advanced stages without and with associated dementia.
Previous studies have shown reduced metabolism, as revealed with [(18)F]‐fluorodeoxyglucose Positron Emission Tomography (PET), in the frontal cortex, and progression to the angular gyrus, orbital cortex, posterior cingulus and occipital lobes in PD patients with cognitive impairment and dementia 5, 21, 31.
Based on these data, the objective of the present study was to characterize the involvement of mitochondria in the cerebral cortex in PD post‐mortem samples in three groups: iPD, cases without parkinsonian symptoms categorized neuropathologically as stages 3 and 4 and dying of fatal concurrent events that disrupted life expectancies; PD, cases with a long history of parkinsonism and subjected to anti‐parkinsonian therapy for several years without dementia, categorized neuropathologically as stages 5 and 6 without dementia; and PDD, cases with long lasting parkinsonism who developed dementia after several years from the beginning of the parkinsonian symptoms, categorized neuropathologically as stage 6. Two regions, frontal cortex area 8 and the angular gyrus, both progressively involved along with disease duration, were analyzed in parallel.
Material and Methods
Human cases
Brain tissue was obtained from the Institute of Neuropathology HUB‐ICO‐IDIBELL Biobank following the guidelines of Spanish legislation on this matter and the approval of the local ethics committee. Processing of brain tissue has been detailed elsewhere 40. The post‐mortem interval between death and tissue processing was between 2 and 21 h 45 min. One hemisphere was immediately cut in coronal sections, 1 cm thick, and selected areas of the encephalon were rapidly dissected, frozen on metal plates over dry ice, placed in individual air‐tight plastic bags and stored at −80°C until use for biochemical studies. The other hemisphere was fixed by immersion in 4% buffered formalin for 3 weeks for morphological studies. Neuropathological diagnosis in all cases was based on the routine study of 20 selected de‐waxed paraffin sections comprising different regions of the cerebral cortex, diencephalon, thalamus, brain stem and cerebellum, which were stained with hematoxylin and eosin, and Klüver–Barrera, and for immunohistochemistry for microglia, glial fibrillary acidic protein, β‐amyloid, phosphorylated tau (clone AT8), α‐synuclein, TDP‐43, ubiquitin and p62. Neuropathological staging of PD was based on the classification of Braak et al 8. Only typical cases according to the Braak classification—those with progressive involvement of the medulla oblongata, pons, substantia nigra, limbic system and neocortex—were included. Cases with combined pathologies (i.e., Alzheimer's disease excepting sporadic AD‐related pathology stages I–II/0–A 7, tauopathy, cerebrovascular diseases, and metabolic syndrome) were excluded from the present study. Middle‐aged cases (MA) (n = 34, 23 men, 11 women; age, 65.4 ± 14.8 years) had not suffered from neurologic, psychiatric, or metabolic diseases (including metabolic syndrome), and did not have abnormalities in the neuropathological examination excepting sporadic AD stages I–II/0–A. PD cases with more advanced stages of sAD‐related pathology were not considered in the present series to avoid overlap between PD and AD in the frontal cortex and angular gyrus.
Clinically, iPD cases (n = 15, 12 men, 3 women; age 69.6 ± 8.6) at stages 3 and 4 were apparently asymptomatic and were identified at the time of the post‐mortem neuropathological examination. PD cases (n = 20, 11 men, 9 women; age, 78.5 ± 4.4 years) at stages 5 and 6 had suffered from parkinsonism and had received treatment during the duration of the disease but did not have dementia. PDD cases (n = 4 men, age 80.5 ± 3.4 years), all of them stage 6, had suffered from parkinsonism for more than ten years and later developed dementia. The causes of death in these cases were unrelated events that reduced survival expectancy, including cardiac infarction, disseminated carcinoma and infectious diseases.
Two cortical regions were examined: frontal cortex area 8 and the angular gyrus. A summary of all the cases is shown in Table 1. Not all regions were assessed in every case because of the limited availability of tissues. This has reduced the possibility to study certain parameters as for example activity of mitochondrial complexes in iPD.
Table 1.
Summary of cases used for mRNA expression, western blot and mitochondrial activity studies in the frontal cortex area 8 (FC) and in the angular gyrus (AG). PD: Parkinson's disease, 0: Cases 1–34 are middle‐aged individuals with no neurological symptoms and without neuropathological evidence of disease; iPD: incidental PD (cases 35–49, stages 3, 4 of Braak without clinical symptoms of parkinsonism), PD: treated parkinsonism of long duration (cases 50–69, stages 5, 6 of Braak); PDD: PD with dementia (cases 70–73, stage 6 with long‐lasting parkinsonism and late development of dementia); M: male; F: female; Age in years; post‐mortem delay in hours and minutes; RIN: values of RNA integrity number; WB: western blot; MA: mitochondrial activity complexes.
| No case | PD | Gender | Age | PM delay | RIN FC | RIN AG | WB FC | WB AG | MA FC | MA AG |
|---|---|---|---|---|---|---|---|---|---|---|
| 1 | 0 | MALE | 64 | 8 h 30 m | 7.7 | 7.7 | X | X | – | – |
| 2 | 0 | MALE | 56 | 5 h | 7.8 | 6.8 | X | X | X | – |
| 3 | 0 | MALE | 67 | 5 h | 7.4 | 6.7 | X | X | – | – |
| 4 | 0 | MALE | 62 | 3 h | 8 | 6.8 | X | X | – | – |
| 5 | 0 | MALE | 52 | 4 h 40 m | 8.1 | 6.7 | X | X | – | – |
| 6 | 0 | MALE | 30 | 4 h 10 m | 8.4 | – | X | – | – | – |
| 7 | 0 | MALE | 53 | 3 h | 8.8 | 6.6 | X | X | X | – |
| 8 | 0 | FEMALE | 49 | 7 h | 8.2 | – | X | – | – | – |
| 9 | 0 | FEMALE | 75 | 3 h | 7.7 | 8.7 | X | X | – | – |
| 10 | 0 | FEMALE | 46 | 9 h 35 m | 6.8 | 6.8 | X | X | – | – |
| 11 | 0 | FEMALE | 86 | 4 h 15 m | 8.1 | – | X | – | – | – |
| 12 | 0 | FEMALE | 79 | 3 h 35 m | 7.7 | – | X | – | – | – |
| 13 | 0 | FEMALE | 79 | 6 h 25 m | 7.8 | – | X | – | – | – |
| 14 | 0 | FEMALE | 77 | 3 h 15 m | 7 | – | X | – | – | – |
| 15 | 0 | FEMALE | 76 | 5 h 45 m | 8.3 | – | – | – | – | – |
| 16 | 0 | FEMALE | 71 | 8 h 30 m | 7.4 | – | – | – | – | – |
| 17 | 0 | MALE | 56 | 5 h | 6.9 | – | – | X | – | X |
| 18 | 0 | FEMALE | 78 | 12 h | 6.5 | – | – | X | – | X |
| 19 | 0 | MALE | 71 | 3 h | – | – | – | X | – | X |
| 20 | 0 | MALE | 103 | 3 h | – | – | – | X | – | X |
| 21 | 0 | MALE | 59 | 4 h 15 m | – | – | – | – | – | X |
| 22 | 0 | MALE | 61 | 4 h 30 m | – | – | – | – | – | X |
| 23 | 0 | MALE | 70 | 13 h | – | – | – | – | X | – |
| 24 | 0 | MALE | 39 | 9 h 15 m | – | – | – | – | X | – |
| 25 | 0 | FEMALE | 64 | 2 h 15 m | – | – | – | – | X | – |
| 26 | 0 | MALE | 52 | 4 h 40 m | – | – | – | – | X | – |
| 27 | 0 | MALE | 79 | 7 h 45 m | 7.1 | – | – | – | – | – |
| 28 | 0 | MALE | 52 | 3 h 30 m | 8 | – | – | – | – | – |
| 29 | 0 | MALE | 51 | 4 h | 6.5 | – | – | – | – | – |
| 30 | 0 | MALE | 75 | 9 h | 6.6 | – | – | – | – | – |
| 31 | 0 | MALE | 58 | 4 h | 7.7 | – | – | – | – | – |
| 32 | 0 | MALE | 82 | 11 h | 6.6 | – | – | – | – | – |
| 33 | 0 | MALE | 73 | 7 h | 7.2 | – | – | – | – | – |
| 34 | 0 | MALE | 73 | 5 h 30 m | 7 | – | – | – | – | – |
| 35 | iPD | MALE | 57 | 11 h | 8.7 | 8.3 | X | X | – | – |
| 36 | iPD | FEMALE | 54 | 11 h 10 m | 8.2 | – | X | X | – | – |
| 37 | iPD | FEMALE | 70 | 10 h 50 m | – | 8.7 | – | X | – | – |
| 38 | iPD | MALE | 66 | 5 h | 7.3 | 7.3 | X | X | – | – |
| 39 | iPD | MALE | 72 | 5 h | 7.7 | – | – | – | – | – |
| 40 | iPD | MALE | 57 | 19 h | 7.6 | 7 | X | X | – | – |
| 41 | iPD | MALE | 76 | 4 h 30 m | 7.7 | 7.9 | X | X | – | – |
| 42 | iPD | MALE | 68 | 4 h 45 m | 7.3 | 8.5 | X | X | – | – |
| 43 | iPD | MALE | 79 | 9 h 15 m | 7.2 | – | X | X | – | – |
| 44 | iPD | MALE | 69 | 5 h 55 m | 6.4 | 7.6 | X | X | – | – |
| 45 | iPD | MALE | 68 | 9 h 20 m | 6.9 | – | – | – | – | – |
| 46 | iPD | MALE | 77 | 12 h | 6.9 | – | – | – | – | – |
| 47 | iPD | FEMALE | 84 | 4 h 30 m | 7.8 | – | – | – | – | – |
| 48 | iPD | MALE | 69 | 15 h 05 m | 8.1 | – | – | X | – | – |
| 49 | iPD | MALE | 78 | 10 h 45 m | 7.3 | – | – | – | – | – |
| 50 | PD | FEMALE | 70 | 4 h 30 m | 8.5 | – | X | – | X | – |
| 51 | PD | FEMALE | 77 | 3 h 30 m | 6.8 | – | X | – | – | – |
| 52 | PD | FEMALE | 81 | 6 h 30 m | 8.3 | – | X | – | – | – |
| 53 | PD | FEMALE | 69 | 4 h 30 m | 8 | – | X | – | – | – |
| 54 | PD | FEMALE | 79 | 3 h 30 m | 8 | – | X | – | X | – |
| 55 | PD | MALE | 78 | 13 h 30 m | 6.7 | – | – | – | – | – |
| 56 | PD | MALE | 83 | 14 h | 7.7 | – | – | – | – | – |
| 57 | PD | FEMALE | 77 | 7 h 30 m | 7.1 | – | – | – | X | – |
| 58 | PD | FEMALE | 84 | 4 h | 7.3 | 6.9 | – | – | X | X |
| 59 | PD | MALE | 76 | 12 h | 6.5 | – | – | – | X | – |
| 60 | PD | MALE | 78 | 13 h 30 m | 7.7 | – | – | – | X | – |
| 61 | PD | MALE | 83 | 14 h | 7 | – | – | – | X | – |
| 62 | PD | MALE | 76 | 21 h 45 m | 7.2 | 6.8 | – | – | X | X |
| 63 | PD | MALE | 79 | 4 h 30 m | 6.8 | 7.5 | – | – | X | X |
| 64 | PD | MALE | 77 | 7 h 30 m | 6.7 | 7 | – | – | X | X |
| 65 | PD | FEMALE | 78 | 4 h 30 m | – | 6.6 | – | X | – | X |
| 66 | PD | FEMALE | 79 | 1 h 30 m | – | 7.2 | – | X | – | X |
| 67 | PD | MALE | 76 | 4 h | – | 6.6 | – | X | – | X |
| 68 | PD | MALE | 84 | 4 h | – | 7.7 | – | X | – | X |
| 69 | PD | MALE | 87 | 7 h 30 m | – | 7.5 | – | X | – | X |
| 70 | PDD | MALE | 80 | 7 h 30 m | 7.2 | 6.6 | X | X | X | X |
| 71 | PDD | MALE | 82 | 16 h 30 m | 7.3 | 6.7 | X | X | X | X |
| 72 | PDD | MALE | 76 | 9 h 40 m | 6.8 | 6.4 | X | X | X | X |
| 73 | PDD | MALE | 84 | 16 h 30 m | 7.1 | 7.4 | X | X | X | X |
RNA purification
Purification of RNA from right frontal cortex area 8 and the angular gyrus was carried out using RNeasy Lipid Tissue Mini Kit (Qiagen, Hilden, Germany) following the protocol provided by the manufacturer and performing the optional DNase digest to avoid extraction and later amplification of genomic DNA. The concentration of each sample was obtained from A260 measurements with a NanoDrop 2000 spectrophotometer (Thermo Scientific, Waltham, MA, USA). RNA integrity was tested using the Agilent 2100 BioAnalyzer (Agilent, Santa Clara, CA, USA). Values of RNA integrity number (RIN) varied from 6.4 to 8.8 (Table 1). Post‐mortem delay had no effect on RIN values in the present series (Table 1).
Retrotranscription reaction
Retrotranscription reaction of RNA samples selected based on their RIN values was carried out with the High‐Capacity cDNA Archive kit (Applied Biosystems, Foster City, CA, USA) following the guidelines provided by the manufacturer, and using Gene Amp® 9700 PCR System thermocycler (Applied Biosystems). A parallel reaction for one RNA sample was processed in the absence of reverse transcriptase to rule out DNA contamination.
Real‐time PCR
Real‐time quantitative PCR (RT‐qPCR) assays were conducted in duplicate on 1,000ηg of cDNA samples obtained from the retrotranscription reaction, diluted 1:20 in 384‐well optical plates (Kisker Biotech, Steinfurt, GE) utilizing the ABI Prism 7900 HT Sequence Detection System (Applied Biosystems). Parallel amplification reactions were carried out using 20× TaqMan Gene Expression Assays and 2× TaqMan Universal PCR Master Mix (Applied Biosystems). TaqMan probes used in the study are shown in Table 2.
Table 2.
Abbreviated and full names of genes, and TaqMan probes used for the study of mRNA expression including housekeeping genes GUS‐β and XPNPEP1 used for normalization.
| Gene | Gene name | Reference | ||
|---|---|---|---|---|
| Housekeeping genes | GUS‐B | β‐glucuronidase | Hs00939627_m1 | |
| XPNPEP1 | X‐prolyl aminopeptidase (aminopeptidase P) 1 | Hs00958026_m1 | ||
| Mitochondrial subunits | Complex I | NDUFA2 | NADH dehydrogenase (ubiquinone) 1 alpha subcomplex, 2, 8 kDa | Hs00159575_m1 |
| NDUFA7 | NADH dehydrogenase (ubiquinone) 1 alpha subcomplex, 7, 14.5 kDa | Hs01561430_m1 | ||
| NDUFA10 | NADH dehydrogenase (ubiquinone) 1 alpha subcomplex, 10, 42 kDa | Hs01071117_m1 | ||
| NDUFB3 | NADH dehydrogenase (ubiquinone) 1 beta subcomplex, 3, 12 kDa | Hs00427185_m1 | ||
| NDUFB7 | NADH dehydrogenase (ubiquinone) 1 beta subcomplex, 7, 18 kDa | Hs00188142_m1 | ||
| NDUFB10 | NADH dehydrogenase (ubiquinone) 1 beta subcomplex, 10, 22 kDa | Hs00605903_m1 | ||
| NDUFS7 | NADH dehydrogenase (ubiquinone) Fe‐S protein 7, 20 kDa (NADH‐coenzyme Q reductase) | Hs00257018_m1 | ||
| NDUFS8 | NADH dehydrogenase (ubiquinone) Fe‐S protein 8, 23 kDa (NADH‐coenzyme Q reductase) | Hs00159597_m1 | ||
| Complex II | SDHB | Succinate dehydrogenase complex, subunit B, iron sulfur (Ip) | Hs00268117_m1 | |
| Complex III | UQCRB | Ubiquinol‐cytochrome c reductase binding protein | Hs00559884_m1 | |
| UQCR11 | Ubiquinol‐cytochrome c reductase, complex III subunit XI | Hs00907747_m1 | ||
| Complex IV | COX7A2L | Cytochrome c oxidase subunit VIIa polypeptide 2 like | Hs00190880_m1 | |
| COX7C | Cytochrome c oxidase subunit VIIc | Hs01595220_g1 | ||
| Complex V | ATP5D | ATP synthase, H+ transporting, mitochondrial F1 complex, delta subunit | Hs00961521_m1 | |
| ATP5G2 | ATP synthase, H+ transporting, mitochondrial Fo complex, subunit C2 (subunit 9) | Hs01096582_m1 | ||
| ATP5H | ATP synthase, H+ transporting, mitochondrial Fo complex, subunit d | Hs01046892_gH | ||
| ATP5L | ATP synthase, H+ transporting, mitochondrial Fo complex, subunit G | Hs00538946_g1 | ||
| ATP5O | ATP synthase, H+ transporting, mitochondrial F1 complex, O subunit | Hs00426889_m1 | ||
| Energy metabolism‐related enzymes | ATP2B3 | ATPase, Ca++ transporting, plasma membrane 3 | Hs00222625_m1 | |
| ATP2B4 | ATPase, Ca++ transporting, plasma membrane 4 | Hs00608066_m1 | ||
| ATP4A | ATPase, H+/K+ exchanging, alpha polypeptide | Hs00167575_m1 | ||
| ATP6V0A1 | ATPase, H+ transporting, lysosomal V0 subunit a1 | Hs00193110_m1 | ||
| ATP6V0B | ATPase, H+ transporting, lysosomal 21 kDa, V0 subunit b | Hs01072388_m1 | ||
| ATP6V1H | ATPase, H+ transporting, lysosomal 50/57 kDa, V1 subunit H | Hs00977530_m1 | ||
| FAM82A2 | Family with sequence similarity 82, member A2 | Hs00216746_m1 | ||
| LHPP | Phospholysine phosphohistidine inorganic pyrophosphate phosphatase | Hs00383379_m1 | ||
| SLC6A6 | Solute carrier family 6 (neurotransmitter transporter, taurine), member 6 | Hs00161778_m1 | ||
| SLC25A31 | Solute carrier family 25 (mitochondrial carrier; adenine nucleotide translocator), member 31 | Hs00229864_m1 | ||
| TOMM40 | Translocase of outer mitochondrial membrane 40 homolog (yeast) | Hs01587378_mH | ||
| ZNF642 | Zinc finger protein 642 | Hs01372953_m1 | ||
Parallel assays for each sample were carried out using probes for β‐glucuronidase (GUS‐β) and X‐prolyl aminopeptidase P1 (XPNPEP1) for normalization. The reactions were performed using the following parameters: 50°C for 2 min, 95°C for 10 min, 40 cycles at 95°C for 15 s and 60°C for 1 min. TaqMan PCR data were captured using the Sequence Detection Software (SDS version 2.2, Applied Biosystems). Subsequently, threshold cycle (CT) data for each sample were analyzed with the double delta CT (ΔΔCT) method. First, delta CT (ΔCT) values were calculated as the normalized CT values for each target gene in relation to the endogenous controls GUS‐β and XPNPEP1. These housekeeping genes were selected because they show no modifications in several neurodegenerative diseases in human post‐mortem brain tissue 2, 16. A similar pattern was observed using GUS‐β and XPNPEP1 for normalization (data not shown). GUS‐β was selected as a housekeeping gene for representation. Finally, ΔΔCT values were obtained with the ΔCT of each sample minus the mean ΔCT of the population of control samples (calibrator samples). The fold‐change was determined using the equation 2−ΔΔCT 20.
Statistical analysis for RT‐qPCR
The normality of distribution of the mean fold‐change values obtained by RT‐qPCR for every region and stage between controls and PD cases was analyzed with the Kolmogorov–Smirnov test. The non‐parametric Mann–Whitney test was performed to compare each group when the samples did not follow a normal distribution whereas the unpaired Student's T‐test was used for normal variables. Statistical analysis was performed with GraphPad Prism version 5.01 (La Jolla, CA, USA) and Statgraphics Statistical Analysis and Data Visualization Software version 5.1 (Warrenton, VA, USA). Differences between groups were considered statistically significant at P‐values: *P < 0.05, **P < 0.01 and ***P < 0.001.
Gel electrophoresis and western blotting from total homogenates
About 0.1 g of sample brain tissue from frontal cortex area 8 and the angular gyrus (see Table 1) were homogenized with a glass homogenizer in Mila lysis buffer (0.5 M Tris at pH 7.4 containing 0.5 methylenediaminetetraacetic acid at pH 8.0, 5 M NaCl, 0.5% Na doxicholic, 0.5% Nonidet P‐40, 1 mM phenylmethylsulfonyl fluoride, bi‐distilled water, protease and phosphatase inhibitor cocktails) (Roche Molecular Systems, Pleasanton, CA, USA), and then centrifuged for 15 min at 13 000 rpm at 4°C (Ultracentrifuge Beckman with 70Ti rotor, CA, USA). Protein concentration was measured with a SmartspectTMplus spectrophotometer (Bio‐Rad, CA, USA) using the Bradford method (Merck, Darmstadt, Germany). Samples containing 20 μg of protein and the standard Precision Plus ProteinTM Dual Color (Bio‐Rad) were loaded onto 10%–15% acrylamide gels. Proteins were separated in sodium dodecylsulfate‐polyacrylamide gel electrophoresis (SDS‐PAGE) and electrophoretically transferred to nitrocellulose membranes using the Trans‐Blot®TurboTM transfer system (Bio‐Rad) at 200 mA/membrane for 40 min. Non‐specific bindings were blocked by incubation in 5% milk in Tris‐buffered saline (TBS) containing 0.1% Tween for 1 h at room temperature. After washing, the membranes were incubated at 4°C overnight with each of the following antibodies in TBS containing 5% albumin and 0.1% Tween: monoclonal antibody anti‐cytochrome c oxidase subunit VIIa polypeptide 2 like, COX7A2L (1:800; 66062‐1‐Ig, Proteintech, Chicago, IL, USA); polyclonal antibodies anti‐NADH dehydrogenase (ubiquinone) 1 alpha subcomplex 7, NDUFA7 (1:100; 15300‐1‐AP, Proteintech); anti‐NADH dehydrogenase (ubiquinone) 1 alpha subcomplex 10, NDUFA10 (1:2000; GTX114572, GeneTex, CA, USA); anti‐NADH dehydrogenase (ubiquinone) 1 beta subcomplex 10, NDUFB10 (1:3000; 15589‐1‐AP, Proteintech), anti‐NADH dehydrogenase (ubiquinone) Fe‐S protein 8, NDUFS8 (1:1000; GTX114119, GeneTex) and anti‐MT‐ND1: mitochondrial encoded NADH dehydrogenase 1 (1:1000; ab181848, Abcam, Cambridge, UK). Finally, monoclonal antibody anti‐β‐actin (1:30 000, A5316; Sigma‐Aldrich, St. Louis, MO, USA) was blotted for the control of protein loading. Afterward, the membranes were incubated for 1 h with the appropriate HRP‐conjugated secondary antibody (1:2000, Dako, Glostrup, Denmark), and the immune‐complexes were revealed with a chemiluminescence reagent (ECL, Amersham, GE Healthcare, Buckinghamshire, UK). Densitometry of western blot bands was assessed with the TotalLab program (TotalLab Quant, Newcastle, UK) and subsequently analyzed with Student's T‐test using the Statgraphics Statistical Analysis and Data Visualization Software version 5.1 (VA, USA); differences were considered statistically significant with P‐values: *P < 0.05; **P < 0.01; ***P < 0.001.
Isolation of mitochondrial‐enriched fractions from human brain tissue
Mitochondria were extracted from frozen human brain tissue (100 mg) under ice‐cold conditions. Tissues were minced in ice‐cold isolation buffer (IB) containing 0.25 M sucrose, 10 mmol/L Tris and 0.5 mmol/L EDTA, pH 7.4, and then homogenized and centrifuged at 1000 × g for 10 min. Samples were homogenized with a micro‐pestle using 10 volumes of buffer per mg of tissue and centrifuged at 1000 × g for 10 min at 4°C. The supernatant (S1) was conserved. The pellet was washed with 2 volumes of IB and centrifuged again under the same conditions. This last supernatant (S2) was combined with S1. Centrifugation at 10 000 × g for 10 min at 4°C resulted in the mitochondria‐enriched pellet. The supernatant (S3) was discarded and the pellet was washed with 2 volume of IB. The pellet was finally re‐suspended in 1 volume of IB and stored at −80°C. Protein concentration was measured by SmartspectTMplus spectrophotometer (Bio‐Rad, CA, USA) using the Bradford method (Merck, Darmstadt, Germany). Sonication was performed as described 30. Optimal sonication conditions were 10 sec 8 times with minimal intervals at 3W 44. The mitochondrial enrichment was used for mitochondrial enzymatic activities and for western blotting using anti‐α‐synuclein polyclonal antibody (1:10 000; A5316, Chemicon, Darmstadt, Germany); anti‐neuroketal (NKT, 1:1000; AB5611, Chemicon); and anti N‐Tyrosine (N‐Tyr, 1:500, 32‐1900, Thermo Fisher—Invitrogen, Carlsbad, CA, USA). Differences in protein loading were corrected with anti‐β‐actin (1:30 000, A5316; Sigma‐Aldrich); mitochondrial levels were assessed with anti‐oxidative phosphorylation‐ATP5A (1:10 000; MS601, Mitoscience, Eugene, OR, USA).
Mitochondrial enzymatic activities
The individual activities of mitochondrial complexes I, II, III, IV and V were analyzed using commercial kits following the manufacturers' instructions (Mitochondrial complex I, II, IV and V: Novagen, Merck Biosciences, Darmstadt, Germany; Mitochondrial complex III: MyBiosource, CA, USA). About 25 μg of mitochondria was loaded into each well. Activity of citrate synthase was evaluated following validated protocols 42 with slight modifications. The activity of citrate synthase was determined as the rate of reduction of DTNB [5′,5′‐dithiobis (2‐nitrobenzoic acid)] to thionitrobenzoic acid at 412 nm. For this purpose, 25 μg of mitochondria was added to a 1 mL mixture containing 500 μL of Tris (200 mM, pH8.0) with Triton X‐100 [0.2% (vol/vol)], 100 μL of DTNB, and 30 μL of 10 mM Acetyl CoA; the final volume was adjusted to 950 μL with distilled water. The reaction was started by the addition of 50 μL of 10 mM oxalacetic acid. The increase in absorbance at 412 nm was read for 3 min at room temperature with a DU® 800UV/Visible spectrophotometer (Beckman Coulter, CA, USA) in 1 mL polystyrene or methacrylate cuvettes.
Statistical analysis for mitochondrial activities
The enzymatic activities for each mitochondrial complex were expressed as a rate of nmol/min/mg of mitochondrial protein per protein concentration normalized with the mitochondrial complex activity rate of citrate synthase activity. Data were presented as mean ± standard error of the mean (SEM) in all the experiments. All the data were analyzed with Student's T‐test using GraphPad Prism version 5.01 (La Jolla, CA, USA) and Statgraphics Statistical Analysis and Data Visualization Software version 5.1 (Warrenton, VA, USA). In all experimental procedures the significance level was set at *P < 0.05; **P < 0.01; ***P < 0.001.
Results
mRNA expression levels of selected mitochondrial subunits in frontal cortex area 8
No differences in the expression levels of the majority of assessed genes were observed in iPD when compared with MA excepting NDUFB3 and ATP5H, which decreased in iPD (Table 3). However, a significant increase in the expression of NDUFA7, NDUFA10, NDUFB7, NDUFB10, NUDFS8, SDHB, UQCR11, COX7A2L and ATP5G2 mRNAs was found in PD compared with MA individuals. NDUFA2, NDUFA7, NDUFA10, NDUFB3, ATP5G2, ATP5H and ATP5L were significantly increased when comparing PD with iPD (Table 3). Two genes deregulated in arrays, NDUFS7 and ATP5G2, were not validated by RT‐qPCR.
Table 3.
Summary of mRNA expression levels of genes encoding subunits of the mitochondrial complexes and energy metabolism‐related enzymes in the frontal cortex in MA, iPD, PD and PDD. Up‐regulated gene expression occurs in PD 5–6 when compared with MA and PD 3–4. However, important decay in gene expression is observed in PDD when compared with PD. Student's T‐test *P < 0.05, **P < 0.01, ***P < 0.001. †No Gaussian distribution (Mann–Whitney test *P < 0.05, **P < 0.01, ***P < 0.001.
| Frontal cortex | |||||||
|---|---|---|---|---|---|---|---|
| MA vs. PD 3–4 | MA vs. PD 5–6 | PD 3–4 vs. PD 5–6 | MA vs. PDD | PD 3–4 vs. PDD | PD 5–6 vs. PDD | ||
| Mitochondrial elements | |||||||
| Complex I | NDUFA2 | – | – | ↑* | – | – | – |
| NDUFA7 | – | ↑** | ↑** | – | – | ↓** | |
| NDUFA10 | – | ↑** | ↑* | – | – | ↓* | |
| NDUFB3 | ↓* | – | ↑** | – | – | – | |
| NDUFB7 | – | ↑* | – | – | – | ↓* | |
| NDUFB10 | – | ↑* | – | – | – | ↓* | |
| NDUFS8 | – | ↑* | – | – | – | ↓* | |
| Complex II | SDHB | – | ↑* | – | ↓* | – | ↓* |
| Complex III | UQCRB | – | – | – | – | – | ↓* |
| UQCR11 | – | ↑* | – | – | – | – | |
| Complex IV | COX7A2L | – | ↑* | – | – | – | ↓** |
| COX7C | – | – | – | ↓* | – | ↓* | |
| Complex V | ATP5G2 | – | ↑* | ↑* | ↓* | – | ↓** |
| ATP5H | ↓** | – | ↑** | – | – | – | |
| ATP5L | – | – | ↑* | – | – | ↓** | |
| ATP5O | – | – | – | – | – | ↓* | |
| Energy metabolism‐related molecules | |||||||
| ATP2B4 | ↓* | – | ↑** | ↓* | – | ↓* | |
| ATP4A | ↑* | – | ↑** | – | – | – | |
| ATP6V0A1 | – | – | ↑** | – | – | ↓* | |
| ATP6V0B | ↓** | – | ↑** | ↓** | – | ↓* | |
| ATP6V1H | – | – | – | – | – | ↓** | |
| FAM82A2 | – | – | – | ↓* | – | – | |
| LHPP | – | – | – | ↓* | – | – | |
| TOMM40 | ↓* | – | ↑* | – | – | – | |
| ZNF642 | – | ↑** | ↑*** | – | – | ↓** | |
In contrast to PD, a marked decrease in the expression of genes encoding several subunits of mitochondrial complexes was found in PDD. Significant down‐regulation in SDHB, COX7C and ATP5G2 was observed when comparing MA cases to PDD. More dramatic change was recognized when comparing PD and PDD, as the expression of twelve of the eighteen genes analyzed was significantly decreased in PDD, including NDUFA7, NDUFA10, NDUFB7, NDUFB10, NDUFS8, SDHB, UQCRB, COX7A2L, COX7C, ATP5G2, ATP5L and ATP5O (Table 3). Values were similar using GUS‐β and XPNPEP1 for normalization but GUS‐β was selected as housekeeping for representation.
mRNA expression levels of energy metabolism‐related enzymes in frontal cortex area 8
ATP2B4, AT6V0A1 and TOMM40 were significantly decreased and ATP4A increased in iPD when compared with MA. ZNF642 was up‐regulated in PD when compared with MA. However, the expression levels of ATP2B4, ATP4A, ATP6V0A1, ATP6VOB, TOMM40 and ZNF642 mRNAs were significantly increased in PD when compared with iPD (Table 3).
In contrast to PD cases, a marked decrease in the expression of genes related to energy metabolism was found in PDD. ATP2B4, ATP6V0B, FAM82A2 and LHPP mRNA expression was significantly reduced in PDD when compared with MA. ATP2B4, ATP6V0A1, ATP6V0B, ATP6V1H and ZNF642 were down‐regulated in PDD in comparison with PD (Table 4).
Table 4.
Summary of mRNA expression levels of genes encoding subunits of the mitochondrial complexes and energy metabolism‐related enzymes in the angular gyrus in MA, iPD, PD and PDD. Up‐regulated gene expression occurs in PD 3–4 when compared with MA. However, important decay in gene expression is observed in PD 5–6 and PDD when compared with PD 3–4. Student's T‐test *P < 0.05, **P < 0.01, ***P < 0.001. †No Gaussian distribution (Mann–Whitney test *P < 0.05, **P < 0.01, ***P < 0.001.
| Angular gyrus | |||||||
|---|---|---|---|---|---|---|---|
| MA vs. PD 3–4 | MA vs. PD 5–6 | PD 3–4 vs. PD 5–6 | MA vs. PDD | PD 3–4 vs. PDD | PD 5–6 vs. PDD | ||
| Mitochondrial elements | |||||||
| Complex I | NDUFA2 | – | – | – | – | ↓* | – |
| NDUFA7 | ↑** | – | ↓*** | – | ↓** | – | |
| NDUFA10 | ↑* | ↑* | – | – | ↓* | – | |
| NDUFB3 | – | – | – | – | – | – | |
| NDUFB7 | – | – | – | – | – | – | |
| NDUFB10 | ↑* | – | ↓** | – | ↓** | – | |
| NDUFS7 | ↑* | – | ↓** | – | ↓** | – | |
| NDUFS8 | – | – | ↓* | – | – | – | |
| Complex II | SDHB | – | – | – | – | ↓* | – |
| Complex III | UQCRB | ↑* | – | – | – | – | – |
| UQCR11 | ↑* | – | – | – | ↓* | – | |
| Complex IV | COX7A2L | ↑* | – | ↓** | – | ↓** | ↓** |
| COX7C | – | – | – | – | – | – | |
| Complex V | ATP5D | ↑* | – | – | – | – | – |
| ATP5G2 | ↑* | – | – | – | ↓* | – | |
| ATP5H | – | – | – | – | – | – | |
| ATP5L | – | – | – | – | – | – | |
| ATP5O | – | – | – | – | ↓* | – | |
| Energy metabolism‐related molecules | |||||||
| ATP2B3 | – | – | – | – | – | – | |
| ATP2B4 | – | – | – | ↓* | ↓* | ↓*** | |
| ATP4A | – | – | – | – | – | – | |
| ATP6V0A1 | – | – | – | – | – | – | |
| ATP6V0B | ↑** | – | ↓** | – | ↓* | – | |
| ATP6V1H | ↑*** | – | ↓*** | – | ↓*** | ↓** | |
| FAM82A2 | – | – | – | ↓* | – | ↓** | |
| LHPP | – | – | – | ↓* | – | ↓** | |
| SLC6A6 | – | – | – | – | ↓* | – | |
| SLC25A31 | – | – | – | – | – | – | |
| TOMM40 | – | – | – | – | – | – | |
| ZNF642 | – | – | – | – | ↓** | – | |
Detailed quantitative data are shown in Supporting Information Table I.
mRNA expression levels of selected mitochondrial subunits in the angular gyrus
NDUFA7, NDUFA10, NDUFB10, NDUFS7, UQCRB, UQCR11, COX7A2L, ATP5D and ATP5G2 mRNA expression was up‐regulated in iPD when compared with MA (Table 4). However, only NDUFA10 mRNA levels were increased when comparing PD with MA cases (Table 4). This was because of a shift between iPD and PD as NDUFA7, NDUFB10, NDUFS7, NDUFS8 and COX7A2L were significantly decreased in PD when compared with iPD (Table 4).
Interestingly, no apparent changes were found in PDD when compared with MA cases. However, NDUFA2, NDUFA7, NDUFA10, NDUFB10, NDUFS7, SDHB, UQCR11, COX7A2L, ATP5G2 and AT5O were significantly down‐regulated in PDD when compared with iPD. COX7A2L mRNA was decreased in PDD when compared with PD (Table 4).
Detailed quantitative data are shown in Supporting Information Table I.
mRNA expression levels of energy metabolism‐related enzymes in the angular gyrus
Two genes out of twelve, ATP6V0B and ATP6V1H1, encoding energy metabolism‐related enzymes assessed in the present study were up‐regulated in iPD when compared with PD (Table 4). No significant differences were observed in PD when compared with MA. However, ATP6V0B and ATP6V1H1 were significantly reduced in PD when compared with iPD (Table 4).
Gene expression was markedly decreased in PDD cases when compared with MA, iPD and PD. ATP2B4, FAM82A2 and LHPP were down‐regulated when comparing MA with PDD. ATP2B4, ATP6V0B, ATP6V1H, SLC6A6 and ZNF642 were decreased in PDD cases compared with iPD. ATP2B4, ATP6V1H, FAM82A2 and LHPP were significantly down‐regulated in PDD in comparison with PD (Table 4).
Protein expression levels of selected subunits of mitochondrial complexes in frontal cortex area 8 and angular gyrus in iPD, PD and PDD
Western blot was carried out using antibodies to proteins NADH dehydrogenase (ubiquinone) 1 alpha sub‐complex, 7 (encoded by NDUFA7), NADH dehydrogenase (ubiquinone) 1 alpha sub‐complex, 10 (encoded by NDUFA10), NADH dehydrogenase (ubiquinone) 1 beta sub‐complex 10 (encoded by NDUFB10), NADH dehydrogenase (ubiquinone) Fe‐S protein 8 (encoded by NDUFS8) and cytochrome c oxidase subunit VIIa polypeptide 2 (encoded by COX7A2L). Expression levels were normalized with β‐actin and VDAC.
NDUFA7 was significantly decreased in the frontal cortex in iPD in comparison with MA cases, but significantly increased in PD when compared with iPD. NDUFS8 was significantly increased in PD when compared with MA (Figure 1A). NDUFA7 and NDUFS8 protein levels matched corresponding mRNA values (Table 3). No variations of NDUFA10, NDUFB10 and COX7A2L protein levels were observed in the frontal cortex in iPD or PD compared with MA (Figure 1A). However, significant decrease in the expression levels of proteins NDUFA7, NDUFB10, NDUFS8 and COX7A2L was found in frontal cortex area 8 in PDD cases (Figure 1A) matching with values of mRNA expression (Table 3).
Figure 1.
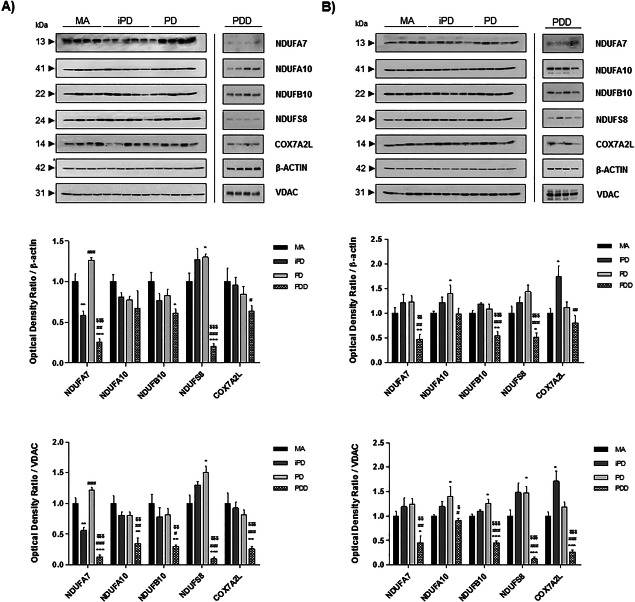
Representative western blots of NDUFA7, NDUFA10, NDUFB10, NDUFS8 and COX7A2L protein expression in frontal cortex area 8 (A) and the angular gyrus (B) in MA, iPD, PD and PDD. Expression values are normalized with β‐actin and VDAC. Graphs represent the total number of cases examined (see Table 1). Data are represented as mean ± SEM. Student's T‐test: *P < 0.05, **P < 0.01, ***P < 0.001, significant differences in iPD, PD or PDD when compared with MA cases. # P < 0.05, ## P < 0.01, ### P < 0.001, differences between PD or PDD vs. iPD cases. $ P < 0.05, $$ P < 0.01, $$$ P < 0.001, observed differences when comparing PD to PDD individuals. aNo Gaussian distribution (Mann–Whitney test).
No modifications in NDUFA7, NDUFB10 and NDUFS8 protein expression levels were seen in the angular gyrus in iPD and PD. However, NDUFA10 was significantly increased in PD when compared with MA, and COX7A2L was significantly increased in iPD but not in PD when compared with MA (Figure 1B). NDUFA10, NDUFB10 and COX7A2L protein levels matched corresponding mRNA values obtained with RT‐qPCR (Table 4). Significant decrease in NDUFA7, NDUFA10, NDUFB10, NDUFS8 and COX7A2L protein levels occurred in the angular gyris in PDD (Figure 1B) matching with corresponding mRNA levels (Table 4).
Results were similar when using β‐actin and VDAC for normalization (Figure 1).
Protein expression levels of MT‐ND1 in frontal cortex area 8 and angular gyrus in iPD, PD and PDD
MT‐ND1 was assessed to test the expression level of a subunit encoded by mitochondrial DNA. Other antibodies tested to analyze the expression of mitochondrial subunits did not work in our hands.
Significant MT‐ND1 reduction was observed in frontal cortex in iPD and PDD when compared with MA using β‐actin or VDAC for normalization (Figure 2). Lack of significant differences in PD 5–6 when compared with the other groups was related to large individual variations in the expression levels in this group.
Figure 2.
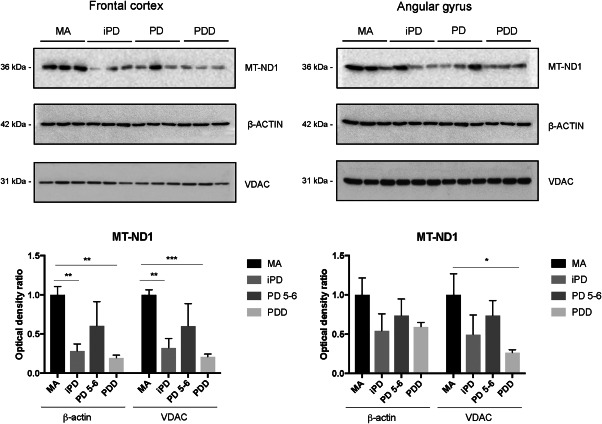
Representative western blots of MT‐ND1 protein expression in frontal cortex area 8 and angular gyrus in MA, iPD, PD and PDD. Expression values are normalized with β‐actin and VDAC. Graphs represent the total number of cases examined (see Table 1). Data are represented as mean ± SEM. Student's i‐test: *P < 0.05, **P < 0.01, ***P < 0.001.
Reduced MT‐ND1 was also observed in the angular gyrus when comparing PDD with MA using VDAC but not β‐actin for normalization (Figure 2).
Activity of mitochondrial complexes I, II, III, IV and V in frontal cortex area 8 and angular gyrus in PD
No modifications in the activity of complexes I, II and V were observed in frontal cortex area 8 in PD normalized with citrate synthase activity (Figure 3A). Activity of complex III was decreased in PD while complex IV showed the opposite pattern, with an increase in the same stages of the pathology; P‐values <0.05 (Figure 3A).
Figure 3.
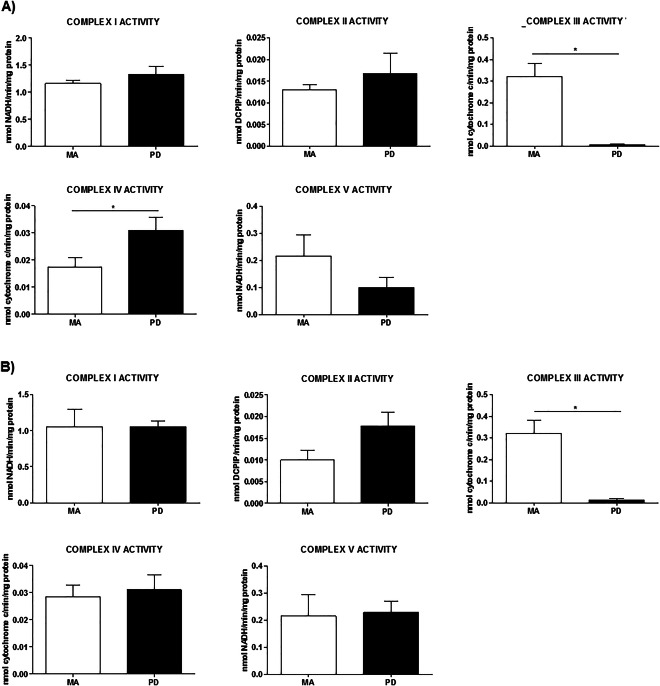
Enzyme activities of complexes I, II, III, IV and V normalized with citrate synthase activity in frontal cortex (A) and angular gyrus (B) in MA and PD. Activity of complex I, II and V is preserved in the frontal cortex in PD, whereas activity of complex II is decreased and activity of complex IV augmented. Enzymatic activities of complex I, II, IV and V are preserved in the angular gyrus but complex III activity is decreased in PD when compared with MA. Student's T‐test *P < 0.05, **P < 0.01, ***P < 0.001. aNo Gaussian distribution (Mann–Whitney test) *P < 0.05, **P < 0.01, ***P < 0.001.
Enzyme activities in the angular gyrus showed an equal pattern when comparing MA cases to PD with no variations except in complex III, which showed reduced activity with a significant P‐value <0.05 (Figure 3B). All the enzymatic activities of mitochondrial complexes were corrected for citrate synthase activity.
Activity of mitochondrial complexes I, II, III, IV and V in frontal cortex area 8 and angular gyrus in PDD
Mitochondrial enzymatic activities of complexes I, II, III and IV were markedly reduced in frontal cortex area 8 in PDD when compared with MA individuals (P‐values between 0.05 and 0.01) (Figure 4A).
Figure 4.
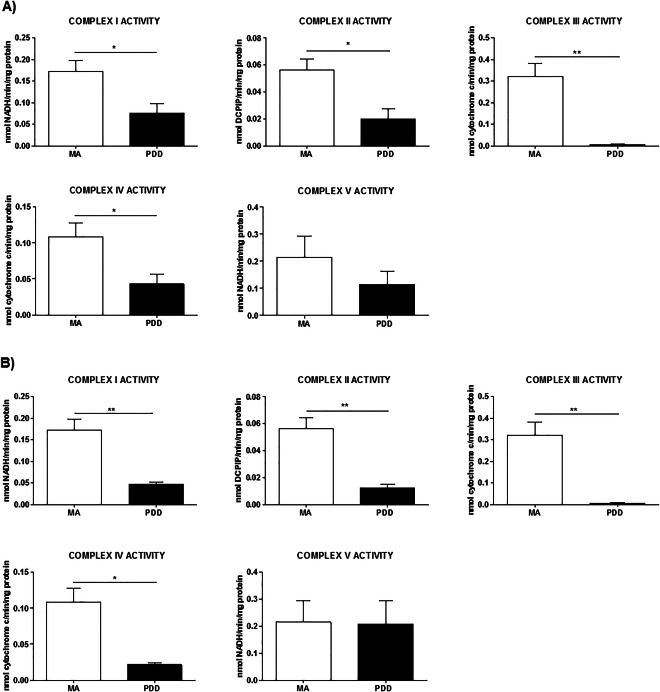
Enzyme activities of complexes I, II, III, IV and V normalized with citrate synthase activity in frontal cortex (A) and angular gyrus (B) in middle‐aged (MA) and PDD. Significantly decreased activity of complex I, II, III and IV is found in frontal cortex and angular gyrus (P‐values between 0.05 and 0.01) in PDD when compared with MA. Student's T‐test *P < 0.05, **P < 0.01, ***P < 0.001. aNo Gaussian distribution (Mann–Whitney test) *P < 0.05, **P < 0.01, ***P < 0.001.
Similar alterations were seen in the angular gyrus. A marked reduction in the activity of complexes I, II, II and IV was found in PDD when compared with MA (P‐values between 0.05 and 0.01) (Figure 4B).
α‐synuclein protein expression and NKT protein adduct levels in mitochondrial‐enriched fractions
Protein expression levels of α‐synuclein were analyzed with western blotting in mitochondrial‐enriched fractions of frontal cortex area 8 in MA and PD cases. Levels of monomeric α‐synuclein (17 kDa) were similar in MA and PD cases. However, protein levels of oligomeric forms of 37 kDa and 50 kDa of α‐synuclein were significantly increased in PD (P < 0.05) when compared with MA (Figure 5A). β‐actin was used as a control of protein loading, and ATP5A as a marker of mitochondria, revealing no differences between MA and PD.
Figure 5.
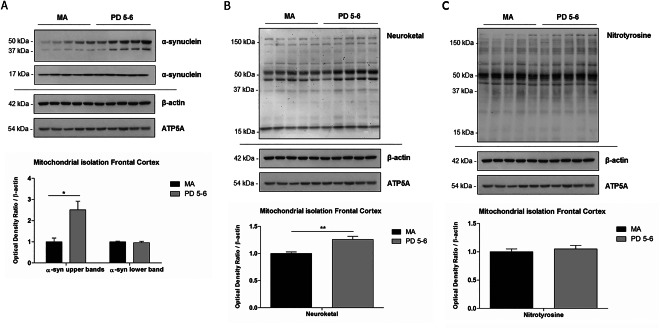
Western blot of mitochondrial‐enriched fractions in frontal cortex (FC) in MA cases and PD. (A) No differences in protein expression levels of monomeric α‐synuclein 17 kDa are seen between MA and PD. However, significant expression of oligomeric α‐synuclein of 37 and 50 kDa is found in PD when compared with MA. β‐actin is used as a marker of protein loading, and ATP5A as a mitochondrial marker. (B) Increased levels of neuroketal (NKT) protein adducts in mitochondrial‐enriched fractions in PD when compared with MA cases. (C) No significant differences of N‐Tyrosine levels are seen between the two groups. Student's T‐test *P < 0.05, **P < 0.01.
Levels of neuroketal (NKT) protein adducts were significantly increased (P < 0.01) in mitochondrial‐enriched fractions of frontal cortex area 8 in PD when compared with MA cases (Figure 5B). Levels of N‐Tyrosine were similar in mitochondrial‐enriched fractions of frontal cortex area 8 in PD when compared with MA cases (Figure 5C).
Discussion
Molecular studies in human post‐mortem brain tissue have revealed that metabolic alterations precede neurological symptoms in most neurodegenerative diseases by many years. In particular, multiple defects converge, at least in the frontal cortex, at early stages of PD even in the absence of deficits in cortical function 17, 18.
Expression of selected genomic genes encoding mitochondrial protein subunits of the respiratory chain complexes and the activities of complex I, II, III, IV and V was analyzed in frontal cortex area 8 and the angular gyrus in neuropathologically verified iPD, PD and PDD cases. The selection of genes was based on parallel studies carried out in several neurodegenerative diseases with abnormal protein aggregates in which the same genes were analyzed including several subunits of complex I–V. Although this approach does not cover all the mitochondrial subunits, it serves to analyze comparative studies among diseases with abnormal protein aggregates in old age. This aspect is founded on the hypothesis that although mitochondria are vulnerable in various neurodegenerative diseases, the alteration of subunits and susceptibility of complexes is disease‐dependent. The study of mitochondria is accompanied by gene expression analysis of other energy metabolism‐related enzymes.
Previous studies have shown reduced metabolism, as revealed with [(18)F]‐fluorodeoxyglucose Positron Emission Tomography (PET), in the frontal cortex, and progression to the angular gyrus, orbital cortex, posterior cingulus and occipital lobes in PD patients with mild cognitive impairment 5, 21, 31. Neuroimaging analyses have also suggested that cortical hypometabolism is present even at early stages of PD 4, 6. Interestingly, hypometabolism is followed by cortical atrophy in the same areas in PDD 24.
Present findings show regional differences in the expression of several nuclear genes encoding subunits of mitochondrial complexes and energy metabolism‐related enzymes. Most important changes in frontal cortex area 8 are manifested by up‐regulation of genes encoding subunits of complexes I, II, III, IV and V in PD when compared with MA, and energy‐metabolism related enzymes when comparing iPD with PD. In contrast, gene up‐regulation in the angular gyrus occurs in iPD when compared with MA, and values mostly return to normal levels in PD. Protein levels of selected subunits parallel values of corresponding gene expression. Therefore, altered regulation of genes and proteins related to mitochondria and energy metabolism is an early region‐dependent event in the frontal cortex area 8 and angular gyrus in PD. However, these alterations have only a moderate impact on the activity of mitochondrial complexes, as only complex III activity is reduced in the frontal cortex and angular gyrus in PD. These changes do not contradict the marked impairment of mitochondria biogenesis, altered mRNA expression, deregulation of several microRNAs predicted to interact with complex I regulators, and alterations of protein levels which also occur in frontal cortex in PD 43. Rather, they are consistent with a scenario in which several molecules, including mitochondrial membrane proteins, ion channels and mitochondrial subunits, are altered to determinate thresholds until they produce altered activity. In this line, oxidative damaged of certain protein subunits, rather than reduced protein levels, can jeopardize mitochondrial function in PD 29.
Dramatic changes occur in PDD as the expression of genes encoding mitochondrial subunits and energy‐related enzymes is markedly down‐regulated in frontal cortex area 8, whereas down‐regulation mainly involves energy‐related enzymes in the angular gyrus in PDD when compared with PD. Nevertheless, protein expression of several mitochondrial subunits falls in frontal cortex and angular gyrus in PDD. Differences between mRNA and protein expression levels are not uncommon as protein translation is modulated by several molecules mainly non‐coding RNAs. Changes in protein expression might be the result of mitochondrial loss although decreased protein values are similarly affected when using β‐actin and VDAC for normalization. Reduced mRNA expression here observed corresponds to nuclear‐encoded mRNAs therefore indicating that, at least, part of mitochondrial dysfunction in PD is linked to abnormalities in nuclear mRNA processing of genes encoding subunits of mitochondrial complexes.
Reduced complex I activity has been reported in frontal cortex area 8 at advanced stages of PD in which unfortunately no clinical information about their cognitive status was available 29, 35, 36, 37. More focused studies on PD and dementia have shown reduced complex I activity only in PDD, and not in PD 22. The present observations in PDD are in the same line although decreased activity affects not only complex I but also complexes I, II, III and IV. Moreover, reduced mitochondrial activity is not restricted to the frontal cortex; the angular gyrus, the other region assessed in the present study, has also mitochondrial functional deficiencies. Curiously, the expression of nuclear genes encoding subunits of mitochondrial complexes is dramatically reduced in the frontal cortex area 8, but not in the angular gyrus, in PDD, thus indicating regional differences in the transcription of nuclear genes encoding mitochondrial subunits between frontal cortex and angular gyrus.
Reduced mitochondrial DNA levels have been reported in the prefrontal cortex in PDD but not in PD, thus suggesting that primary alterations in mitochondrial DNA are causative of mitochondrial dysfunction and dementia in PDD 22. However, the expression of mitochondrial subunits encoded by mitochondrial DNA was not examined in that study. Present finds have shown decreased expression of MT‐ND1 in frontal cortex and angular gyrus in PDD cases when compared with MA. Moreover, MT‐ND1 expression appears to be significantly reduced in frontal cortex at least in some iPD cases. Since modifications in DNA content can vary in different mitochondria, and differ from one cell to another, it can be suggested that the expression levels of other subunits encoded by mitochondrial DNA can be also altered in PD.
Present findings have also shown the presence of α‐synuclein oligomers in mitochondrial‐enriched fractions in PD thus suggesting that local oligomers may affect mitochondrial function. In this line, abnormal α‐synuclein oligomers are detected in the nuclear fractions of FACS‐isolated neurons in frontal cortex in PD in association with marked alterations in the expression of genes and nuclear proteins involved in the machinery of protein synthesis 19. Moreover, increased levels of NKT protein adducts in mitochondrial‐enriched fractions point to increased protein damage derived from docosahexaenoic acid peroxidation end‐products (DHA; C22:6 ω3) 3.
These data together with previous studies suggest that the scenario is not simple as mitochondrial dysfunction in cerebral cortex and perhaps in other regions in PD may be because of the combination of altered nuclear and mitochondrial transcription which in turn may depend on the vulnerability of genomic and mitochondrial DNA, and in post‐translational modifications of mitochondrial subunits because of oxidative damage.
Finally, although the presence of Lewy bodies and neurites as revealed by PD stages seems to play a role in the progression of altered transcription and protein expression linked to mitochondria and energy metabolism, dementia is only observed at PD stage 6 in combination with failure in the activity of complexes I, II, III and IV of the respiratory chain in frontal cortex area 8 and angular gyrus.
Supporting information
Additional Supporting Information may be found in the online version of this article at the publisher's web‐site:
Table I. mRNA expression levels of genes encoding subunits of the mitochondrial complexes and energy metabolism‐related enzymes in the frontal cortex MA, iPD, PD and PDD as determined with TaqMan PCR assays using GUS‐β for normalization. Note marked differences in gene expression between MA and PD, mostly characterized by up‐regulated gene expression, and between PD and PDD, with dramatic down‐regulation of the majority of mitochondrial subunits assessed. Subunits are not limited to a single complex but members of all the mitochondrial complexes are affected in PDD. A more complex scenario occurs in the expression of other energy metabolism‐related enzymes at different stages of disease. However, important decay in gene expression is also observed in PDD when compared with PD. Student's T‐test *P < 0.05, **P < 0.01, ***P < 0.001. aNo Gaussian distribution (Mann–Whitney test *P < 0.05, **P < 0.01, ***P < 0.001.
Table II. mRNA expression levels of genes encoding subunits of the mitochondrial complexes and energy metabolism‐related enzymes in the angular gyrus in MA, iPD, PD and PDD as determined with TaqMan PCR assays using GUS‐β for normalization. A transient increase in the mRNA expression of several genes encoding subunits of complexes I, IV and V, and encoding energy metabolism‐related enzymes is observed in iPD when compared with MA. Although NDUFA10 mRNA expression remains increased in PD when compared with MA, a significant decrease of several genes is found in PD when compared with iPD. A dramatic decrease is found in PDD when compared with iPD. COX7A2L, ATP2B4, ATP6V1H and FAM82A2 mRNA expression is significantly decreased in PDD when compared with PD. Student's T‐test *P < 0.05, **P < 0.01, ***P < 0.001. aNo Gaussian distribution (Mann–Whitney test) *P < 0.05, **P < 0.01, ***P < 0.001.
Acknowledgments
This study was funded by the Seventh Framework Programme of the European Commission, grant agreement 278486: DEVELAGE and the Ministerio de Economía y Competitividad, Instituto de Salud Carlos III—Fondos FEDER, a way to build Europe FIS PIE14/00034 and PI14/00757; and CIBERNED: Rapid dementias. We wish to thank T. Yohannan for editorial assistance.
Financial disclosure and conflict of interests: No relevant data.
References
- 1. Alam ZI, Daniel SE, Lees AJ, Marsden DC, Jenner P, Halliwell B (1997) A generalized increase in protein carbonyls in the brain in Parkinson's disease but not in incidental Lewy body disease. J Neurochem 69:1326–1329. [DOI] [PubMed] [Google Scholar]
- 2. Barrachina M, Castaño E, Ferrer I (2006) TaqMan PCR assay in the control of RNA normalization in human post‐mortem brain tissue. Neurochem Int 49:276–284. [DOI] [PubMed] [Google Scholar]
- 3. Bernoud‐Hubac N, Davies SS, Boutaud O, Montine TJ, Roberts LJ (2001) Formation of highly reactive γ‐ketoaldehydes (neuroketals) as products of the neuroprostane pathway. J Biol Chem 276:30964–30970. [DOI] [PubMed] [Google Scholar]
- 4. Berti V, Polito C, Borghammer P, Ramat S, Mosconi L, Vanzi E et al (2012) Alternative normalization methods demonstrate widespread cortical hypometabolism in untreated de novo Parkinson's disease. Q J Nucl Med Mol Imaging 56:299–308. [PMC free article] [PubMed] [Google Scholar]
- 5. Bohnen NI, Koeppe RA, Minoshima S, Giordani B, Albin RL, Frey KA, Kuhl DE (2011) Cerebral glucose metabolic features of Parkinson disease and incident dementia: longitudinal study. J Nucl Med 52:848–855. [DOI] [PMC free article] [PubMed] [Google Scholar]
- 6. Borghammer P, Chakravarty M, Jonsdottir KY, Sato N, Matsuda H, Ito K et al (2010) Cortical hypometabolism and hypoperfusion in Parkinson's disease is extensive: probably even at early disease stages. Brain Struct Funct 214:303–317. [DOI] [PubMed] [Google Scholar]
- 7. Braak H, Braak E (1991) Neuropathological staging of Alzheimer‐related changes. Acta Neuropathol 82:239–259. [DOI] [PubMed] [Google Scholar]
- 8. Braak H, del Tredici K, Rüb U, de Vos RAI, Jansen Steur ENH, Braak E (2003) Staging of brain pathology related to sporadic Parkinson's disease. Neurobiol Aging 24:197–211. [DOI] [PubMed] [Google Scholar]
- 9. Choi J, Levey AI, Weintraub ST, Rees HD, Gearing M, Chin LS, Li L (2004) Oxidative modifications and down‐regulation of ubiquitin carboxyl‐terminal hydrolase L1 associated with idiopathic Parkinson's and Alzheimer's disease. J Biol Chem 279:13256–13264. [DOI] [PubMed] [Google Scholar]
- 10. Choi J, Rees HD, Weintraub ST, Levey AI, Chin LS, Li L (2005) Oxidative modifications and aggregation of Cu, Zn‐superoxide dismutase associated with Alzheimer and Parkinson diseases. J Biol Chem 280:11648–11655. [DOI] [PubMed] [Google Scholar]
- 11. Choi J, Sullards MC, Olzmann JA, Rees HD, Weintraub ST, Bostwick DE et al (2006) Oxidative damage of DJ‐1 is linked to sporadic Parkinson and Alzheimer diseases. J Biol Chem 281:10816–10824. [DOI] [PMC free article] [PubMed] [Google Scholar]
- 12. Dalfó E, Ferrer I (2008) Early α‐synuclein lipoxidation in neocortex in Lewy body diseases. Neurobiol Aging 29:408–417. [DOI] [PubMed] [Google Scholar]
- 13. Dalfó E, Portero‐Otín M, Ayala V, Martínez A, Pamplona R, Ferrer I (2005) Evidence of oxidative stress in the neocortex in incidental Lewy body disease. J Neuropathol Exp Neurol 64:816–830. [DOI] [PubMed] [Google Scholar]
- 14. Dickson DW, Fujishiro H, DelleDonne A, Menke J, Ahmed Z, Klos KJ et al (2008) Evidence that incidental Lewy body disease is pre‐symptomatic Parkinson's disease. Acta Neuropathol 115:437–444. [DOI] [PubMed] [Google Scholar]
- 15. Dickson DW, Uchikado H, Fujishiro H, Tsuboi Y (2010) Evidence in favor of Braak staging of Parkinson's disease. Mov Disord 25 Suppl 1:S78–S82. [DOI] [PubMed] [Google Scholar]
- 16. Durrenberger PF, Fernando FS, Magliozzi R, Kashefi SN, Bonnert TP, Ferrer I et al (2012) Selection of novel reference genes for use in the human central nervous system: a BrainNet Europe Study. Acta Neuropathol 124:893–903. [DOI] [PubMed] [Google Scholar]
- 17. Ferrer I (2009) Early involvement of the cerebral cortex in Parkinson's disease: convergence of multiple metabolic defects. Prog Neurobiol 88:89–103. [DOI] [PubMed] [Google Scholar]
- 18. Ferrer I, López‐Gonzalez I, Carmona M, Dalfó E, Pujol A, Martínez A (2012) Neurochemistry and the non‐motor aspects of PD. Neurobiol Dis 46:508–526. [DOI] [PubMed] [Google Scholar]
- 19. Garcia‐Esparcia P, Hernández‐Ortega K, Koneti A, Gil L, Delgado‐Morales R, Castaño E et al (2015) Altered machinery of protein synthesis is region‐ and stage‐dependent and is associated with α‐synuclein oligomers in Parkinson's disease. Acta Neuropathol Commun 3:76. [DOI] [PMC free article] [PubMed] [Google Scholar]
- 20. Garcia‐Esparcia P, Schlüter A, Carmona M, Moreno J, Ansoleaga B, Torrejón‐Escribano B et al (2013) Functional genomics reveals dysregulation of cortical olfactory receptors in Parkinson disease: novel putative chemoreceptors in the human brain. J Neuropathol Exp Neurol 72:524–539. [DOI] [PubMed] [Google Scholar]
- 21. Garcia‐Garcia D, Clavero P, Gasca Salas C, Lamet I, Arbizu J, Gonzalez‐Redondo R et al (2012) Posterior parietoccipital hypometabolism may differentiate mild cognitive impairment from dementia in Parkinson's disease. Eur J Nucl Med Mol Imaging 39:1767–1777. [DOI] [PubMed] [Google Scholar]
- 22. Gatt AP, Duncan OF, Attems J, Francis PT, Ballard CG, Bateman JM (2016) Dementia in Parkinson's disease is associated with enhanced mitochondrial complex I deficiency. Mov Disord 31:352–359. [DOI] [PubMed] [Google Scholar]
- 23. Gómez A, Ferrer I (2009) Increased oxidation of certain glycolysis and energy metabolism enzymes in the frontal cortex in Lewy body diseases. J Neurosci Res 87:1002–1013. [DOI] [PubMed] [Google Scholar]
- 24. González‐Redondo R, García‐García D, Clavero P, Gasca‐Salas C, García‐Eulate R, Zubieta JL et al (2014) Grey matter hypometabolism and atrophy in Parkinson's disease with cognitive impairment: a two‐step process. Brain 137:2356–2367. [DOI] [PMC free article] [PubMed] [Google Scholar]
- 25. Harish G, Mahadevan A, Srinivas Bharath MM, Shankar SK (2013) Alteration in glutathione content and associated enzyme activities in the synaptic terminals but not in the non‐synaptic mitochondria from the frontal cortex of Parkinson's disease brains. Neurochem Res 38:186–200. [DOI] [PubMed] [Google Scholar]
- 26. Hattingen E, Magerkurth J, Pilatus U, Mozer A, Seifried C, Steinmetz H et al (2009) Phosphorus and proton magnetic resonance spectroscopy demonstrates mitochondrial dysfunction in early and advanced Parkinson's disease. Brain 132:3285–3297. [DOI] [PubMed] [Google Scholar]
- 27. Jellinger KA (2009) A critical evaluation of current staging of alpha‐synuclein pathology in Lewy body disorders. Biochim Biophys Acta 1792:730–740. [DOI] [PubMed] [Google Scholar]
- 28. Jellinger KA (2011) Parkinson's disease. In: Neurodegeneration: The Molecular Pathology of Dementia and Movement Disorders, Dickson DW, Weller RO (eds), pp. 194–223. Wiley‐Blackwell: Oxford. [Google Scholar]
- 29. Keeney PM, Xie J, Capaldi RA, Bennett JP (2006) Parkinson's disease brain mitochondrial complex I has oxidatively damaged subunits and is functionally impaired and misassembled. J Neurosci 26:5256–5564. [DOI] [PMC free article] [PubMed] [Google Scholar]
- 30. Long J, Ma J, Luo C, Mo X, Sun L, Zang W, Liu J (2009) Comparison of two methods for assaying complex I activity in mitochondria isolated from rat liver, brain and heart. Life Sci 85:276–280. [DOI] [PubMed] [Google Scholar]
- 31. Lyoo CH, Jeong Y, Ryu YH, Rinne JO, Lee MS (2010) Cerebral glucose metabolism of Parkinson's disease patients with mild cognitive impairment. Eur Neurol 64:65–73. [DOI] [PubMed] [Google Scholar]
- 32. Martin LJ, Pan Y, Price AC, Sterling W, Copeland NG, Jenkins NA et al (2006) Parkinson's disease alpha‐synuclein transgenic mice develop neuronal mitochondrial degeneration and cell death. J Neurosci 26:41–50. [DOI] [PMC free article] [PubMed] [Google Scholar]
- 33. Martínez A, Portero‐Otin M, Pamplona R, Ferrer I (2010) Protein targets of oxidative damage in human neurodegenerative diseases with abnormal protein aggregates. Brain Pathol 20:281–297. [DOI] [PMC free article] [PubMed] [Google Scholar]
- 34. Mythri RB, Venkateshappa C, Harish G, Mahadevan A, Muthane UB, Yasha TC et al (2011) Evaluation of markers of oxidative stress, antioxidant function and astrocytic proliferation in the striatum and frontal cortex of Parkinson's disease brains. Neurochem Res 36:1452–1463. [DOI] [PubMed] [Google Scholar]
- 35. Navarro A, Boveris A (2009) Brain mitochondrial dysfunction and oxidative damage in Parkinson's disease. J Bioenerg Biomembr 41:517–521. [DOI] [PubMed] [Google Scholar]
- 36. Navarro A, Boveris A, Bández MJ, Sánchez‐Pino MJ, Gómez C, Muntané G, Ferrer I (2009) Human brain cortex: mitochondrial oxidative damage and adaptive response in Parkinson disease and in dementia with Lewy bodies. Free Radic Biol Med 46:1574–1580. [DOI] [PubMed] [Google Scholar]
- 37. Parker WD, Parks JK, Swerdlow RH (2008) Complex I deficiency in Parkinson's disease frontal cortex. Brain Res 1189:215–218. [DOI] [PMC free article] [PubMed] [Google Scholar]
- 38. Poon HF, Frasier M, Shreve N, Calabrese V, Wolozin B, Butterfield DA (2005) Mitochondrial associated metabolic proteins are selectively oxidized in A30P α‐synuclein transgenic mice – a model of familial Parkinson's disease. Neurobiol Dis 18:492–498. [DOI] [PubMed] [Google Scholar]
- 39. Power JHT, Blumbergs PC (2009) Cellular glutathione peroxidase in human brain: cellular distribution, and its potential role in the degradation of Lewy bodies in Parkinson's disease and dementia with Lewy bodies. Acta Neuropathol 117:63–73. [DOI] [PubMed] [Google Scholar]
- 40. Ravid R, Ferrer I (2012) Brain banks as key part of biochemical and molecular studies on cerebral cortex involvement in Parkinson's disease. febs J 279:1167–1176. [DOI] [PubMed] [Google Scholar]
- 41. Schapira AH (2008) Mitochondria in the aetiology and pathogenesis of Parkinson's disease. Lancet Neurol 7:97–109. [DOI] [PubMed] [Google Scholar]
- 42. Spinazzi M, Casarin A, Pertegato V, Salviati L, Angelini C (2012) Assessment of mitochondrial respiratory chain enzymatic activities on tissues and cultured cells. Nat Protoc 7:1235–1246. [DOI] [PubMed] [Google Scholar]
- 43. Thomas RR, Keeney PM, Bennett JP (2012) Impaired complex‐I mitochondrial biogenesis in Parkinson disease frontal cortex. J Parkinsons Dis 2:67–76. [DOI] [PubMed] [Google Scholar]
- 44. Zheng XX, Shoffner JM, Voljavec AS, Wallace DC (1990) Evaluation of procedures for assaying oxidative phosphorylation enzyme activities in mitochondrial myopathy muscle biopsies. Biochim Biophys Acta 1019:1–10. [DOI] [PubMed] [Google Scholar]
Associated Data
This section collects any data citations, data availability statements, or supplementary materials included in this article.
Supplementary Materials
Additional Supporting Information may be found in the online version of this article at the publisher's web‐site:
Table I. mRNA expression levels of genes encoding subunits of the mitochondrial complexes and energy metabolism‐related enzymes in the frontal cortex MA, iPD, PD and PDD as determined with TaqMan PCR assays using GUS‐β for normalization. Note marked differences in gene expression between MA and PD, mostly characterized by up‐regulated gene expression, and between PD and PDD, with dramatic down‐regulation of the majority of mitochondrial subunits assessed. Subunits are not limited to a single complex but members of all the mitochondrial complexes are affected in PDD. A more complex scenario occurs in the expression of other energy metabolism‐related enzymes at different stages of disease. However, important decay in gene expression is also observed in PDD when compared with PD. Student's T‐test *P < 0.05, **P < 0.01, ***P < 0.001. aNo Gaussian distribution (Mann–Whitney test *P < 0.05, **P < 0.01, ***P < 0.001.
Table II. mRNA expression levels of genes encoding subunits of the mitochondrial complexes and energy metabolism‐related enzymes in the angular gyrus in MA, iPD, PD and PDD as determined with TaqMan PCR assays using GUS‐β for normalization. A transient increase in the mRNA expression of several genes encoding subunits of complexes I, IV and V, and encoding energy metabolism‐related enzymes is observed in iPD when compared with MA. Although NDUFA10 mRNA expression remains increased in PD when compared with MA, a significant decrease of several genes is found in PD when compared with iPD. A dramatic decrease is found in PDD when compared with iPD. COX7A2L, ATP2B4, ATP6V1H and FAM82A2 mRNA expression is significantly decreased in PDD when compared with PD. Student's T‐test *P < 0.05, **P < 0.01, ***P < 0.001. aNo Gaussian distribution (Mann–Whitney test) *P < 0.05, **P < 0.01, ***P < 0.001.