

Abstract
The oxysterol 27‐hydroxycholesterol (27‐OHC) has been considered to play a key role in the pathogenesis of Alzheimer’s disease (AD). Because β‐amyloid peptide (Aβ) is the pathological hallmark of AD, the aim of this study is to verify whether 27‐OHC could lead to cognitive impairment through modulating Aβ accumulation and deposition. Regulation of Aβ metabolism was explored as the pathogenic mechanism of 27‐OHC. Furthermore, microRNAs (miRNAs) and their relations with 27‐OHC were also detected. In present study, matched case‐control study and APP/PS1 transgenic mice research were conducted. The results showed that the 27‐OHC and Aβ in plasma were increased in mild cognitive impairment patients, and a slight correlation was found between 27‐OHC and Aβ1‐40. This relationship was also proved by the research of APP/PS1 mice. More severe learning and memory impairment and higher Aβ1‐40 expression in brain and plasma were detected in the APP/PS1 mice of 27‐OHC treatment group. In addition, increased amyloid plaques were also found in the hippocampus of 27‐OHC‐treated mice. In order to find out the mechanism of 27‐OHC on regulating Aβ metabolism, the factors of Aβ production (APP, BACE1 and ADAM10), transport (LRP1 and RAGE) and elimination (NEP and IDE) were tested respectively. The gene and protein expressions of APP, BACE1 and RAGE were increased while LRP1 and IDE were decreased in the brain of 27‐OHC‐treated mice. At last, down‐regulated expression of miRNA let‐7g‐5p was found after 27‐OHC treatment. In conclusion, these findings suggested that excessive 27‐OHC could enhance the accumulation and deposition of Aβ both in brain and blood, resulting in a severe impairment of cognition, especially in the modulation of Aβ1‐40. The mechanism might be associated with the regulation of Aβ metabolism, and miRNA let‐7g‐5p was likely to play a vital role in this pathological process induced by 27‐OHC.
Keywords: 27‐hydroxycholesterol, Alzheimer’s disease, APP/PS1 mouse model, metabolism, mild cognitive impairment, β‐amyloid peptide
Abbreviations
- 24S‐OHC
24‐hydroxysterol
- 27‐OHC
27‐hydroxycholesterol
- AD
Alzheimer’s disease
- ADAM10
a disintegrin and metalloprotease 10
- ANS
anastrozone
- APP
amyloid precursor protein
- Aβ
β‐amyloid peptides
- BACE1
β‐site amyloid cleaving enzyme
- BBB
blood‐brain barrier
- FPG
fasting plasma glucose
- HDL‐C
high‐density lipoprotein cholesterol
- IDE
insulin‐degrading enzyme
- LDL‐C
low‐density lipoprotein cholesterol
- LRP1
low‐density lipoprotein receptor‐related protein
- MCI
mild cognitive impairment
- miRNAs
microRNAs
- MMSE
mini‐mental state examination
- MoCA
Montreal cognitive assessment
- MWM
Morris water maze
- NEP
neprilysin
- RAGE
receptor for advanced glycation end products
- TC
total cholesterol
- TG
triglycerides
Introduction
β‐amyloid pathology is a defining pathological hallmark of Alzheimer’s disease (AD). It is widely accepted that increased production and accumulation of β‐amyloid peptide (Aβ) is observed in mild cognitive impairment (MCI) which is the early stage of AD progression 4. Evidences have shown that cerebral deposition of Aβ could be detected in both MCI and AD patients 11, 21, 35. In recent studies, it has been reported that cholesterol‐oxygenated derivatives (oxysterols) play a remarkable role in the onset and progression of memory loss and cognitive impairment.
Oxysterols are oxygenated derivatives of cholesterol generated from exogenous (food) or endogenous (auto‐oxidation and enzymatic conversion) sources 52. They are essential for the normal physiology of the central nervous system, but oxysterols are also bioactive molecules that lead to adverse effects when they are overproduced in the human body. 27‐hydroxycholesterol (27‐OHC) and 24‐hydroxycholesterol (24S‐OHC) are recognized as the prominent kinds of oxysterols which can pass through the blood‐brain barrier (BBB). 27‐OHC is the most abundant circulating oxysterol and its plasma concentration approximately ranges from 53.7 to 247.9 ng/mL in healthy human subjects 36, 39. It is demonstrated that they have widespread pathological ramifications when they dramatically increased in plasma or in brain 26, 47, 50. In the last few years, our researches have also shown that the level of 27‐OHC in plasma is increased in patients of MCI. More interestingly, the higher concentration of 27‐OHC is accompanied by the elevation of Aβ1‐40 and Aβ1‐42 levels in plasma. Furthermore, fluctuations of 27‐OHC in plasma may be correlated with the cognitive capability of the elderly. However, the relation between oxysterols and Aβ needs to be further detected. Therefore, this is the first problem we need to focus on in the present study.
Disorder of Aβ expression in brain or plasma is believed to be the result of metabolic dysfunction. In this case, production, transport and elimination of Aβ may play key roles in Aβ pathology of MCI patients. While several studies including ours have manifested that the accumulation of Aβ in brain may be associated with the disturbance of 27‐OHC in brain and/or circulation 2, 19, 54, 57, the underling mechanisms in the correlation between oxysterols and Aβ are still unclear. The second aim of this study is to investigate the molecular mechanism of excessive oxysterols on regulating Aβ metabolism.
Moreover, recent researches have shown that the dysregulation of microRNAs (miRNAs) may link to Aβ accumulation in AD patients 29, 37 as well as in MCI patients 13, 15, 31, 51, 53. It is also demonstrated that the abnormity of miRNAs such as miR‐144‐3p and let‐7g‐5p could be found in both MCI and AD patients, but very few evidence could verify the correlation between miRNAs and oxysterols in MCI patients. In this study, we will conduct a preliminary exploration on it.
As mentioned above, we hypothesized that the expressions of 27‐OHC and 24S‐OHC are disordered in MCI patients. Cognitive impairment might be associated with excessive oxysterols which could lead to the accumulation and deposition of Aβ in brain and blood. The mechanism might be related to the dysfunction of Aβ metabolism including production, transportation and elimination. In addition, chip was used to find out the miRNAs which were related to MCI. Furthermore, we tried to explore the relationship between miRNAs and oxysterols. In order to achieve these goals, we tested the hypothesis in a matched case‐control study. Moreover, APP/PS1 transgenic mice were used to validate the results of population studies and to detect the molecular mechanisms.
Materials and Methods
Ethics statement
Human subjects were recruited from multi‐centers including hospitals and medical centers in Beijing, Shandong and Shanxi provinces of China. This study was conducted in accordance with the principles of the Declaration of Helsinki and ethically approved by the Ethics Committee of Capital Medical University (2013SY35). All subjects have signed the informed consent form before they were included in the study.
All animal experiments were approved by the Ethics Committee of Capital Medical University (Ethics: AEEI‐2014‐047) and conducted in accordance with ethical standards.
Human subjects
A total of 167 MCI patients and 167 age‐ (±5 years), sex‐ and education‐matched controls were recruited from 2014 to 2017. Full inclusion and exclusion criteria have been described in a previous study 22. MCI was diagnosed by neurologists based on cognitive screening tests of Mini‐Mental State Examination (MMSE) and Montreal Cognitive Assessment (MoCA). Full details of the diagnosis have been described elsewhere 49. Demographic, anthropometric and clinical characteristics were obtained by using a standard questionnaire. Peripheral blood samples were collected after fasting for 12 h and immediately centrifuged at 3500 rpm for 15 minutes to collect serum and plasma, then the samples were stored in −80°C until use.
Animals and experimental design
A total of 40 6‐month‐old male mice (10 C57BL/6J mice and 30 APP/PS1 transgenic mice with C57BL/6J background) were randomly divided into four groups (n = 10 per group): WT group (C57BL/6J mice), APP group (APP/PS1 mice), 27‐OHC group (APP/PS1 mice treated with 27‐OHC) and ANS group (APP/PS1 mice treated with anastrozole which is the inhibitor of 27‐OHC synthesis). These animals were purchased from Beijing Vital River Laboratory Animal Technology Company. The mice were kept in the animal house of Capital Medical University under controlled light conditions (12 h light/dark cycle), temperature (22°C ~ 25°C) and humidity (50% ~ 60%) with food and water ad libitum. Every effort was made to minimize the suffering of mice and to reduce the number of animals to be used.
All animals were fed a standard diet. After a 6‐week adaptation, mice in the 27‐OHC group and ANS group received a daily subcutaneous injection of 27‐OHC (5.5 mg/kg body weight) and anastrozole (0.2 mg/d) on the inner thighs, respectively; animals in the WT group and APP group received a subcutaneous injection of saline (0.2 mL/d) in the same parts. The treatment lasted for 21 days. Body weights were recorded before and after treatment. Animals were deeply anesthetized with 10% chloral hydrate (30 mL/kg body weight, injected intraperitoneally) at the end of the behavioral tests. Blood samples were immediately collected and centrifuged at 3500 × g for 8 minutes to collect plasma. Afterwards, mice were euthanized by decapitation. Fresh brain, liver, heart, kidney and spleen tissues were collected and weighed. The samples were frozen at −80°C until the determination of parameters.
Oxysterols detection and Aβ assessment in human and animal research
The oxysterols 27‐OHC and 24S‐OHC in plasma were measured by High‐Performance Liquid Chromatography‐Mass Spectrometry (HPLC‐MS) 20. Methods of oxysterol extraction from the brain tissue were developed based on previous reports 1, 12. Fifty milligrams of brain tissue was homogenized by ultrasonication in 2‐mL dichloromethane‐methanol mixture (1:1, v/v) which contained 200 ng 19‐hydroxycholesterol as internal standard. The samples were centrifuged at 5000 × g for 5 minutes, and then supernatants were collected and dried under a stream of nitrogen. Before analysis by HPLC‐MS, the samples were reconstituted immediately in 1 mL of methanol‐water mixture (9:1, v/v), centrifuged at 2400 × g for 15 minutes and the supernatants were collected into glass sample vials.
The concentrations of Aβ1‐40 and Aβ1‐42 in plasma and brain tissue were tested by ELISA Kits (Life technology) according to the manufacturer’s instructions.
Total RNA isolation and microRNA array assay
Total RNA was isolated from serum by using the Trizol reagent (Invitrogen, America) and a miRNeasy serum/plasma kit (QIAGEN, Germany) according to the protocol of the manufacturer. Its purity was assessed by measuring the absorbance ratio at 260 and 280 nm. The miRNA expression profiles were analyzed by applying the Affymetrix miRNA 4.0 based on the database miRBase Release 20. Briefly, FlashTag Biotin HSR Labeling Kit and GeneChip miRNA 4.0 Array were used for miRNA labeling and hybridization according to the manufacturer’s guidelines (Affymetrix). Hybridized GeneChips were washed and stained in the Affymetrix Fluidics Station 450. GeneChips were scanned by using Affymetrix GeneChip Scanner 3000 and the images were imported into Affymetrix®Expression Console™ software for analysis. We set the threshold at a fold change exceeding 1.2 and P < 0.05 for being specifically expressed.
Quantitative real‐time PCR
Quantitative RT‐PCR was performed in this study to confirm the different expressions of miRNAs in the serum of the population or brain tissue of mice. Several genes in the mouse brain involved in the Aβ metabolism including amyloid precursor protein (APP), β‐site amyloid cleaving enzyme (BACE1), a disintegrin and metalloprotease 10 (ADAM10), low‐density lipoprotein receptor‐related protein (LRP1), receptor for advanced glycation end products (RAGE), neprilysin (NEP) and insulin‐degrading enzyme (IDE) were also detected by qRT‐PCR. Primers for all assays were designed specifically and detailed in Table 1.
Table 1.
Primers used in this study.
| Primer | Forward sequence (5′–3′) | Reverse sequence (5′–3′) |
|---|---|---|
| hsa‐miR‐let‐7g‐5p | AGGACGCCGTGAGGTAGTAGT | CTCAACTGGTGTCGTGGAGTC |
| hsa‐miR‐107 | TGGCGGAGCAGCATTGTA | CTCAACTGGTGTCGTGGAGTC |
| hsa‐miR‐144‐3p | AGGCGGACGCTACAGTATAGAT | CTCAACTGGTGTCGTGGAGTC |
| hsa‐miR‐186‐3p | GGTCCGCCCAAAGGTGA | CTCAACTGGTGTCGTGGAGTC |
| hsa‐U6 snRNA | CTCGCTTCGGCAGCACA | CGCTTCACGAATTTGCGT |
| mmu‐miR‐let‐7g‐5p | CCGCGTGAGGTAGTAGTTTGTACAGTT | |
| mmu‐miR‐144‐3p | GCGCGCGTACAGTATAGATGATGTACT | |
| mmu‐U6 snRNA | AGAGAAGATTAGCATGGCCCCTG | |
| APP | AGCTGACAAGAAGGCCGTTA | TGAGCATGGCTTCAACTCTG |
| BACE1 | TTTGTTACGGCAGACATGGA | GCAGAGTGGCAACATGAAGA |
| ADAM10 | CCAGCTCTGATGGCAAAGAT | AGTCCGACCACTGAACTGCT |
| RAGE | CGTGAAGGAAGAGACCAGGA | AGGCTGAAACTGCAGGAGAA |
| LRP1 | AGTAGACTATCAGGGCGGCA | CTCAAACACGGACACGGAGA |
| NEP | GGCGGACAACCTCTACTCAA | TGTGCAATGGATTTCTCAGC |
| IDE | CACCAAACCTCTCCTTCCAA | GATCTCGATGCCGCAGTTAT |
| GAPDH | ACCCAGAAGACTGTGGATGG | TTCAGCTCTGGGATGACCTT |
Total RNA was isolated from serum or mouse brain by using Trizol reagent (Invitrogen, America) and a miRNA kit (Omega, America). The PCR reactions were run on a CFX Connect Real‐Time PCR Detection System (Bio‐Rad Laboratories, Germany). For miRNA validation, 1 μg total RNA was reverse transcribed into cDNA and then performed qRT‐PCR with a miRNA qRT‐PCR detection kit (Genecopoeia, America). The reactions were conducted in a total volume of 20 μL comprising 10 μL of Master Mix with SYBR Green, 2 μL of each primer (2.0 μM), 2 μL of sample cDNA and 4 μL deionized water. The reactions were under the following conditions: 95°C for 10 minutes, 40 cycles of 95°C for 10 s, 60°C for 20 s and 72°C for 10 s. RNU6B was used as the internal standard. For gene expression analysis, 1 μg total RNA was used as template to synthesize cDNA and further subjected to qRT‐PCR reaction as described elsewhere 57. GAPDH served as an internal reference for normalization. Samples were performed in triplicate at least from three biological replicates. The data were quantified and expressed as fold‐change compared to the control by using the ΔΔCT method.
Western blotting analysis
Protein expressions of Aβ metabolism index (APP, BACE1, ADAM10, LRP1, RAGE, NEP, IDE) were tested by western blot as described previously 57. Brain tissue was homogenized in a lysis buffer containing protease inhibitor (1 mM PMSF) and centrifuged at 15,000 rpm for 20 minutes at 4°C. The supernatant protein concentration was determined by bicinchoninic acid method and samples were stored at −80°C until use. Equal amounts of proteins were separated by 10% Tris‐Glycine gel electrophoresis and transferred onto polyvinylidene fluoride membranes. The antibodies (USA Abcam company) used were as follows: APP 1:1000, BACE1 1:2000, ADAM10 1:10000, LRP1 1:1000, RAGE 1:1000, NEP 1:5000, IDE 1:1000, β‐actin 1:1000 and Goat anti‐rabbit IgG 1:5000.
Neurobehavioral tests
After 3 weeks of intervention, a passive avoidance performance test was performed to determine the learning and memory ability of mice as described in previous work 56. The passive avoidance apparatus contains an illuminated and a dark compartment adjoining each other through a small gate with a grid floor made of stainless steel. Mice were placed in the illuminated compartment facing away from the dark compartment for 3 consecutive days, and the latency of entering into the dark compartment and the number of errors entering into the dark compartment were recorded.
Spatial learning and memory capability of mice were assessed by the Morris water maze (MWM) test as described previously 57. Briefly, an escape platform (38 cm in height, 10 cm in diameter) was submerged on a white‐water tank (temperature 21 ± 1°C) and located at a constant position in the middle of the southwest quadrant. A 5‐day navigation test was performed with four trials per day and a probe trail. Animals were allowed to swim on the water tank for 90 s to search for the platform, and they were gently guided onto it and left there for 15 s when they did not reach the target in 90 s on their own. In the probe trail following the last training, the hidden platform was removed. Mice were released from the northeast quadrant and allowed to swim for 90 s. Results were calculated individually for each animal (n = 10 per group).
Bielschowsky silver staining
Bielschowsky silver staining was performed to estimate brain tissue morphology 10. Brains isolated from skulls were fixed in 10% formaldehyde and embedded in paraffin. Five micrometers sections of the hippocampus samples were routinely prepared and stained with a 20% AgNO3 solution for 20 minutes in the dark. Slides were washed with distilled water and incubated in AgNO3/ammonium solution for 15 minutes in the dark. Then developer (20 mL of formalin, 100 mL of dH2O, a drop of concentrated HNO3 and 0.5 g of citric acid) was added into the working solution, and slides were incubated until they darken. Slides were then fixated in 5% sodium thiosulfate for 2 minutes, washed, dehydrated and mounted.
Statistical analysis
Statistical analysis was performed by using SPSS 20.0 and GraphPad Prism 6 software. Demographic characteristics were shown as mean ± standard deviation (SD) or median (interquartile range 25% ~ 75%) according to the sample distribution. Graphic results were expressed as mean ± standard error of the mean (SEM). Comparisons between two groups were done with Student’s t test for parametric data or the Mann‐Whitney test for nonparametric data. Qualitative data were expressed as a percentage and analyzed with the Chi‐square test. Correlations between data were assessed by using the Spearman correlation coefficient. Differences between groups were elevated by applying one‐way analysis of variance (ANOVA) followed by the least significance difference (LSD) post hoc test in animal studies. Two‐way ANOVA analysis was used for repeated measurement data in the water maze test. Statistical differences were considered at P < 0.05.
Results
Matched case‐control study
Demographic and clinical characteristics
Demographic and clinical characteristics of the subjects were shown in Table 2. There were significant differences in sense of solitude and MoCA scores between MCI patients and controls. MCI patients showed higher percentage of solitude (P = 0.022) and worse MoCA scores (P < 0.001) than controls. Moreover, MCI patients presented a larger proportion of smokers in comparison with the controls (P = 0.059). There were no significant differences in other factors such as BMI (P = 0.873), drinkers (P = 0.789) and family history of dementia (P = 0.306). In addition, no differences were found in FPG (P = 0.220), TC (P = 0.123), TG (P = 0.720), HDL‐C (P = 0.099) and LDL‐C (P = 0.169) levels obtained from patients and controls.
Table 2.
Demographic and clinical characteristics of MCI patients and controls. Abbreviations: MoCA = Montreal cognitive assessment; BMI = body mass index; FPG = fasting plasma glucose; TC = total cholesterol; TG = triglycerides, LDL‐C = low‐density lipoprotein cholesterol; HDL‐C = high‐density lipoprotein cholesterol.
| Variables | MCI (N = 167) | Control (N = 167) | P‐value |
|---|---|---|---|
| MoCA scoresa | 24 (21, 25) | 27 (26, 28) | <0.001** |
| Age | 59.3 ± 0.41 | 58.3 ± 0.35 | – |
| Male, n (%) | 83 (49.4) | 83 (49.4) | – |
| Education years | 9 (9, 12) | 9 (9, 12) | – |
| BMIa | 24.8 (23.5, 26.7) | 25.1 (23.1, 27.1) | 0.873 |
| Smokers, n (%)b | 40 (24.0) | 27 (16.2) | 0.059 |
| Drinkers, n (%)b | 52 (31.1) | 51 (30.5) | 0.789 |
| Solitude, n (%)b | 9 (5.39) | 1 (0.59) | 0.022* |
| Family history of dementia, n (%)b | 17 (10.2) | 12 (7.2) | 0.306 |
| FPG (mmol/L)a | 5.46 (5.00, 6.18) | 5.66 (5.20, 6.39) | 0.220 |
| TC (mmol/L)c | 4.85 ± 0.11 | 5.08 ± 0.09 | 0.123 |
| TG (mmol/L)a | 1.40 (0.90, 2.00) | 1.30 (0.92, 1.95) | 0.720 |
| HDL‐C (mmol/L)a | 1.23 (1.02, 1.50) | 1.30 (1.15, 1.54) | 0.099 |
| LDL‐C (mmol/L)c | 3.16 ± 0.08 | 3.34 ± 0.09 | 0.169 |
aData presented as medians (interquartile ranges) were compared between two groups by using the Mann‐Whitney test.
bData presented as frequencies (percentages) were compared between two groups by using Chi‐square test.
cData presented as mean ± SD were compared between two groups by using the Student’s t test.
* P < 0.05 compared with the control group; ** P < 0.01 compared with the control group.
Levels of 27‐OHC and Aβ in plasma
The differences in the plasma levels of oxysterols (27‐OHC, 24S‐OHC) and Aβ (Aβ1‐40, Aβ1‐42) between the two groups were shown in Figure 1. Higher levels of 27‐OHC (P = 0.042), Aβ1‐40 (P < 0.001) and Aβ1‐42 (P < 0.001) were found in MCI patients compared with the controls. However, there was no significant difference in 24S‐OHC (P > 0.05) between the two groups.
Figure 1.

Comparison of plasma levels of oxysterols and Aβ in MCI patients (n = 117) and normal controls (n = 117). A. Plasma levels of 27‐OHC and 24S‐OHC, data were shown as mean ± SEM and Student t test was performed. B. Plasma levels of Aβ1‐40 and Aβ1‐42, data were shown as median (interquartile range) and Mann‐Whitney U test was performed. * P < 0.05 compared with controls, ** P < 0.01 compared with controls.
Correlations of 27‐OHC, Aβ and MoCA scores
As shown in Figure 2A, the level of Aβ1‐40 in plasma was negatively correlated with MoCA scores (r = −0.331, P < 0.001). The same result was found in Aβ1‐42 (r = −0.376, P < 0.001) (Figure 2B). Additionally, the relation between 27‐OHC and the two levels of Aβ was also analyzed. There was a correlation between Aβ1‐40 and 27‐OHC (r = 0.168, P = 0.01) in the levels of plasma (Figure 2C), but no correlation in Aβ1‐42 and 27‐OHC (r = 0.075, P = 0.252) (Figure 2D).
Figure 2.

Correlation analysis of plasma oxysterols and Aβ in MCI patients (n = 117) and controls (n = 117). A. Aβ 1‐40 and MoCA scores. B. Aβ 1‐42 and MoCA scores. C. 27‐OHC and Aβ 1‐40. D. 27‐OHC and Aβ 1‐42. Spearman’s rho coefficient (r) value and P‐value were indicated in the graphs.
Different expressions of microRNA in serum
In order to find out the potential role of miRNA in the pathological process of MCI, Affymetrix miRNA 4.0 arrays which contain 2578 lines of human matured miRNAs were used to detect the different expressions of miRNA in peripheral circulation in MCI patients and controls. The miRNA candidates were selected among 5 MCI patients and 5 control cases which were randomly selected from each group. Data manifested 12 up‐regulated and 8 down‐regulated candidate miRNAs in MCI patients vs. controls based on a change more than 1.2‐fold with an adjusted P‐value <0.05 (Figure 3). The up‐regulated miRNAs included hsa‐miR‐29a‐3p, hsa‐miR‐92a‐1‐5p, hsa‐miR‐139‐5p, hsa‐miR‐182‐5p, hsa‐miR‐181a‐3p, hsa‐miR‐221‐5p, hsa‐miR‐128‐3p, hsa‐miR‐138‐2‐3p, hsa‐miR‐144‐3p, hsa‐miR‐186‐3p, hsa‐miR‐155‐3p and hsa‐miR‐376c‐3p, whereas the down‐regulated miRNAs contained hsa‐let‐7c‐5p, hsa‐miR‐92a‐3p, hsa‐miR‐103a‐2‐5p, hsa‐miR‐107, hsa‐let‐7g‐5p, hsa‐miR‐15b‐3p, hsa‐miR‐149‐3p and hsa‐miR‐193a‐5p.
Figure 3.
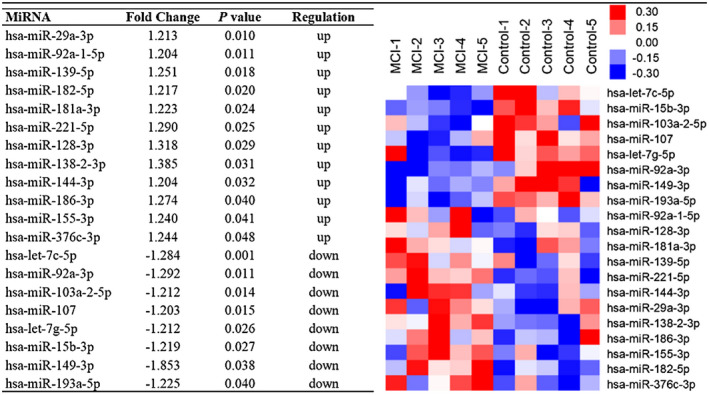
Differentially expressed miRNAs between MCI patients (n = 5) and normal controls (n = 5). Red indicates up‐regulation and blue down‐regulation
Second, 4 miRNAs were chosen to perform further verification: hsa‐miR‐144‐3p, hsa‐miR‐186‐3p, hsa‐miR‐107 and hsa‐let‐7g‐5p in this study. The verification test was performed among other 50 MCI patients and 50 normal controls randomly selected from the same population. The results confirmed that a strong increase in hsa‐miR‐144‐3p (P < 0.05) and an obvious decrease in hsa‐let‐7g‐5p (P < 0.01) were observed in the serum of MCI patients compared with the controls, which was consistent with the outcomes of the microarray analysis (Figure 4).
Figure 4.

Validation of four miRNAs in MCI patients (n = 50) and controls (n = 50). Data were shown as mean ± SEM and Student t test was performed. * P < 0.05 compared with controls, ** P < 0.01 compared with controls.
Animal study
Effects of 27‐OHC on body weight and organ coefficient
The body weight of mice in the four groups was measured before and after intervention (Figure 5A). Three weeks of 27‐OHC treatment had no effect on body weight (P > 0.05). The organs such as brain, liver, heart, kidney and spleen of APP/PS1 mice were removed and weighed at the end of the experiments, and the coefficient (organ weight/body weight) in each mouse was calculated subsequently. It was observed that the brain coefficient was significantly decreased in the 27‐OHC group compared with the APP group (P = 0.019), while no change in liver, intestine, kidney and spleen coefficient was found in different groups (P > 0.05) (Figure 5B–F).
Figure 5.

Effects of 27‐OHC on body weight and organ coefficient in APP/PS1 mice. A. Body weight of mice pre‐ and post‐intervention. B. Brain, C. liver, D. kidney, E. intestine and F. spleen coefficient (organ weight/body weight). All data were shown as mean ± SEM and one‐way ANOVA was performed. # P < 0.05 compared with the APP group.
Consequences of 27‐OHC on learning and memory capability
The passive avoidance and MWM analyses were carried out to assess the effect of 27‐OHC on learning and memory ability of mice. The results of the passive avoidance test were shown in Tables 3 and 4. Compared to the WT group, the mice in the APP group had a significantly shorter latency and more error times to enter into the dark area (P = 0.001). In addition, a drastic reduction in latency was found in the mice of the 27‐OHC group compared with the mice in the APP group (P = 0.001). Similarly, an increased number of errors was also observed in the 27‐OHC group compared to the APP group (P = 0.001). These data suggested that 27‐OHC treatment could enhance learning and memory impairment in AD mice. However, the longer latency (P = 0.01) and less errors of entering into the dark area (P = 0.004) in the mice of the ANS group indicated that 27‐OHC inhibition could attenuate the impairment of learning and memory ability.
Table 3.
The latency to enter the dark area in passive avoidance test (n = 10).
| Group | WT group | APP group | 27‐OHC group | ANS group |
|---|---|---|---|---|
| Day 1 | 278.24 ± 4.62 | 258.83 ± 12.42** | 236.17 ± 12.53## | 264.50 ± 6.98# |
| Day 2 | 277.50 ± 9.00 | 257.33 ± 11.34** | 239.75 ± 11.80# | 271.00 ± 9.93## |
| Day 3 | 288.58 ± 3.55 | 272.25 ± 36.06* | 246.50 ± 11.82## | 273.32 ± 8.91 |
| Average | 281.44 ± 6.89 | 262.80 ± 20.34** | 240.81 ± 13.56## | 269.61 ± 8.78# |
Results were expressed as mean ± SEM. * P < 0.05 compared with the WT group; ** P < 0.01 compared with the WT group; # P < 0.05 compared with the APP group; ## P < 0.01 compared with the APP group. The latency was presented as second.
Table 4.
The number of errors entering into the dark area in passive avoidance test (n = 10).
| Group | WT group | APP group | 27‐OHC group | ANS group |
|---|---|---|---|---|
| Day 1 | 0.83 ± 0.07 | 1.08 ± 0.03* | 1.58 ± 0.12## | 1.00 ± 0.07## |
| Day 2 | 0.52 ± 0.05 | 1.00 ± 0.01** | 1.33 ± 0.09## | 1.00 ± 0.02 |
| Day 3 | 0.33 ± 0.05 | 0.83 ± 0.02** | 1.25 ± 0.08## | 0.67 ± 0.04## |
| Average | 0.56 ± 0.09 | 0.97 ± 0.07** | 1.39 ± 0.13## | 0.89 ± 0.02## |
Results were expressed as mean ± SEM. * P < 0.05 compared with the WT group; ** P < 0.01 compared with the WT group; ## P < 0.01 compared with the APP group.
MWM test was performed to determine the spatial learning and memory of mice. Repeated‐measures two‐way ANOVA identified a significant reduction in escape latency with training period (P < 0.001) (Figure 6). There was no interaction effect between the factors of intervention time and group (P > 0.05). In the place navigation test, there were significant differences in escape latency (Figure 6A), mean distances to platform (Figure 6B and C) and average speed (Figure 6D) among the four groups. Compared with the APP group, longer escape latency was obviously observed in the 27‐OHC group (P < 0.001). The same results were shown in distances to platform (P = 0.028) and swimming speed (P = 0.006). Additionally, the escape latency on day 4 (P < 0.001) and day 5 (P < 0.001) in the ANS group decreased compared with the APP group, which suggested the inhibition of 27‐OHC might improve spatial learning and memory capability of mice. During the probe trail (without platform), the 27‐OHC group had a remarkably decreased number of platform‐site crossovers (P = 0.007) and spent less time in the target quadrant (P = 0.016) in comparison with the APP group (Figure 6E and F). No significant differences were observed in the ANS group compared to the APP group (P > 0.05).
Figure 6.

Morris water maze test performed to determine spatial learning and memory of mice. A. escape latency, B. moved distance in training, C. mean distance to platform, D. average speed, E. the number of platform‐site crossovers, F. time in the target quadrant. All data were shown as mean ± SEM. # P < 0.05 compared with the APP group, ## P < 0.01 compared with the APP group.
Impacts of 27‐OHC on Aβ deposition in brain
It is reported that amyloid plaques derived from Aβ deposition are one of the most significant characteristics in the development of AD. Therefore, Bielschowsky silver staining was used to determine the amyloid plaques in mouse hippocampus (Figure 7). The results showed that amyloid plaques appeared in mouse hippocampus of the APP group (Figure 7B), 27‐OHC group (Figure 7D) and ANS group (Figure 7C), respectively, but not in the WT group (Figure 7A). The deposition of Aβ in the CA1 region of the hippocampus was much more severe in the 27‐OHC‐treated group than that in the APP group. Conversely, diminished Aβ plaques were observed in the ANS group in comparison with the APP group.
Figure 7.

Bielschowsky silver staining on brain after intervention in the studied groups. A. WT group, B. APP group, C. ANS group, D. 27‐OHC group; scale bar = 50 μm.
Influences of 27‐OHC on Aβ levels in plasma and brain
Aβ levels in plasma and brain tissue which were paralleled with Aβ deposition were also detected in this study. As expected, the mice in the APP group had a higher plasma level of Aβ1‐42 than that in the WT group (P < 0.05) (Figure 8C). Likewise, significant alterations of brain levels of Aβ1‐40 (P < 0.001) and Aβ1‐42 (P < 0.001) were observed in the APP group compared with the WT group (Figure 8E and F). Moreover, plasma (P = 0.001) and brain (P = 0.001) levels of 27‐OHC were remarkably increased in the 27‐OHC group compared to the APP group, whereas obviously decreased levels of 27‐OHC in plasma (P = 0.021) and brain (P = 0.041) were observed in the ANS group (Figure 8A and D). There were no significant changes in the plasma or brain level of 27‐OHC between the APP and WT groups. Compared to the APP group, Aβ1‐40 levels in the mice of the 27‐OHC group were observed to have a similar increase in plasma (P < 0.001) and in the brain (P < 0.01) (Figure 8B and E).
Figure 8.

Levels of 27‐OHC and Aβ in plasma and brain of mice. A. plasma 27‐OHC, B. plasma Aβ 1‐40, C. plasma Aβ 1‐42, D. brain 27‐OHC, E. brain Aβ 1‐40, F. brain Aβ 1‐42. All data were shown as mean ± SEM. ** P < 0.01 compared with the WT group, ## P < 0.01 compared with the APP group.
Regulations of 27‐OHC on Aβ metabolism and let‐7g‐5p in brain
Based on the high levels of Aβ and increased amyloid plaques in brain with 27‐OHC treatment, we hypothesized that higher levels of 27‐OHC would disturb the metabolism of Aβ, including its production, transportation and elimination. The role of 27‐OHC on the metabolic factors of Aβ was investigated by qRT‐PCR and western blot (Figure 9).
Figure 9.

Gene and protein expressions of factors related to Aβ metabolism. A. APP mRNA, B. BACE1 mRNA, C. ADAM10 mRNA, D. LRP1 mRNA, E. RAGE mRNA, F. APP protein, G. BACE1 protein, H. ADAM10 protein, I. LRP1 protein, J. RAGE protein, K. IDE mRNA, L. NEP mRNA, M. IDE protein, N. NEP protein. All data were shown as mean ± SEM. * P < 0.05 compared with the WT group, ** P < 0.01 compared with WT group, ## P < 0.01 compared with the APP group.
To understand the molecular mechanism of 27‐OHC on Aβ formation, we analyzed the gene and protein expressions of APP (Figure 9A and F), BACE1 (Figure 9B and G) and ADAM10 (Figure 9C and H) in the brain of mouse. It was shown that the mRNA expressions of APP (P < 0.01) and BACE1 (P < 0.05) were increased in the APP group compared to the WT group, whereas ADAM10 (P < 0.01) was decreased. The same results were found in protein expression which increased APP and decreased ADAM10 which was detected in the APP group compared to the WT group. Similarly, both mRNA and protein expressions of APP (P < 0.01) and BACE1 (P < 0.01) were significantly enhanced in the 27‐OHC group compared to the APP group, and only protein expression of ADAM10 (P < 0.01) was reduced in the 27‐OHC group in comparison with the APP group. Contrary to the 27‐OHC group, the inverse expressions of APP (P < 0.01), BACE1 (P < 0.01) and ADAM10 (P < 0.01) both in mRNA and protein were found in the ANS group compared to the APP group.
As RAGE and LRP1 were critical for the transport of Aβ, their gene and protein expressions (Figure 9) in brain were determined in our study. The results showed that both mRNA and protein expressions of LRP1 were decreased in the APP group compared to the WT group (P < 0.01), but no differences in RAGE were observed between the two groups. In the 27‐OHC group, much more decreased mRNA and protein expressions of LRP1 (P < 0.01) and increased expressions of RAGE (P < 0.01) were found in comparison with the APP group. On the contrary, decreased expressions of RAGE (P < 0.01) and increased expressions of LRP1 (P < 0.01) in mRNA and protein were observed in the ANS group compared to the APP group.
In addition, the gene and protein expressions of Aβ‐degrading peptidases IDE (Figure 9K and M) and NEP (Figure 9L and N) in the brain were also evaluated in the present study. Similar to the above results, mRNA and protein expressions of IDE were diminished in the APP group compared to the WT group, and a drastic reduction was presented in the 27‐OHC group as compared with the APP group (P < 0.01). However, a reverse result was observed in the ANS group (P < 0.01). Moreover, no significant changes of NEP were found among all groups.
Our previous validation of miRNAs in the serum found an up‐regulation of miR‐144‐3p and down‐regulation of let‐7g‐5p in MCI patients. To test whether these two miRNAs expressed differently in brain, we measured them in AD mouse brain (Figure 10). As a result, up‐regulated let‐7g‐5p (P < 0.01) and down‐regulated miR‐144‐3p (P < 0.05) were present in the APP group compared to the WT group. Interestingly enough, the mice in the 27‐OHC group had a down‐regulation of let‐7g‐5p (P < 0.01) in comparison with the APP group. Although there was no significant variation on the expression of miR‐144‐3p (P > 0.05) between the two groups, a higher trend was found in the mice of the 27‐OHC group than that in the APP group. This finding might provide a novel view for Aβ accumulation induced by 27‐OHC in MCI.
Figure 10.

Let‐7g‐5p and miR‐144‐3p relative expression in mouse brain. A. let‐7g‐5p, B. miR‐144‐3P. All data were shown as mean ± SEM. * P < 0.05 compared with the WT group, ** P < 0.01 compared with the WT group, ## P < 0.01 compared with the APP group.
Discussion
As cholesterol oxidation products, oxysterols, have been mentioned to be one of the main triggers of AD 17 evidence has demonstrated that 27‐OHC is potentially involved in this progress 16. In addition, our previous work and other studies have shown that increased level of 27‐OHC in plasma was found in MCI and AD patients 20, 50. However, what is the real relationship between 27‐OHC and cognitive impairment? Further studies need to be explored. Moreover, how does the over‐production of 27‐OHC lead to cognitive impairment? The specific mechanisms are not yet clear. In this study, we found MCI patients had a higher plasma level of 27‐OHC. Excessive concentration of 27‐OHC in peripheral circulating blood could lead to the accumulation of 27‐OHC in brain. The increased 27‐OHC would be further linked to the accumulation and deposition of Aβ both in brain and blood in the pathogenesis of AD. Its biological mechanism might be that 27‐OHC could destroy the metabolism of Aβ which includes production, transport and elimination. Furthermore, the molecular mechanism might be associated with the miRNAs of let‐7g‐5p and miR‐144‐3p.
The first evidence stemming from the content of oxysterols in autopsy samples from AD and normal brains points to an increase in both 27‐OHC and 24S‐OHC in the frontal cortex of AD brains, with a trend that appears related to the disease severity 34. In order to explore the relationship between oxysterols and cognitive impairment, we first detected the plasma levels of 27‐OHC and 24S‐OHC in MCI patients as well as in age‐, sex‐ and education‐matched controls. Similar to other researches 28, 43, the concentration of 27‐OHC in blood was slightly higher in MCI patients, but no difference was found in 24S‐OHC. This result indicated that people with higher plasma level of 27‐OHC might have a higher risk of cognitive impairment. In addition, 27‐OHC might have a greater impact on cognition than 24S‐OHC in the period of MCI. It has been observed that the level of 27‐OHC in the later stages of AD was approximately twice that of the controls, while in the early stages of AD, it was slightly above that of the controls 47. This study provides evidence that the plasma level of 27‐OHC increased in MCI patients, that is likely with the importance of discriminating the early stages of AD progression. However, the opposite opinions make this association a controversy. Gamba et al reports that plasma levels of 27‐OHC are significantly reduced in patients with dementing disorders compared to non‐demented subjects 8. Moreover, it is pointed that no differences were found in the plasma levels of 27‐OHC between AD patients and the controls 5. The reason for this divergence might be related to the different genetic backgrounds of the population, the proportion of different stages of cognitive decline and even the distribution of age, sex and education.
In order to confirm the relationship between excessive 27‐OHC and cognitive impairment, APP/PS1 transgenic mice were used in the present study. Consistent with the results of the human study, 27‐OHC treatment could lead to much more severe learning and memory impairment compared to the APP group under the premise that learning and memory damage was shown in the mice of the APP group. Moreover, mice treated with ANS for inhibition of 27‐OHC performed better with enhanced learning and memory. This result was the same as our previous research: that 27‐OHC could disturb the learning and memory capability of SD rats 56. Although ANS inhibits estrogen in females which is responsible for cognitive impairment, less effects have been reported in male mice 33. In fact, brain estrogen is thought to be synthesized de novo, and it is higher than peripheral estrogen 32. It also has been observed that the brain level of ANS is much lower than that in peripheral circulation after ANS treatment in mice 33. Thus, this minor effect of estrogen by ANS in male mice, most likely, did not underline the cognitive impairment in this manuscript. As for the effects of 27‐OHC on the growth of mice, there was no interference on the weight of whole body in addition to the organ coefficients of liver, kidney, intestine and spleen, but a decrease of brain coefficient could be observed. Other evidence also indicates there is a link between an increase in 27‐OHC and higher levels of neurodegeneration in the hippocampus of rabbits 2. These results further confirmed our hypothesis that excessive accumulation of 27‐OHC could lead to cognitive impairment.
What attributes to the correlation between 27‐OHC accumulation and cognitive impairment? Aβ is believed to be the essential trigger of AD pathology. Evidence has shown that 27‐OHC could increase the levels of Aβ and induce endoplasmic reticulum stress, a cellular response that is implicated in AD 5. It is also demonstrated in in vitro studies that Aβ could be released after 27‐OHC treatment 6, 7. In our matched case‐control study, elevated plasma levels of Aβ1‐40 and Aβ1‐42 were observed in MCI patients compared to the control people with normal cognition. As expected, correlation analysis showed that the higher the Aβ levels in blood, the worse their cognition was. Simultaneously, MCI patients had a higher level of 27‐OHC in plasma. This was similar to the findings of Popp et al, who found increased plasma levels of 27‐OHC and Aβ1‐42 in the blood of AD patients 38. Moreover, a slight correlation between Aβ1‐40 and 27‐OHC was found in the present study; this made us speculate that excessive 27‐OHC might lead to cognitive dysfunction through up‐regulating Aβ1‐40 expression. To verify this relationship between 27‐OHC and Aβ, the results of APP/PS1 mouse experiment showed that 27‐OHC treatment could cause a much more severe deposition of Aβ in the CA1 region of the hippocampus than that in the APP control mice, but mice treated with the inhibitor of 27‐OHC had diminished Aβ plaques. Meanwhile, significant up‐regulated Aβ1‐40 in brain and plasma were also found after being treated with 27‐OHC. It was similar to a previous finding in rabbit hippocampus with 27‐OHC treatment 25. They were stronger proofs of this correlation.
Abnormal metabolism of Aβ is hypothesized to initiate a pathological cascade leading to AD 41. In present study, whether 27‐OHC modulated the deposition and expression of Aβ through regulating Aβ metabolism was a key point of molecular mechanism we focused on. The reasons of abnormal Aβ metabolism could be summarized into three aspects which are production, transport and elimination. As known, Aβ is derived from the sequential proteolytic cleavages of APP by β‐secretase BACE1 and γ‐secretase 48. The initial cleavage of APP by BACE1 is the rate‐limiting step of Aβ production. APP is also processed in an alternative pathway by α‐secretase ADAM10 to generate neuroprotective and neurotrophic‐soluble APPα ectodomain 40. Therefore, we explored the mechanism of 27‐OHC on Aβ production from detecting APP, BACE1 and ADAM10 in the brain of APP/PS1 mice. As expected, over‐expressions of APP and BACE1 were found in APP/PS1 mice compared to that in wild control mice, while ADAM10 was down‐regulated in mRNA and protein expressions. It was worth noting that 27‐OHC treatment could lead to much higher expressions of APP and BACE1 both in mRNA and protein levels accompanying a significant lower expression of ADAM10 in protein expression compared to APP/PS1 mice. Nevertheless, ANS, the inhibitor of 27‐OHC, could lead to the opposite effects on APP, BACE1 and ADAM10. These results are considered to increase 27‐OHC in the brain leading to an over‐production and accumulation of Aβ through regulating the production factors of APP, BACE1 and ADAM10. It was consistent with our previous data that 27‐OHC could induce an increased expression of BACE1 and Aβ over‐production in human neuroblastoma SH‐SY5Y cells 27. Evidence also demonstrates that APP could be processed in response to 27‐OHC. The reason might be a multi‐tiered process promoted by 27‐OHC direct binding to APP, inducing conformational changes and liberating AICD 9. Moreover, it could support the view of our present study that decreased ADAM10 might elevate Aβ levels and plaque load in AD mice 45.
In addition, the dynamic balance of Aβ in brain and circulation largely depends on the internal Aβ transport system. Two major transport factors, RAGE and LRP1, are involved in receptor‐mediated mechanism which regulates Aβ trafficking across the BBB 23. RAGE promotes an influx of Aβ across the BBB from blood to brain, but LRP1 conversely mediates an efflux of Aβ out of the brain. In this case, RAGE is reported to have a positive correlation with Aβ deposition in brain 3. On the other hand, evidence has shown that LRP1 promotes Aβ clearance from brain across BBB in mouse models of AD 44. In this study, accordant results that aggravated Aβ deposition accompanied by decreased LRP1 in mRNA and protein expressions were observed in the brain of APP/PS1 mice. It should be noticed that continuous severe disorders of LRP1 were manifested in 27‐OHC treatment. While mRNA and protein expressions of LRP1 were reversely increased with ANS intervention, these results indicated that 27‐OHC might inhibit the efflux of brain‐derived Aβ into circulation by LRP1. Moreover, although up‐regulated mRNA and protein expressions of RAGE were not found in APP/PS1 mice, an obvious increase in RAGE both in mRNA and protein levels was observed in the brain of 27‐OHC‐treated APP/PS1 mice. Conversely, ANS could significantly down‐regulate these two levels of RAGE. These suggested that RAGE was another target of 27‐OHC on disturbing Aβ internal transport.
Furthermore, dysfunction of clearance is a critical mechanism to destroy steady‐state Aβ in body. IDE and NEP are recognized as two principal peptidases involved in the degradation of Aβ 30. IDE, a major extracellular protease, has been shown to be decreased in the brain of AD patients 57. Over‐expression of IDE could promote the clearance of Aβ and even prevent Aβ accumulation in AD mice 55. NEP is a zinc‐dependent axonal and synaptic membrane metallopeptidase, which is widely expressed in cortical neurons. It is reported that NEP knockout mice have up‐regulated levels of Aβ in brains 24. In present study, decreased IDE mRNA and protein expressions were found in the brain of APP/PS1 mice, while extremely low expressions were obtained particularly in mice treated with 27‐OHC. Moreover, results showed that ANS could definitely reverse the reduction in IDE. However, there was no significant alteration in two levels of NEP in mouse brain. The above findings were undoubtedly powerful evidences to prove that 27‐OHC could accelerate Aβ accumulation and deposition in brain through regulating Aβ metabolism in ways of promoting production, disturbing transport and restraining degradation.
To further explore the potential molecular mechanism between 27‐OHC and Aβ, serum miRNAs were screened in MCI patients and controls. Twelve up‐regulated miRNAs and 8 down‐regulated miRNAs were found in this study. Then, validation tests of four selected miRNAs showed that hsa‐miR‐144‐3p was up‐regulated and hsa‐let‐7g‐5p was down‐regulated in the serum of MCI patients compared to the controls. It was similar to the studies of Tan et al 18 and Satoh et al 42, who reported a decreased expression of let‐7g‐5p in the serum of AD patients. In addition, evidence also shows that the down‐regulation of let‐7g‐5p in plasma is associated with AD and MCI 14. However, there is no evidence to specify what mechanism it is and how let‐7g‐5p is associated with AD exactly. Besides, a study has indicated ADAM10 might be the target of miR‐144 which could promote cognitive impairment by accelerating Aβ accumulation 46, but very few researches have mentioned miR‐144‐3p in AD or MCI. These made us to further explore whether these two miRNAs are likely to play a regulating role in 27‐OHC and Aβ accumulation.
In the present transgenic mice study, increased let‐7g‐5p and decreased miR‐144‐3p were found in APP/PS1 mice compared to wild‐type controls. This was different from human results. The reason might be the genetic background of APP/PS1 mice which is more likely to be closely associated with familial AD rather than sporadic AD. However, an interesting result was that let‐7g‐5p could be severely down‐regulated by 27‐OHC treatment. This effect of 27‐OHC was consistent with the results of severe cognitive impairment and high levels of Aβ in the mice of the 27‐OHC treatment group. Nevertheless, the specific relationship should be further explored.
In summary, our results indicated that 27‐OHC enhanced the accumulation and deposition of Aβ both in the brain and blood resulting in a severe impairment of cognition, especially in the modulation of Aβ1‐40. The mechanism might be associated with the regulation of Aβ metabolism including production, transportation and elimination. Additionally, miRNAs of let‐7g‐5p and miR‐144‐3p were likely to play vital roles in this pathological process induced by 27‐OHC. Further studies are needed to clarify the exact role of these two miRNAs.
Acknowledgments
This work was supported by the State Key Program of the National Natural Science Foundation of China (Grant No. 81330065), and the National Natural Science Foundation of China (Grant No. 81673149).
References
- 1. Ahonen L, Maire FB, Savolainen M, Kopra J, Vreeken RJ, Hankemeier T et al (2014) Analysis of oxysterols and vitamin D metabolites in mouse brain and cell line samples by ultra‐high‐performance liquid chromatography‐atmospheric pressure photoionization‐mass spectrometry. J Chromatogr A 1364:214–222. [DOI] [PubMed] [Google Scholar]
- 2. Brooks SW, Dykes AC, Schreurs BG (2017) A high‐cholesterol diet increases 27‐hydroxycholesterol and modifies Estrogen receptor expression and neurodegeneration in rabbit hippocampus. J Alzheimers Dis 56:185–196. [DOI] [PMC free article] [PubMed] [Google Scholar]
- 3. Cai Z, Liu N, Wang C, Qin B, Zhou Y, Xiao M et al (2016) Role of RAGE in Alzheimer’s disease. Cell Mol Neurobiol 36:483–495. [DOI] [PMC free article] [PubMed] [Google Scholar]
- 4. Cerami C, Dodich A, Iannaccone S, Magnani G, Santangelo R, Presotto L et al (2018) A biomarker study in long‐lasting amnestic mild cognitive impairment. Alzheimers Res Ther 10:42. [DOI] [PMC free article] [PubMed] [Google Scholar]
- 5. Costa AC, Joaquim H, Nunes VS, Kerr DS, Ferreira GS, Forlenza OV et al (2017) Donepezil effects on cholesterol and oxysterol plasma levels of Alzheimer’s disease patients. Eur Arch Psychiatry Clin Neurosci 1–7. [DOI] [PubMed] [Google Scholar]
- 6. Dias IHK, Mistry J, Fell S, Reis A, Spickett CM, Polidori MC et al (2014) Oxidized LDL lipids increase β‐amyloid production by SH‐SY5Y cells through glutathione depletion and lipid raft formation. Free Radic Biol Med 75:48–59. [DOI] [PMC free article] [PubMed] [Google Scholar]
- 7. Gamba P, Guglielmotto M, Testa G, Monteleone D, Zerbinati C, Gargiulo S et al (2014) Up‐regulation of β‐amyloidogenesis in neuron‐like human cells by both 24‐ and 27‐hydroxycholesterol: protective effect of N‐acetyl‐cysteine. Aging Cell 13:561–572. [DOI] [PMC free article] [PubMed] [Google Scholar]
- 8. Gamba P, Testa G, Gargiulo S, Staurenghi E, Poli G, Leonarduzzi G (2015) Oxidized cholesterol as the driving force behind the development of Alzheimer’s disease. Front Aging Neurosci 7:119. [DOI] [PMC free article] [PubMed] [Google Scholar]
- 9. Gongol B, Marin TL, Jeppson JD, Mayagoitia K, Shin S, Sanchez N et al (2017) Cellular hormetic response to 27‐hydroxycholesterol promotes neuroprotection through AICD induction of MAST4 abundance and kinase activity. Sci Rep 7:13898. [DOI] [PMC free article] [PubMed] [Google Scholar]
- 10. Hizbilla M, Tursun T, Wusiman Z, Aimaiti R, Tuerxun M, Muhebati M, Amat N (2017) The effect of Abnormal Savda Munziq on the histology and pathology of hippocampal CA1 in APP/PS1 transgenic AD model mice. J Xinjiang Med Univ 40:715–720. [Google Scholar]
- 11. Kang S, Jeong H, Baek JH, Lee SJ, Han SH, Cho HJ et al (2016) PiB‐PET imaging‐based serum proteome profiles predict mild cognitive impairment and Alzheimer’s disease. J Alzheimers Dis 53:1563–1576. [DOI] [PubMed] [Google Scholar]
- 12. Karu K, Turton J, Wang Y, Griffiths WJ (2011) Nano‐liquid chromatography–tandem mass spectrometry analysis of oxysterols in brain: monitoring of cholesterol autoxidation. Chem Phys Lipid 164:411–424. [DOI] [PubMed] [Google Scholar]
- 13. Kayano M, Higaki S, Satoh J, Matsumoto K, Matsubara E, Takikawa O, Niida S (2016) Plasma microRNA biomarker detection for mild cognitive impairment using differential correlation analysis. Biomarker Res 4:22. [DOI] [PMC free article] [PubMed] [Google Scholar]
- 14. Kumar P, Dezso Z, Mackenzie C, Oestreicher J, Agoulnik S, Byrne M et al (2013) Circulating miRNA biomarkers for Alzheimer’s disease. PLoS One 8:e69807. [DOI] [PMC free article] [PubMed] [Google Scholar]
- 15. Kumar S, Vijayan M, Reddy PH (2017) MicroRNA‐455‐3p as a potential peripheral biomarker for Alzheimer’s disease. Hum Mol Genet 26:3808. [DOI] [PMC free article] [PubMed] [Google Scholar]
- 16. Lathe R, Sapronova A, Kotelevtsev Y (2014) Atherosclerosis and Alzheimer ‐ diseases with a common cause? Inflammation, oxysterols, vasculature. BMC Geriatrics 14:36. [DOI] [PMC free article] [PubMed] [Google Scholar]
- 17. Leoni V, Caccia C (2011) Oxysterols as biomarkers in neurodegenerative diseases. Chem Phys Lipid 164:515–524. [DOI] [PubMed] [Google Scholar]
- 18. Lin T, Jin‐Tai Y, Meng‐Shan T, Qiu‐Yan L, Hui‐Fu W, Wei Z et al (2014) Genome‐wide serum microRNA expression profiling identifies serum biomarkers for Alzheimer's disease. J Alzheimers Dis 40:1017–1027. [DOI] [PubMed] [Google Scholar]
- 19. Liu Q, An Y, Ma W, Feng L, Wang C, Lu Y, Xiao R (2018) Highcholesterol diet results in elevated amyloidbeta and oxysterols in rats. Mol Med Rep 17:1235–1240. [DOI] [PubMed] [Google Scholar]
- 20. Liu Q, Yu A, Yu H, Lu Y, Feng L, Wang C, Xiao R (2016) Relationship between oxysterols and mild cognitive impairment in the elderly: a case–control study. Lipids Health Dis 15:177. [DOI] [PMC free article] [PubMed] [Google Scholar]
- 21. Lopez OL, Becker JT, Chang Y, Klunk WE, Mathis C, Price J et al (2018) Amyloid deposition and brain structure as long‐term predictors of MCI, dementia, and mortality. Neurology 90:e1920–e1928. [DOI] [PMC free article] [PubMed] [Google Scholar]
- 22. Lu Y, An Y, Guo J, Zhang X, Wang H, Rong H, Xiao R (2016) Dietary intake of nutrients and lifestyle affect the risk of mild cognitive impairment in the Chinese elderly population: a cross‐sectional study. Front Behav Neurosci 10:229. [DOI] [PMC free article] [PubMed] [Google Scholar]
- 23. Ma LY, Fei YL, Wang XY, Wu SD, Du JH, Zhu M et al (2017) The research on the relationship of RAGE, LRP‐1, and Aβ accumulation in the hippocampus, prefrontal lobe, and amygdala of STZ‐induced diabetic rats. J Mol Neurosci 62:1–10. [DOI] [PubMed] [Google Scholar]
- 24. Madani R, Poirier R, Wolfer DP, Welzl H, Groscurth P, Lipp HP et al (2006) Lack of neprilysin suffices to generate murine amyloid‐like deposits in the brain and behavioral deficit in vivo. J Neurosci Res 84:1871–1878. [DOI] [PubMed] [Google Scholar]
- 25. Marwarha G, Dasari B, Prasanthi JRP, Schommer J, Ghribi O (2010) Leptin reduces the accumulation of Aβ and phosphorylated tau induced by 27‐hydroxycholesterol in rabbit organotypic slices. J Alzheimers Dis 19:1007. [DOI] [PMC free article] [PubMed] [Google Scholar] [Retracted]
- 26. Marwarha G, Ghribi O (2015) Does the oxysterol 27‐hydroxycholesterol underlie Alzheimer’s disease–Parkinson’s disease overlap? Exp Gerontol 68:13–18. [DOI] [PMC free article] [PubMed] [Google Scholar]
- 27. Marwarha G, Raza S, Prasanthi JRP, Ghribi O (2013) Gadd153 and NF‐κB crosstalk regulates 27‐hydroxycholesterol‐induced increase in BACE1 and β‐amyloid production in human neuroblastoma SH‐SY5Y cells. PLoS One 8:e70773. [DOI] [PMC free article] [PubMed] [Google Scholar] [Retracted]
- 28. Mateos L, Ismail MA, Gilbea FJ, Leoni V, Winblad B, Björkhem I, Cedazomínguez A (2011) Upregulation of brain renin angiotensin system by 27‐hydroxycholesterol in Alzheimer's disease. J Alzheimers Dis 24:669. [DOI] [PubMed] [Google Scholar]
- 29. Mckeever PM, Schneider R, Taghdiri F, Weichert A, Multani N, Brown RA et al (2018) MicroRNA expression levels are altered in the cerebrospinal fluid of patients with young‐onset Alzheimer’s disease. Mol Neurobiol. [DOI] [PMC free article] [PubMed] [Google Scholar]
- 30. Miners JS, Barua N, Kehoe PG, Gill S, Love S (2011) Aβ‐degrading enzymes: potential for treatment of Alzheimer disease. J Neuropathol Exp Neurol 70:944–959. [DOI] [PubMed] [Google Scholar]
- 31. Nagaraj S, Laskowskakaszub K, Dębski KJ, Wojsiat J, Dąbrowski M, Gabryelewicz T et al (2017) Profile of 6 microRNA in blood plasma distinguish early stage Alzheimer's disease patients from non‐demented subjects. Oncotarget 8:16122. [DOI] [PMC free article] [PubMed] [Google Scholar]
- 32. Ooishi Y, Kawato S, Hojo Y, Hatanaka Y, Higo S, Murakami G et al (2012) Modulation of synaptic plasticity in the hippocampus by hippocampus‐derived estrogen and androgen. J Steroid Biochem Mol Biol 131:37–51. [DOI] [PubMed] [Google Scholar]
- 33. Overk CR, Lu PY, Wang YT, Choi J, Shaw JW, Thatcher GR, Mufson EJ (2012) Effects of aromatase inhibition versus gonadectomy on hippocampal complex amyloid pathology in triple transgenic mice. Neurobiol Dis 45:479–487. [DOI] [PMC free article] [PubMed] [Google Scholar]
- 34. Gamba P, Guglielmotto M, Testa G, Monteleone D, Zerbinati C, Gargiulo S et al (2014) Up‐regulation of β‐amyloidogenesis in neuron‐like human cells by both 24‐ and 27‐hydroxycholesterol: protective effect of N‐acetyl‐cysteine. Aging Cell 13:561–572. [DOI] [PMC free article] [PubMed] [Google Scholar]
- 35. Park JC, Han SH, Cho HJ, Byun MS, Yi D, Choe YM et al (2017) Chemically treated plasma Aβ is a potential blood‐based biomarker for screening cerebral amyloid deposition. Alzheimers Res Ther 9:20. [DOI] [PMC free article] [PubMed] [Google Scholar]
- 36. Pataj Z, Liebisch G, Schmitz G, Matysik S (2016) Quantification of oxysterols in human plasma and red blood cells by liquid chromatography high‐resolution tandem mass spectrometry. J Chromatogr A 1439:82–88. [DOI] [PubMed] [Google Scholar]
- 37. Patrick E, Rajagopal S, Wong HKA, Mccabe C, Xu J, Tang A et al (2017) Dissecting the role of non‐coding RNAs in the accumulation of amyloid and tau neuropathologies in Alzheimer’s disease. Mol Neurodegener 12:51. [DOI] [PMC free article] [PubMed] [Google Scholar]
- 38. Popp J, Meichsner S, Kölsch H, Lewczuk P, Maier W, Kornhuber J et al (2013) Cerebral and extracerebral cholesterol metabolism and CSF markers of Alzheimer’s disease. Biochem Pharmacol 86:37–42. [DOI] [PubMed] [Google Scholar]
- 39. Popp J, Meichsner S, Kolsch H, Lewczuk P, Maier W, Kornhuber J et al (2013) Cerebral and extracerebral cholesterol metabolism and CSF markers of Alzheimer’s disease. Biochem Pharmacol 86:37–42. [DOI] [PubMed] [Google Scholar]
- 40. Postina R (2008) A closer look at alpha‐secretase. Curr Alzheimer Res 5:179–186. [DOI] [PubMed] [Google Scholar]
- 41. Sadigheteghad S, Talebi M, Mahmoudi J, Babri S, Shanehbandi D (2015) Selective activation of alpha 7 nicotinic acetylcholine receptor by pha‐543613 improves beta‐amyloid 25–35 mediated cognitive deficits in mice. Neuroscience 298:81. [DOI] [PubMed] [Google Scholar]
- 42. Satoh J, Kino Y, Niida S (2015) MicroRNA‐Seq data analysis pipeline to identify blood biomarkers for Alzheimer’s disease from public data. Biomarker Insights 10:21. [DOI] [PMC free article] [PubMed] [Google Scholar]
- 43. Shafaati M, Solomon A, Kivipelto M, Björkhem I, Leoni V (2007) Levels of ApoE in cerebrospinal fluid are correlated with Tau and 24S‐hydroxycholesterol in patients with cognitive disorders. Neurosci Lett 425:78–82. [DOI] [PubMed] [Google Scholar]
- 44. Storck SE, Meister S, Nahrath J, Meißner JN, Schubert N, Spiezio AD et al (2016) Endothelial LRP1 transports amyloid‐β1–42 across the blood‐brain barrier. J Clin Invest 126:123. [DOI] [PMC free article] [PubMed] [Google Scholar]
- 45. Suh J, Choi SH, Romano DM, Gannon MA, Lesinski AN, Kim DY, Tanzi RE (2013) ADAM10 missense mutations potentiate β‐amyloid accumulation by impairing prodomain chaperone function. Neuron 80:385. [DOI] [PMC free article] [PubMed] [Google Scholar]
- 46. Sun L, Zhao M, Zhang J, Liu A, Ji W, Li Y et al (2017) MiR‐144 promotes Î2‐amyloid accumulation‐induced cognitive impairments by targeting ADAM10 following traumatic brain injury. Oncotarget 8:59181. [DOI] [PMC free article] [PubMed] [Google Scholar]
- 47. Testa G, Staurenghi E, Zerbinati C, Gargiulo S, Iuliano L, Giaccone G et al (2016) Changes in brain oxysterols at different stages of Alzheimer's disease: Their involvement in neuroinflammation. Redox Biol 10:24–33. [DOI] [PMC free article] [PubMed] [Google Scholar]
- 48. Vassar R, Bennett BD, Babukhan S, Kahn S, Mendiaz EA, Denis P et al (1999) Beta‐secretase cleavage of Alzheimer's amyloid precursor protein by the transmembrane aspartic protease BACE. Science 286:735–741. [DOI] [PubMed] [Google Scholar]
- 49. Wang C, An Y, Yu H, Feng L, Liu Q, Lu Y et al (2016) Association between Exposure to the Chinese Famine in Different Stages of Early Life and Decline in Cognitive Functioning in Adulthood. Front Behav Neurosci 10:146. [DOI] [PMC free article] [PubMed] [Google Scholar]
- 50. Wang HL, Wang YY, Liu XG, Kuo SH, Liu N, Songd QY, Wang MW (2016) Cholesterol, 24‐hydroxycholesterol, and 27‐hydroxycholesterol as surrogate biomarkers in cerebrospinal fluid in mild cognitive impairment and Alzheimer’s disease: a meta‐analysis. J Alzheimers Dis 51:45. [DOI] [PMC free article] [PubMed] [Google Scholar]
- 51. Weinberg RB, Mufson EJ, Counts SE (2015) Evidence for a neuroprotective microRNA pathway in amnestic mild cognitive impairment. Front Neurosci 9:430. [DOI] [PMC free article] [PubMed] [Google Scholar]
- 52. Wielkoszyński T, Zalejskafiolka J, Strzelczyk JK, Owczarek AJ, Cholewka A, Furmański M, Stanek A (2018) Oxysterols increase inflammation, lipid marker levels and reflect accelerated endothelial dysfunction in experimental animals. Mediators Inflamm 2018:2784701. [DOI] [PMC free article] [PubMed] [Google Scholar]
- 53. Xie B, Liu Z, Jiang L, Liu W, Song M, Zhang Q et al (2017) Increased serum miR‐206 level predicts conversion from amnestic mild cognitive impairment to Alzheimer’s disease: a 5‐year follow‐up study. J Alzheimers Dis 55:509. [DOI] [PubMed] [Google Scholar]
- 54. Xu Q, Cao S, Rajapakse S, Matsubara JA (2018) Understanding AMD by analogy: systematic review of lipid‐related common pathogenic mechanisms in AMD, AD, AS and GN. Lipids Health Dis 17:3. [DOI] [PMC free article] [PubMed] [Google Scholar]
- 55. Yin K, Jin J, Zhu X, Yu L, Wang S, Lai Q et al (2017) CART modulates beta‐amyloid metabolism‐associated enzymes and attenuates memory deficits in APP/PS1 mice. Neurol Res 39:1. [DOI] [PubMed] [Google Scholar]
- 56. Zhang DD, Yu HL, Ma WW, Liu QR, Han J, Wang H, Xiao R (2015) 27‐Hydroxycholesterol contributes to disruptive effects on learning and memory by modulating cholesterol metabolism in the rat brain. Neuroscience 300:163–173. [DOI] [PubMed] [Google Scholar]
- 57. Zhang X, Lv C, An Y, Liu Q, Rong H, Tao L et al (2018) Increased levels of 27‐hydroxycholesterol induced by dietary cholesterol in brain contribute to learning and memory impairment in rats. Mol Nutr Food Res 62):1700531. [DOI] [PubMed] [Google Scholar]