

Abstract
Plasmalogens are the most abundant form of ether phospholipids in myelin and their deficiency causes Rhizomelic Chondrodysplasia Punctata (RCDP), a severe developmental disorder. Using the Gnpat‐knockout (KO) mouse as a model of RCDP, we determined the consequences of a plasmalogen deficiency during myelination and myelin homeostasis in the central nervous system (CNS). We unraveled that the lack of plasmalogens causes a generalized hypomyelination in several CNS regions including the optic nerve, corpus callosum and spinal cord. The defect in myelin content evolved to a progressive demyelination concomitant with generalized astrocytosis and white matter‐selective microgliosis. Oligodendrocyte precursor cells (OPC) and mature oligodendrocytes were abundant in the CNS of Gnpat KO mice during the active period of demyelination. Axonal loss was minimal in plasmalogen‐deficient mice, although axonal damage was observed in spinal cords from aged Gnpat KO mice. Characterization of the plasmalogen‐deficient myelin identified myelin basic protein and septin 7 as early markers of dysmyelination, whereas myelin‐associated glycoprotein was associated with the active demyelination phase. Using in vitro myelination assays, we unraveled that the intrinsic capacity of oligodendrocytes to ensheath and initiate membrane wrapping requires plasmalogens. The defect in plasmalogens was rescued with glyceryl 1‐myristyl ether [1‐O‐tetradecyl glycerol (1‐O‐TDG)], a novel alternative precursor in the plasmalogen biosynthesis pathway. 1‐O‐TDG treatment rescued myelination in plasmalogen‐deficient oligodendrocytes and in mutant mice. Our results demonstrate the importance of plasmalogens for oligodendrocyte function and myelin assembly, and identified a novel strategy to promote myelination in nervous tissue.
Keywords: leukodystrophy, myelin, oligodendrocytes, peroxisomal disorders
Introduction
Leukodystrophies are a complex group of genetically distinct disorders characterized by the pathological involvement of central nervous system (CNS) white matter because of abnormalities in myelination or in myelin homeostasis 54. Heterogeneous and diverse cellular deficiencies mediate complex mechanisms that ultimately cause myelin defects. The myelin sheath is the extended and modified plasma membrane of oligodendrocytes in the CNS, wrapped in multilayered stacks around axons 36. In addition to its unique architecture, the distinctive lipid‐rich composition of myelin sets it apart from other membranes. Myelin contains high amounts of plasmalogens, a membrane phospholipid that can account for up to 70% of the pool of ethanolamine glycerophospholipids in myelin 38. Plasmalogens are a class of ether phospholipids characterized by a vinyl‐ether bond at the sn‐1 position of the glycerol backbone 46. The biosynthesis of plasmalogens initiates in peroxisomes through the activity of two peroxisomal enzymes, namely glyceronephosphate O‐acyltransferase (GNPAT) and alkylglycerophosphate synthase (AGPS), and the subsequent steps take place in the endoplasmic reticulum 55. Impairments in the biosynthesis of plasmalogens are the hallmark of Rhizomelic Chondrodysplasia Punctata (RCDP). RCDP is a genetically heterogeneous autosomal recessive disorder, with an estimated incidence of 1:100 000 newborns. Mutations in five different genes (ie, PEX7, GNPAT, AGPS, FAR1 and PEX5L), involved in the biosynthesis of ether phospholipids, characterize the five types of RCDP (RCDP types 1 to 5, respectively) 6, 13, 16. The impaired biosynthesis of plasmalogens leads to multiple developmental malformations, including congenital cataracts, shortening of proximal limbs, profound growth deficiency and intellectual disability 59. Abnormal signal intensities on magnetic resonance imaging (MRI) are suggestive of dys‐ and/or hypomyelination 2, 5, 27 but the generalized lack of histopathological analysis has hindered the characterization of myelin defects 41. The occurrence of seizures in RCDP patients, the development of epilepsy and the increased latencies of evoked potentials have also been proposed to correlate with impaired CNS myelination 4. The neurological involvement in RCDP patients combined with the observation of plasmalogen deficiencies in several neurodegenerative disorders underscores the role and function of these phospholipids in myelinating glia 13. The understanding of the pathology and disease mechanisms caused by the deficiency in plasmalogens has been powered by the characterization of mouse models for RCDP 18. Using the Gnpat KO mice 42 as a model of RCDP type 2, we analyzed the consequences of a plasmalogen deficiency in the CNS.
Here we unravel how a plasmalogen deficiency compromises myelination and myelin content throughout the CNS. The disease progression in a murine model of RCDP is complex with an initial generalized hypomyelination that evolves into active demyelination. Our results demonstrate that a plasmalogen defect affects the intrinsic ability of oligodendrocytes to myelinate and we identified a new alkyl glycerol that can serve as an alternative precursor in the biosynthesis of plasmalogens and can rescue myelination defects in Gnpat KO mice.
Materials and Methods
Mouse strains
All mouse procedures were performed according to the European Directive 2010/63/EU established by the European Parliament and of the Council, as well as the National legislation (Decreto‐Lei 113/2013). Animal studies were reviewed and approved by the Portuguese General Veterinarian Board (DGAV, #011852).
Gnpat knockout (KO) mice and wild‐type (WT) littermates were obtained from mating Gnpat heterozygous mice on a Swiss‐Webster background. All animals were maintained with ad libitum access to rodent food and water, and were kept in a 12:12 h light and dark cycle facility. Genotyping was performed as previously described 42. Gnpat heterozygous mice were crossed with Thy1‐YFP 16Jrs/J mice (JAX mice) that express yellow fluorescent protein (YFP) from the neuronal Thy1‐promoter 21.
Histological and morphological analysis
Mice were anesthetized with ketamine/medetomidine mixture (75 and 1 mg/kg body weight, respectively) and lumbar spinal cord, optic nerve and brain were isolated and fixed by immersion. For morphometric analysis, tissues were fixed in 4% glutaraldehyde in 0.1M sodium cacodylate buffer (pH 7.4) for 5 days and processed as previously described 17. In spinal cords, the region chosen for analysis was the ventral funiculus, immediately adjacent to the ventromedian fissure. Semi‐thin sections were cut at 1µm, stained with 1% p‐phenylenediamine (PPD) and used to determine the density of myelinated fibers. Ultrathin sections were processed for ultrastructural analysis as described 17. For g‐ratio determination, the axonal diameter and the myelin sheath thickness were measured (four measurements per fiber; one hundred and fifty fibers per mouse). Pseudocolored electron microscopy images were processed in Photoshop CS3, by selecting the region of interest and applying color with transparency in order to highlight the region to be analyzed.
For immunohistochemistry, tissues were fixed by immersion in modified Carnoy’s solution (absolute ethanol: methanol: glacial acetic acid – 6:3:1) for 2 h, processed for paraffin embedding, sectioned at 4µm, cleared and rehydrated. Sections were permeabilized in 100% methanol, treated with 0.1% NaBH4 in 10 mM Tris, 1mM EDTA at pH 9.0 and blocked with 5% normal donkey serum (NDS) in PBS. Primary antibodies (Supplemental Figure 1) were diluted in 5% NDS in PBS and incubated over night at 4°C. Secondary antibodies, either biotinylated or conjugated with Alexa Fluor (Jackson ImmunoResearch Europe, Lda, Ely, UK), were diluted in 5% NDS in PBS and incubated at room temperature (RT) for 1 h. The quantifications were performed using Feature J, a java‐based plug‐in of the imaging software NIH Image J, using a Hessian‐based algorithm 24.
Myelin isolation and western blot analysis
Myelin was isolated after two rounds of osmotic shock and discontinuous sucrose gradients, as previously described 39. Cerebrum and spinal cord from 2‐month (WT n = 4 and Gnpat KO n = 4) to 1.5‐year‐old (WT n = 7 and Gnpat KO n = 6) mice were used to isolate and purify myelin. Isolated myelin was sonicated in PBS containing 1.5% SDS, 0.5% Na2CO3 and protease inhibitor cocktail (Roche), and total protein levels were measured using DC™ Protein Assay (Bio‐Rad). The samples (2 μg of total myelin protein) were separated by SDS‐PAGE gels using TGX Stain‐Free™ FastCast™ 12% acrylamide (Bio‐Rad) and analyzed using a ChemiDoc imaging system to measure the amount of myelin proteins in the gel. Nitrocellulose membranes were blocked with 5% skim milk (Fluka) in Tris‐buffered saline with 1% Tween 20 (TBS‐T) for 1 h at RT, washed and incubated overnight at 4oC with different primary antibodies (section above) diluted in 5% BSA in TBS‐T. HRP‐labeled secondary antibodies were diluted 1:5000 in 5% skim milk in TBS‐T and incubated for 1 h at RT. Membranes were developed using ECL (Luminata Crescendo Western HRP Substrate, Milipore, Algés, Portugal). Blots were scanned in a Molecular Imager GS800, and quantified using Quantity One 4.6.9 software.
Mixed cortical neuron‐glial culture
Mixed cortical neuron‐glial culture was performed as described 29, with minor alterations. Cortical neurons and glial cells were isolated from individual WT and Gnpat KO mouse brains, at embryonic day 17. Cortices were digested in 0.05% Trypsin + 0.2 mg/mL EDTA, dissociated and cells were resuspended in culture medium (Neurobasal medium with 1x N21 supplement, 2 mM l‐glutamine, 1× P/S). Cells were plated at a density of 1.5 × 10⁵ cells/well onto glass coverslips coated with poly‐l‐lysine (20 μg/mL, P2636 Sigma) and laminin (2 μg/mL, L2020 Sigma). After 6 days in vitro, cultures were maintained in myelination medium 56. At DIV20, cells were fixed with 4% PFA, and immunolabeled with anti‐tubulin‐βIII (to stain neurons) and anti‐myelin basic protein (MBP to stain oligodendrocytes). The fixed cells were processed as described above for immunohistochemistry. The entire area of the glass coverslip (1.32 cm2) was analyzed and the total number of MBP‐positive cells (ie, OL with low levels of MBP, OL with high levels of MBP, OL with assembled MBP segments and degenerating OLs) was counted.
For 1‐O‐tetradecylglycerol (1‐O‐TDG) (Biosynth) treatment, medium was supplemented with 7 μM 1‐O‐TDG in absolute ethanol or 0.1% absolute ethanol (control) starting at DIV 10. For treatment with batyl alcohol (BA; 1‐O‐octadecylglycerol; Sigma‐Aldrich) and chimyl alcohol (CA; 1‐O‐hexadecylglycerol; Bachem), medium was supplemented with 7 μM BA and 7 μM CA in DMSO or with 0.14% DMSO (control) starting at DIV 10. In both treatment schemes, cells were fixed at DIV20 and processed for immunofluorescence as described above.
Primary OPC cultures
The preparation of mixed glial cell cultures was performed as described 31. Neurons and glial cells were isolated from WT and Gnpat KO brain hemispheres at postnatal day 2. Brain hemispheres were digested in 0.05% Trypsin + 0.2 mg/mL EDTA, dissociated, cells were resuspended in plating medium (DMEM high glucose with 10% FBS and 1× P/S) and seeded onto 25 cm2 flasks pre‐coated with 50 µg/mL poly‐D‐lysine (P0899 Sigma). After 9 days in culture, oligodendrocyte precursor cells (OPC) were obtained by differential shaking and resuspended in 1× SATO 31. Cells were seeded at a density of 15 000 cells/well onto scaffold discs of randomly oriented poly‐l‐lactide microfibers (The Electrospinning Company Ltd.), pre‐coated with poly‐l‐lysine (100 μg/mL; P2636 Sigma). Differentiation was induced at DIV four with the removal of PDGF and FGF from the medium, and with the addition of 0.5% FBS. The cells were fixed at DIV12 with 4% PFA, and immunolabeled with anti‐MBP as described above. The scaffolds were mounted on microscope slides and imaged on Leica TCS SP5 II confocal (Leica Microsystems, Germany) using a 63× magnification objective with a z‐step of 0.013 µm. For increased z‐definition of the poly‐l‐lactide fibers, we made use of the refraction capability of the confocal microscope using the 405 nm laser line at full power, and a detector in the same emission spectrum region. Finally, the cross‐sectional view of myelinated segments was accomplished by the usage of the orthogonal view function of Fiji.
Measurement of plasmalogens
Lung‐derived mouse embryonic fibroblasts from WT (n = 3) and Gnpat KO (n = 5) at embryonic day 17.5 were cultured in T75 flasks with DMEM supplemented with 10% FBS 3. The medium was supplemented with 7 μM 1‐O‐TDG or 0.01% absolute ethanol (control) during 12 days. Cells were harvested using trypsin, washed and stored at −80°C until processing. Lipid extracts were prepared as described 52 and analyzed for phospholipid content 53 and plasmalogens. For the latter, lipids were treated with acidic methanol followed by conversion of the liberated aldehydes with 1,3‐cyclohexanedione into fluorescent decahydroacridines derivatives, which were separated according to the chain length by RP‐HPLC (Symmetry C18 column (4.6 × 150 mm; 5 µm; 100 Å; Waters) and monitored by fluorimetry (using a Waters 2475 Multi‐Wavelength Fluorescence Detector; Ex 390 nm; Em 460 nm); modified from Mezzar et al 32 (Van Veldhoven P.P., unpublished data).
In vivo treatment
1‐O‐TDG was dissolved in 1 mL of ethanol and mixed with 1 mL of Tween‐80 (Sigma‐Aldrich). After heating to evaporate the ethanol, the mixture was diluted with saline (B. Braun Medical, Portugal) so that Tween‐80 was at 1% w/v. 1‐O‐TDG or vehicle was administered to WT and Gnpat KO mice via subcutaneous (s.c.) injections from P1 to P8 and via intraperitoneal (i.p) injections from P10 to P18. Mice were euthanized at P20 and tissues collected for histological analyses.
Statistical analysis
All data were analyzed using GraphPad Prism software, and results are expressed as mean + S.E.M. To compare two different groups, Student’s T test (unpaired, two‐tailed) was used and P < 0.05 was considered a significant difference. For multiple comparisons, one‐way ANOVA test was used, followed by Tukey’s multiple comparison tests.
Results
Lack of plasmalogens causes generalized myelin deficits
To determine if plasmalogens play a role in myelination and myelin maintenance, different regions within the CNS were analyzed during the end stages of the disorder. Ultrastructural analysis using electron microscopy revealed that a plasmalogen deficiency caused generalized reduction in myelin in several CNS regions (Figure 1). The optic nerve, corpus callosum and spinal cord were the most affected regions in the Gnpat KO mice. In these regions, we observed an extreme loss of myelin as many axons were devoid of myelin (Figure 1) and the vast majority of myelinated axons contained thinner myelin sheaths (Figure 1). In spinal cords from Gnpat KO mice, the generalized deficiency in myelin was detected in all white mater tracts, including the ventral and lateral funiculus, and the corticospinal and dorsal column tracts (Supplemental Figure 2). The cerebellar white matter tract was the least affected region as axons devoid of myelin were not frequent, despite the generalized occurrence of thinner myelin sheaths. The internal capsule of Gnpat KO mice displayed an intermediate pathology, with severe features when compared to cerebellar white matter (ie, presence of axons devoid of myelin) and milder features when compared to the corpus callosum and optic nerves (ie, increased number of axons that still contain a myelin sheath). These results highlight that a deficiency in plasmalogens causes a complex myelin disorder. To understand the role of plasmalogens in oligodendrocytes and myelin pathology, we set out to perform a detailed characterization of the optic nerve and spinal cord in Gnpat KO mice.
Figure 1.
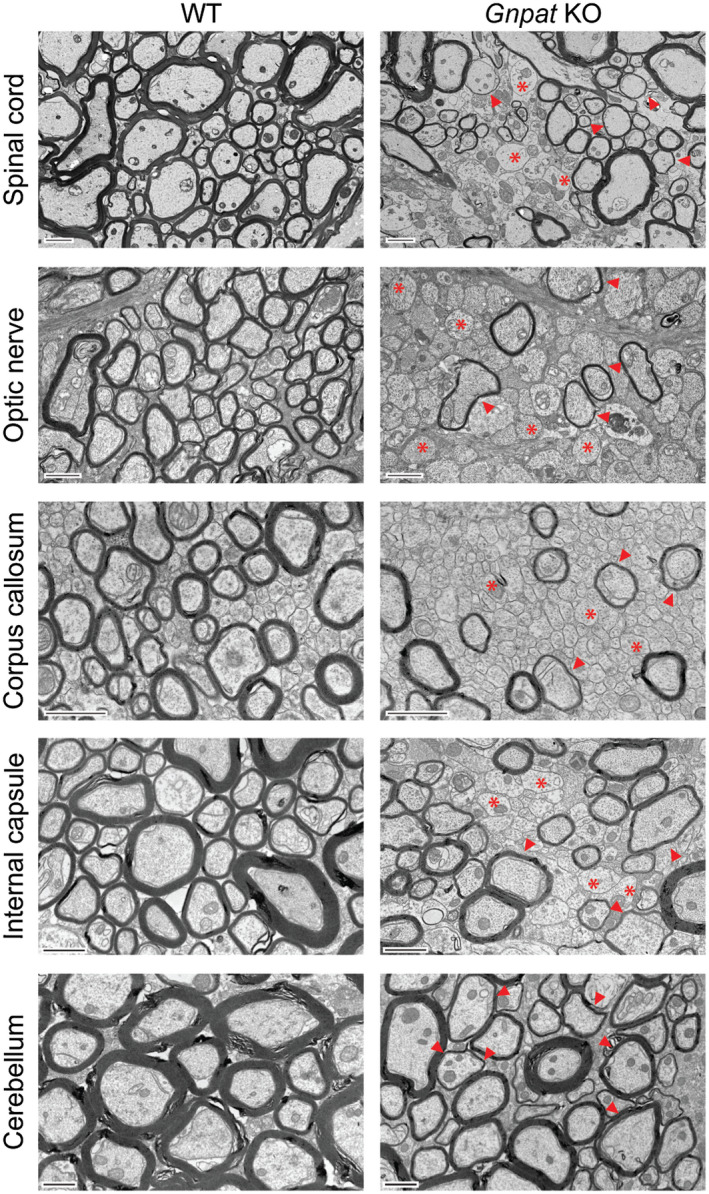
Plasmalogen deficiency causes generalized myelin deficits throughout the CNS. Electron microscopy images of the spinal cord (n = 6 per genotype), optic nerve (n = 7 per genotype), corpus callosum (n = 3 per genotype), internal capsule (n = 3 per genotype) and cerebellum (n = 3 per genotype) from 1.5‐year‐old WT and Gnpat KO mice. Examples of axons devoid of myelin are highlighted with asterisks and axons with thinner myelin sheaths are highlighted with arrowheads. Scale bars are 2 μm in spinal cord and 1μm in the remaining CNS regions.
Complex defects in myelinogenesis are aggravated by active demyelination
The previous results prompted us to evaluate the process of myelination from the early postnatal period until the end stages of the disease at 1.5 years of age. We characterized in detail the myelination defects present in spinal cords and optic nerves of WT and Gnpat KO mice. The qualitative analysis of myelination in spinal cords from 2‐ to 1.5–year‐old Gnpat KO mice highlighted the progressive worsening of myelin defects (Supplemental Figure 2). Spinal cords from aged Gnpat KO mice displayed a notable hypoplasia with a decrease in white matter area (Supplemental Figure 2).
The morphometric analysis of spinal cords from WT and Gnpat KO mice was performed in the ventral funiculus. A decreased density of myelinated fibers was observed in the spinal cord from Gnpat KO mice at 21 days (P21), 9 months and 1.5 years of age (Figure 2A). Surprisingly, at 2 months of age, the density of myelinated fibers was normal suggesting that at younger ages there was a delay in the process of myelination. However, the determination of the g‐ratio revealed that at 2 months of age, spinal cords from Gnpat KO mice contained less myelin when compared to WT mice (Figure 2B). Thus, despite reaching a normal density of myelinated axons, the extent of myelination was defective. The analysis also revealed a progressive loss of myelin with higher g‐ratio in 1.5‐year‐old Gnpat KO mice (Figure 2B). To distinguish if the demyelination observed in spinal cords from aged Gnpat KO mice was because of the loss of myelinated axons and/or loss of myelin, we performed a detailed ultrastructural analysis. The morphometric analysis (Figure 2C) revealed decreased density of myelinated fibers and a significant increase in axons that completely lacked myelin and in axons with visible reductions in myelin thickness. Given that the total number of axons did not differ between WT and Gnpat KO spinal cords, these results indicate that a deficiency in plasmalogens causes a severe loss of myelin, without causing major axonal loss (Figure 2C–D). The ultrastructural analysis was crucial for the validation of an active period of myelin loss. In spinal cords from Gnpat KO mice, we observed myelin debris (Figure 2E), as well as the presence of myelin‐laden cells (Figure 2F–G). These cells, presumably macrophages, were frequently found close to naked axons and contained lipid accumulations and whorls of myelin. We analyzed the gliotic status in the spinal cord of 1.5‐year‐old Gnpat KO mice and age‐matched WT mice. Increased number of astrocytes with a reactive appearance were observed in the white and grey matter of spinal cords from Gnpat KO mice (Supplemental Figure 3). However, microgliosis was restricted to the spinal cord white matter (Supplemental Figure 3). Combined, these results demonstrate that a deficiency in plasmalogens causes an initial hypomyelination that progress to a late onset demyelination.
Figure 2.
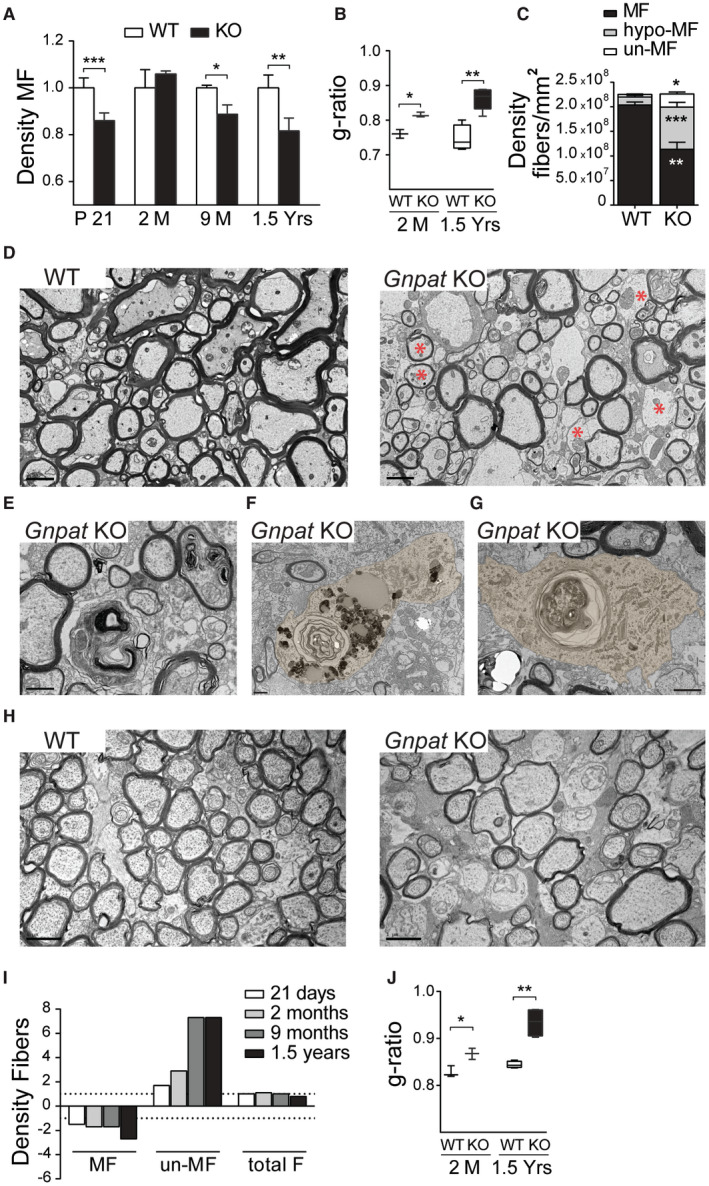
Plasmalogen deficiency impairs myelination and myelin maintenance. A. Quantification of myelinated fibers (MF) in the ventral funiculus of WT and Gnpat KO spinal cords at different ages. [n = 5 per genotype at 21 days (P21); n = 3 per genotype at 2 and 9 months (M); and n = 6 per genotype at 1.5 years (Yrs)]. ***P = 0.014; *P = 0.037; **P = 0.021. B. Quantification of myelin by determination of g‐ratio in spinal cords of 2‐month (n = 3 each genotype) and 1.5‐year‐old (n = 6 each genotype) WT and Gnpat KO mice. *P = 0.0014; **P = 0.0007. C. Quantification of myelinated fibers (MF), hypo‐myelinated (hypo‐MF) and un‐myelinated fibers (un‐MF) in spinal cords of 1.5‐year‐old WT and Gnpat KO mice (n = 6 per genotype). *P = 0.0012, **P = 0.00036; ***P = 0.0001. D. Ultrastructural analysis by electron microscopy of spinal cords from 1.5‐year‐old WT and Gnpat KO mice (n = 3 per genotype) highlighting severe demyelination and signs of axonal damage (asterisks). E‐G. Ultrastructural analysis of spinal cords from Gnpat KO mice (n = 6) revealing the presence of myelin debris (E) and myelin‐laden cells (pseudocolored in F,G). H. Ultrastructural analysis of optic nerves from P21 WT and Gnpat KO mice (n = 3 per genotype) revealed a defect in myelination with increased number of axons devoid of myelin (asterisks) and thinner myelin sheaths (arrowheads). I. Fiber density analysis of myelinated fibers (MF), un‐myelinated fibers (un‐MF) and the total fiber count (total F) at different ages in optic nerves from WT and Gnpat KO mice (n = 3–7 per genotype). J. The quantification of myelination by determining g‐ratio in optic nerves from WT and Gnpat KO mice at 2 months (n = 3 per genotype) and 1.5 years of age (n = 7 per genotype). *P = 0.027, **P = 0.008. Scale bars are 1 μm in D‐H, and 200 μm in G.
The ultrastructural analysis of optic nerves from WT and Gnpat KO mice also revealed the severe consequences of a plasmalogen deficiency. Optic nerves from mutant mice at 21 days of age contained axons devoid of myelin and axons with reduced amounts of myelin (Figure 2H). Similarly, to what was observed in spinal cords, the morphometric analysis revealed a progressive loss of myelinated fibers with a concomitant increase in axons lacking myelin sheaths (Figure 2I). Measurements of g‐ratio confirmed hypomyelination in 2‐month‐old Gnpat KO nerves and progressive loss of myelin in aged mice (Figure 2J). When compared to the spinal cord, the optic nerve from Gnpat KO mice was more severely affected in terms of myelin loss (Figures 1 and 2I). However, the general appearance of axons was better in optic nerves when compared to spinal cords. Completely demyelinated optic nerve axons lacked evident signs of axonal damage, whereas in the spinal cord some axonal damage could be detected (Figure 2D, asterisks).
Combined, these results indicate that a plasmalogen deficiency affects the ability of oligodendrocytes to initiate myelination and sustain normal myelin levels in the spinal cord and optic nerve. Given the importance of oligodendrocytes and myelin to maintain axonal health, we investigated if the loss of myelin could cause axonal damage.
Regional‐specific and demyelination‐independent axonal damage in plasmalogen‐deficient CNS
Demyelinated and damaged axons are known to display a higher proportion of non‐phosphorylated neurofilaments 51. To investigate possible axonal abnormalities, we evaluated the expression levels of non‐phosphorylated neurofilaments in spinal cords from WT and Gnpat KO mice from P21 to 1.5 years of age. We observed a pronounced increase in non‐phosphorylated neurofilaments in spinal cords from 1.5‐year‐old Gnpat KO mice (Supplemental Figure 4). To further evaluate the occurrence of axonal damage in the CNS of plasmalogen‐deficient mice, we generated a new mouse line. We crossed Gnpat mice with mice expressing yellow fluorescent protein (YFP) under the neuronal Thy1 promoter (Thy1‐YFP) to generate WT and Gnpat KO mice with widespread neuronal expression of YFP. The analysis of longitudinal sections of spinal cords from 7‐month and 1.5‐year‐old Gnpat KO:YFP mice revealed clear signs of axonal damage, including axonal swellings, constrictions and axonal degeneration (Figure 3A). The analysis in non‐consecutive sections from spinal cords of Gnpat KO mice highlights the extent of the observed axonal abnormalities (Supplemental Figure 4). In accordance with previous analyses, optic nerves from Gnpat KO:YFP mice lacked clear signs of axonal damage (Supplemental Figure 4). The ultrastructural analysis of optic nerves from Gnpat KO mice highlighted the severe loss of myelin and confirmed the sparing of axons, which lacked any sign of damage (Figure 3D). Ultrastructural analysis of longitudinal sections of spinal cords from Gnpat KO mice at 1.5 years of age highlighted the extent of axonal damage. The observed defects included axonal swellings with accumulation of organelles (Figure 3B) and axonal degeneration (Figure 3C). In addition, swollen myelinated axons with accumulation of abnormal organelles were observed in the internal capsule and cerebellum (Supplemental Figure 4) of Gnpat KO mice. Interestingly, the axonal defects were primarily observed in myelinated axons. In addition to the most common defects associated with axonal damage, we also identified outfoldings of the axonal membrane and the presence of vesicle‐like structures in spinal cords (Figure 3E–I) and cerebellum (Supplemental Figure 4) of aged Gnpat KO mice. Although these vesicle‐like structures seemed to reside in the periaxonal space, detailed analysis of the electron microscopy images revealed that the outfoldings of axonal membranes were lined with the oligodendrocyte adaxonal membrane (Figure 3H). The complex nature and the arrangement of the vesicle‐like structures seem to derive from the axonal membrane outfoldings. In some cases, the ultrastructural images revealed the continuous adaxonal membrane of the oligodendrocyte and what seems to be an excised vesicle derived from the axonal outfolding (Figure 3I).
Figure 3.
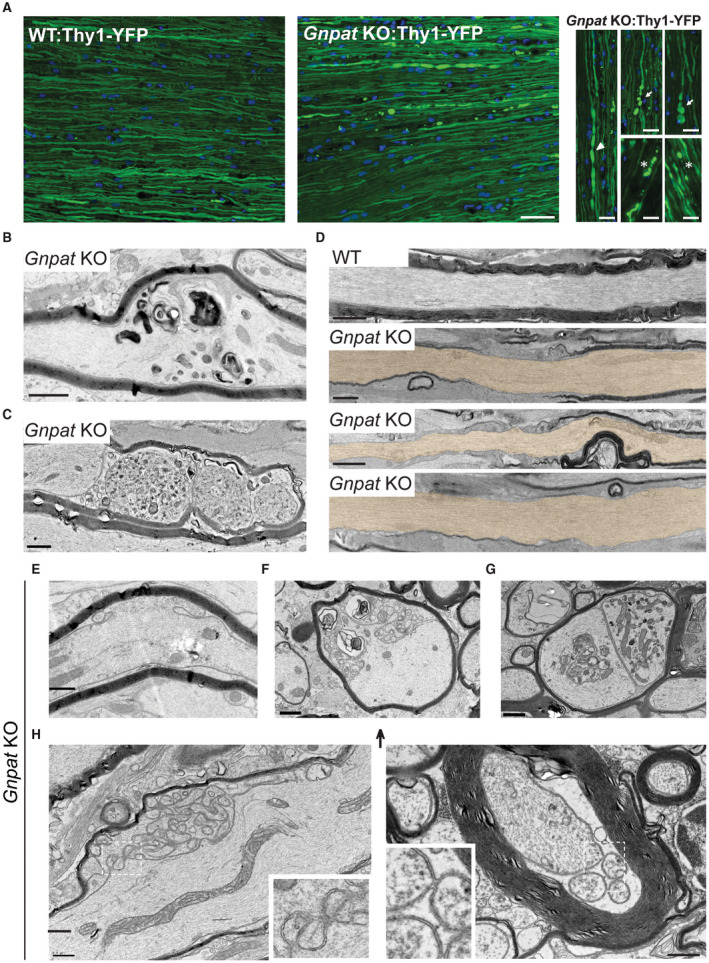
Plasmalogen deficiency causes axonal damage in myelinated axons. A. Fluorescence microscopy analysis of longitudinal sections of spinal cords from 7‐month‐old WT:Thy1‐YFP (n = 3) and Gnpat KO:Thy1‐YFP mice (n = 4). Asterisks and arrowheads highlight signs of axonal damage, including axonal swellings, constrictions axonal degeneration. B‐C. Ultrastructural analysis of spinal cords from Gnpat KO mice at 1.5 years of age (n = 3) revealed axonal swellings with accumulation of organelles (B) and axonal degeneration with severing (C). D. Ultrastructural analysis of longitudinal sections of optic nerves from 1.5‐year‐old WT (n = 3) and Gnpat KO (n = 4) mice highlighted the severe loss of myelin and the sparing of axons (pseudocolored with light brown), which lacked any signs of damage. E‐I. Several abnormal axonal outfoldings with multiple large vesicle‐like structures in spinal cords from Gnpat KO mice (n = 6) at 1.5 years. Scale bars are: A 25 μm in small panels and 50 μm in large panels; B‐I 1 μm.
Combined, these results highlight that a deficiency in plasmalogens modulates regional‐specific axonal damage without causing major axon loss. The optic nerve from plasmalogen‐deficient mice was spared from axonal damage, although it was characterized by an initial severe dysmyelination and the ensuing demyelination. In other regions of the CNS, including the internal capsule, cerebellum and spinal cord, axonal damage was readily observed and was characterized by axonal swelling, severing and abnormal membrane protrusions that seem to accumulate at the adaxonal membrane of mutant oligodendrocytes. Although it is widely thought that myelin loss can modulate and contribute to axonal damage, in plasmalogen‐deficient mice axon damage was observed in myelinated axons, suggesting the existence of an axonal intrinsic, demyelination‐independent defect.
Targeted and differential composition of plasmalogen‐deficient myelin
The deposition of structurally and biochemically normal myelin sheaths around axons is a crucial step for proper myelination. To characterize myelin from plasmalogen‐deficient mice, we quantified the levels of seven myelin markers in purified myelin from WT and Gnpat KO mice (Figure 4). During the period of dysmyelination, the analysis of myelin isolated from 2‐month‐old Gnpat KO mice revealed reduced levels of myelin basic protein (MBP) and septin‐7 (SEPT7) in the spinal cord (Figure 4A,C) and brain (Figure 4B,D). However, the abundance of other myelin markers such as 2′,3′‐cyclic nucleotide 3′‐phosphodiesterase (CNPase), myelin‐associated glycoprotein (MAG), myelin proteolipid protein (PLP), tubulin polymerization promoting protein (TPPP) and tubulin β‐IV were not altered in plasmalogen‐deficient myelin (Figure 4A–D). During the active period of demyelination, myelin isolated from 1.5‐year‐old Gnpat KO mice was still characterized by reduced levels of MBP and SEPT7 in both spinal cord (Figure 4A,C) and brain (Figure 4B,D). However, levels of MAG were drastically decreased (Figure 4C,D), whereas the remaining myelin proteins continued to be unaffected. Overall, these results demonstrate that a deficiency in plasmalogens causes a targeted and differential deficiency in myelin protein composition, and suggest that MAG dysregulation in aged myelin may cause or contribute to the progression of demyelination.
Figure 4.
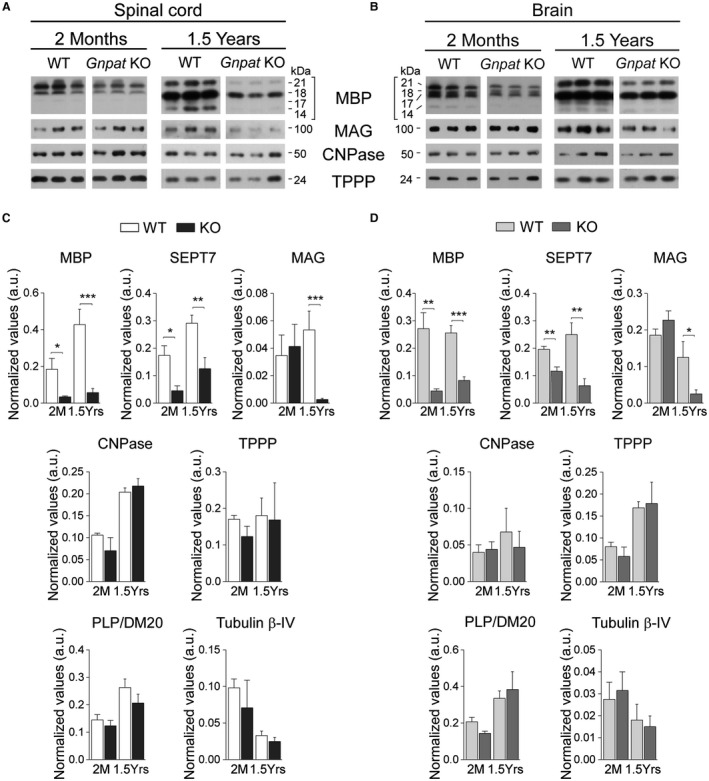
Differential loss of MBP, MAG and SEPT7 in plasmalogen‐deficient myelin. A‐B. Representative western blots of MBP, MAG, CNPase and TPPP in myelin isolated from the spinal cord (A) and brain (B) of 2‐month (n = 5–6 per genotype) and 1.5‐year‐old (n = 5–7 per genotype) WT and Gnpat KO mice. C. Quantification of MBP, MAG, SEPT7, CNPase, TPPP, PLP/DM20 and tubulin β‐IV protein levels normalized to total myelin content in spinal cord myelin. *P = 0.015; **P = 0.005; ***P = 0.0005. D. Quantification of MBP, MAG, SEPT7, CNPase, TPPP, PLP/DM20 and tubulin β‐IV protein levels normalized to total myelin content in brain myelin. *P = 0.014; **P = 0.003; ***P = 0.0001.
Myelination‐incompetent oligodendrocytes are maintained in the CNS of Gnpat KO mice
The recruitment, proliferation and maturation of oligodendrocyte progenitor cells (OPC) are crucial steps for timely myelination but also remyelination 10. To determine if the spatiotemporal regulation of OPC was altered in plasmalogen‐deficient mice, we analyzed the levels of oligodendrocyte transcription factor 2 (Olig‐2) and NG2 chondroitin sulphate proteoglycan (NG2) as markers of OPC 11. Glutathione S‐transferase pi isoform (GSTπ) and Quaking 7 – clone CC1 were used as markers of differentiated oligodendrocytes 12, 34 in spinal cords of WT and Gnpat KO mice. Increased number of Olig2‐ and NG2‐positive cells was observed in the white and grey matter of spinal cords from Gnpat KO mice at 9 months of age (Figure 5A–C), suggesting that OPC respond to demyelination and try to compensate the myelin defects. The quantifications of GSTπ‐ and CC1‐positive oligodendrocytes during the course of the disease revealed normal levels at P21 and increased numbers with the onset of demyelination at 9 months of age, both in the spinal cord and brain (Figure 5D–F). Overall, these results indicate that despite the impaired ability to correctly myelinate the CNS, plasmalogen‐deficient oligodendrocytes undergo a normal differentiation process. In addition, the increased numbers of oligodendrocytes during active demyelination suggest failed attempts to rescue myelination. As evidence of this observation, ultrastructural analysis by electron microscopy revealed the presence of oligodendrocytes in close contact with non‐myelinated axons in the spinal cord and optic nerves from Gnpat KO mice (Figure 5G). Combined, our results demonstrate that a plasmalogen deficiency does not impair the initial differentiation of oligodendrocytes or their ability to respond to myelin loss and that oligodendrocytes still maintain their role in providing trophic support to axons.
Figure 5.
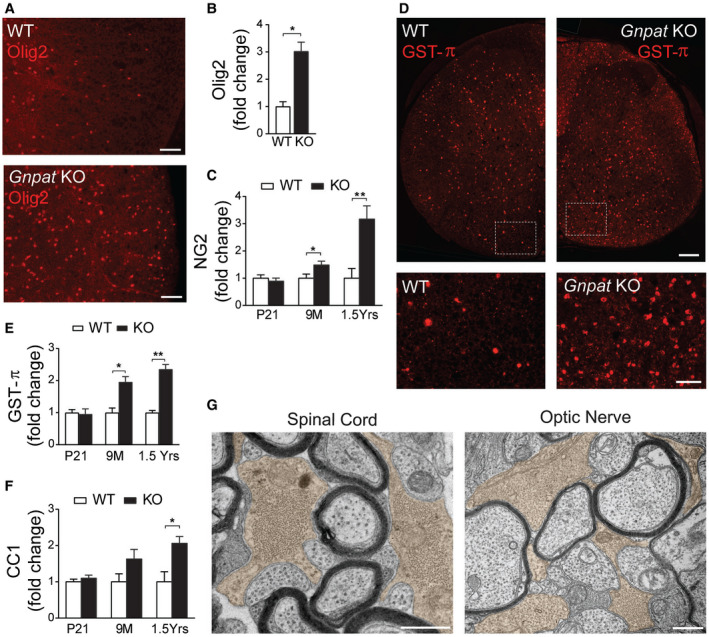
Increased number of OPC and oligodendrocytes during active demyelination in Gnpat KO mice. A. Spinal cord sections from 1.5‐year‐old WT (n = 3) and Gnpat KO (n = 3) mice stained with anti‐Olig2 (red). B. Quantification of Olig2‐positive OPC in spinal cords from 1.5‐year‐old WT (n = 3) and Gnpat KO (n = 3) mice. *P = 0.013. C. Quantification of NG2‐positive OPC in spinal cords from WT and Gnpat KO mice at P21, 9M and 1.5 years old. *P = 0.03, **P = 0.01. D. Spinal cord sections from 1.5‐year‐old WT and Gnpat KO mice stained with GST‐π (red). Bottom panels are zoom‐in of dotted boxes of upper panels. E. Quantification of GST‐π‐positive oligodendrocytes in spinal cords from WT and Gnpat KO mice at P21 (n = 3 each genotype), 9M (n = 6–7 each genotype) and 1.5 years old (n = 6–7 each genotype). *P = 0.0017, **P = 0.0001. F. Quantification of CC1‐positive oligodendrocytes in spinal cords from WT and Gnpat KO mice (n = 3 each genotype) at P21, 9M and 1.5 years old. *P = 0.02. G. Ultrastructural analysis by electron microscopy of the spinal cord and optic nerve from Gnpat KO mice (n = 4) revealed the presence of oligodendrocytes (pseudocolored with light brown) associated with non‐myelinated axons. Scale bars are 50 μm in A; 130 μm in large panels and 50 μm in small panels in C; 0.5 μm in E.
Plasmalogen deficiency affects the intrinsic capacity of oligodendrocytes to myelinate
To better characterize the process of oligodendrocyte development, we setup an in vitro myelination assay using a co‐culture system of embryonic cortical neurons and glial cells 29. In this co‐culture system, we were able to identify four types of oligodendrocytes: highly branched pre‐myelinating oligodendrocytes with low MBP expression (Figure 6A), pre‐myelinating oligodendrocytes with high MBP expression (Figure 6A), myelinating oligodendrocytes with reduced branching and displaying myelin segments (Figure 6A) and degenerating oligodendrocytes with abnormal morphology and fragmented processes. Quantification of the different populations of oligodendrocytes was performed in WT and Gnpat KO co‐cultures at 20 days in vitro (DIV20) (Figure 6B). No significant differences were observed in pre‐myelinating oligodendrocytes expressing low levels of MBP or in degenerating oligodendrocytes. However, in Gnpat KO co‐cultures, we observed an increase in branched oligodendrocytes with high levels of MBP and significant decrease in myelinating oligodendrocytes (Figure 6A,B). In addition, we observed that the few myelinating oligodendrocytes in Gnpat KO co‐cultures displayed shorter myelin segments (Figure 6A). Measurement of the myelin segment length was reduced in Gnpat KO co‐cultures (Figure 6C). Corroborating the in vivo findings, these results indicate that a plasmalogen deficiency affected oligodendrocyte differentiation during the final stages of maturation with a halted initiation of myelin sheaths.
Figure 6.
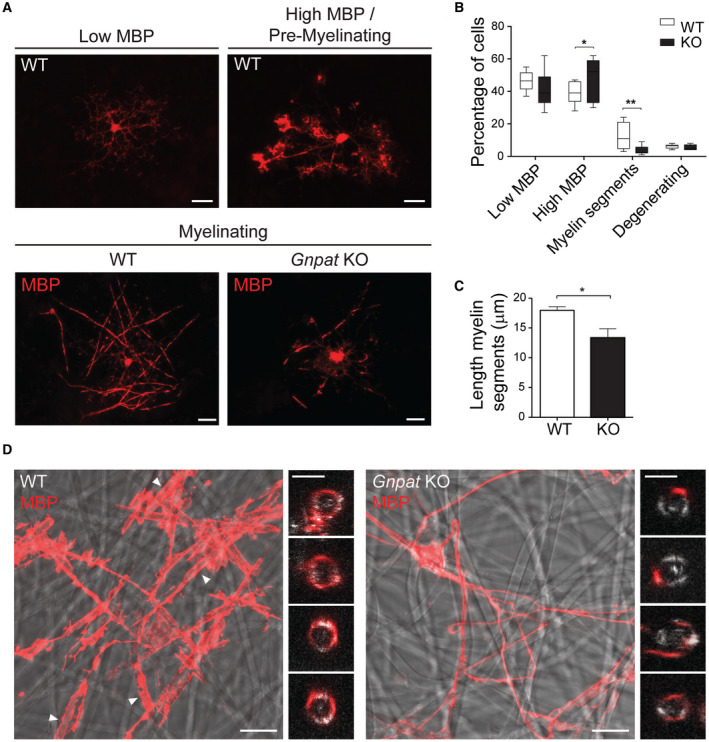
In vitro myelination assays reveal oligodendrocyte intrinsic defects. A. In vitro myelination of mixed cortical co‐cultures from WT and KO mice at DIV20. Oligodendrocytes were stained with anti‐MBP (red). Highly ramified pre‐myelinating oligodendrocytes contained low or high levels of MBP (upper panels), whereas myelinating oligodendrocytes displayed reduced branches and myelin segments (bottom panels). Scale bars are 20 μm. B. Quantification of oligodendrocytes during different stages of differentiation in WT and Gnpat KO co‐cultures (n = 4 for each genotype). Data presented as boxes that extend from the 25th to 75th percentiles, with a line at the mean. Whiskers represent the minimal and maximal values. *P = 0.04; **P = 0.006 using Student’s T test. C. Quantification of the length of myelin segments in myelinating oligodendrocytes from WT and Gnpat KO mice (n = 4 for each genotype). *P = 0.014. Data presented as mean + SEM and compared using Student’s T test. D. Confocal images of oligodendrocytes from WT and Gnpat KO mice (n = 3 for each genotype) at DIV12 plated onto electrospun poly‐L‐lactide microfibers and immunolabeled for MBP (red). Myelin segments produced by WT oligodendrocytes are highlighted with arrowheads. Small panels on the right of WT and Gnpat KO images are magnified and cross‐sectional (xz) views of WT oligodendrocytes engulfing microfibers and Gnpat KO oligodendrocytes extending single processes that do not engulf the microfiber. Scale bars are 20 μm in large panels and 4 μm in small panels.
In order to distinguish between oligodendrocyte‐driven vs. axon‐instructed defects, we cultured mouse primary cortical oligodendrocytes on electrospun poly‐L‐lactide microfibers. In this neuron‐free and three‐dimensional culture system, the microfibers serve as a scaffold for oligodendrocytes to extend and wrap their processes around them 30. After DIV12, we analyzed the differentiation of WT and Gnpat KO oligodendrocytes and their ability to myelinate the microfibers. We observed that WT oligodendrocytes were able to ensheath and wrap the microfibers, with the formation of thick MBP segments (Figure 6D). Oligodendrocytes from Gnpat KO mice, despite being able to extend processes, were not capable of wrapping the microfibers (Figure 6D). In summary, these results demonstrate that the lack plasmalogens affects the intrinsic capacity of oligodendrocytes to myelinate.
A new alkyl glycerol is able to rescue myelination defects
Ether‐linked glycerols (alkyl glycerols) are known to enter the plasmalogen biosynthetic pathway after the peroxisomal steps (Figure 7A), and can serve as alternative precursors to rescue the biochemical defect 19, 44. Using the in vitro myelination system, we evaluated the ability of two commonly used alkyl glycerols to rescue the myelination defect of Gnpat KO oligodendrocytes. WT and Gnpat KO co‐cultures were treated with a mixture of batyl and chimyl alcohol (BA and CA). The treatment with BA and CA was not able to rescue myelination in Gnpat KO co‐cultures, which continued to present decreased number of myelinating oligodendrocytes and reduced number of small myelin segments (Supplemental Figure 5). The development of the in vitro myelination system allowed us to test the potential of other alkyl glycerols as functional alternative precursors of plasmalogens. We assayed the potential of glyceryl 1‐myristyl ether (1‐O‐tetradecyl‐sn‐glycerol; 1‐O‐TDG), an alkyl glycerol with a shorter C14 alkyl chain. To assay the potential of 1‐O‐TDG as a plasmalogen precursor, we measured plasmalogen levels in WT and Gnpat KO fibroblasts. Fibroblasts were chosen because of their generalized usage in assays with alkyl glycerols and to circumvent the inability to obtain sufficient amounts of primary oligodendrocytes necessary for the biochemical assays. As expected, treatment of Gnpat KO cells with 1‐O‐TDG was not able to rescue plasmalogens with C16:0, C18:1 and C18:0 at the sn‐1 position (Figure 7B and C). However, 1‐O‐TDG was successfully converted into plasmalogens with C14:0 at the sn‐1 position (Figure 7B and D) and boosted the plasmalogen levels in Gnpat KO fibroblasts when compared to WT fibroblasts (Figure 7E).
Figure 7.
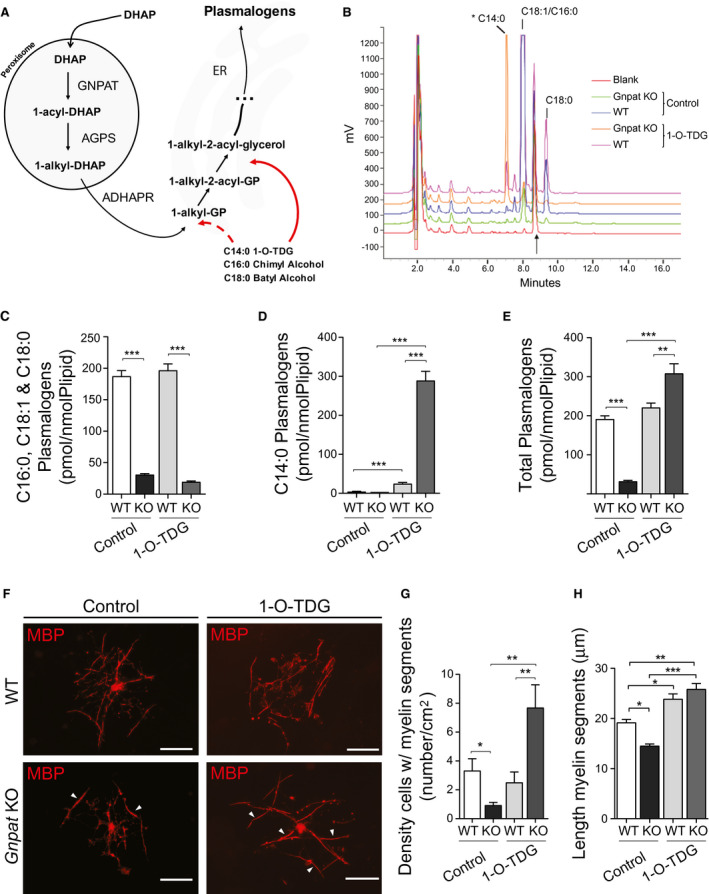
Identification of 1‐O‐tetradecylglycerol as a new alkyl glycerol capable of rescuing myelination defects. A. Schematic representation highlighting the routes at which alkyl glycerols can enter the plasmalogen biosynthesis to rescue defects in the peroxisomal steps. Alkyl glycerols can be phosphorylated (dotted arrow) to generate 1‐alkyl‐glycero‐3‐phosphate (GP) or acylated (arrow) to generate 1‐alkyl‐2‐acyl‐glycerol. DHAP: dihydroxyacetone phosphate; ADHAPR: acylglycerone‐phosphate reductase. B. Representative chromatograms of lipid extracts from WT and Gnpat KO fibroblasts either control or 1‐O‐TDG treated, subjected to RP‐HPLC and detected by fluorimetry. The arrow denotes heptadecanal, used as internal standard. The major peaks in WT fibroblasts correspond to octadecenal (C18:1), eluting ahead of hexadecanal (C16:0) and octadecanal (C18:0). The asterisk indicates the elution of the tetradecanal (C14:0) derivative, only present in samples treated with 1‐O‐TDG. C‐E. Quantification of plasmalogens in fibroblasts from WT and Gnpat KO mice under control conditions (n = 3–5 per genotype) and after 1‐O‐TDG treatment (n = 5 per genotype). C. Levels of plasmalogens containing C16:0, C18:1 and C18:0; ***P < 0.0001. D. Levels of plasmalogens containing C14:0.; ***P < 0.0001. E. Total levels of plasmalogens (containing C14:0, C16:0; C18:1 and C18:0; **P = 0.011, ***P < 0.001. F. in vitro myelination of mixed cortical cultures from WT and KO mice (n = 3 each genotype) at DIV20 treated with 1‐O‐TDG or control, and immunostained for MBP (red). Myelin segments are highlighted with arrowheads. Scale bars are 50 μm. G. Quantification of the myelinating oligodendrocytes in control‐ and 1‐O‐TDG‐treated co‐cultures from WT and Gnpat KO mice (n = 3 each genotype). *P = 0.03, **P = 0.01. H. Quantification of the length of myelin segments in control‐ and 1‐O‐TDG‐treated co‐cultures from WT and Gnpat KO mice (n = 3 each genotype). *P = 0.02, **P = 0.0024, ***P < 0.0001.
In addition, using in vitro myelination cultures, treatment with 1‐O‐TDG was able to rescue myelination in Gnpat KO co‐cultures, as evidenced by the assembly of long myelin segments (Figure 7F, H) and the increased density of myelinating oligodendrocytes (Figure 7G). Combined, these results provide evidence of a differential ability of oligodendrocytes to use different alkyl glycerols as precursors in the biosynthesis of plasmalogens. 1‐O‐TDG was identified as a new alkyl glycerol that can rescue plasmalogen levels and the intrinsic myelination defect of plasmalogen‐deficient oligodendrocytes.
To validate the usage of 1‐O‐TDG as a potential therapeutic agent, we treated WT and Gnpat KO mice with either vehicle (1% Tween‐80 in saline) or 1‐O‐TDG in vehicle at a dosage of 5 mg/kg. The treatments were administered via subcutaneous injections from P1 to P8 and via intraperitoneal injections from P10 to P18 (Figure 8A). At the start of the treatment, Gnpat KO mice displayed reduced body weight (Figure 8B), a feature of plasmalogen deficiency in mice 14, 15. However, at the end of the treatment, 1‐O‐TDG‐treated Gnpat KO mice had normal body weight (Figure 8C) indicative of the improvement on the general well‐being, similar to that observed with batyl alcohol 14. The histopathological analysis of nervous tissues from Gnpat KO mice treated with 1‐O‐TDG revealed a generalized rescue in myelination. Histological analysis of myelinated fibers in the dorsal column tract revealed improvements in myelination and axon radial growth (Figure 8D), and in the ventral funiculus the density of myelinated axons was normalized in Gnpat KO mice (Figure 8E). In optic nerves, the region most affected by a plasmalogen deficiency (Figure 1A, Figure 2H), the treatment with 1‐O‐TDG was able to normalize the densities of myelinated axons (Figure 8F) and un‐myelinated axons (Figure 8G) to values observed in control‐treated WT mice. During this period of active myelination, WT mice treated with 1‐O‐TDG also displayed increased number of myelinated axons (Figure 8F). We also addressed if the treatment with 1‐O‐TDG could rescue the myelination defects observed in the peripheral nervous system (PNS) 17. Treatment with 1‐O‐TDG rescued the impaired myelination observed in sciatic nerves from Gnpat KO mice (Figure 8H). The treatment also induced myelination in sciatic nerves from WT mice with significant decreases in g‐ratio (Figure 8H). Combined, these results demonstrate the ability of 1‐O‐TDG to rescue the myelination defects observed in the CNS and PNS of plasmalogen‐deficient mice.
Figure 8.
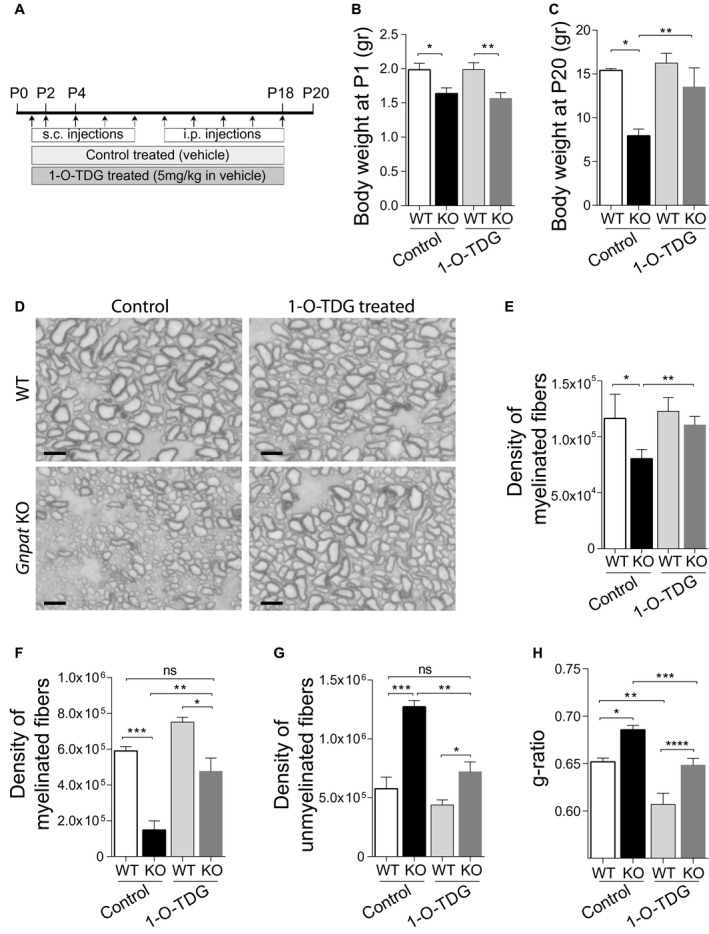
Treatment with 1‐O‐tetradecylglycerol rescues in vivo myelination defects. A. Schematic representation of in vivo treatments. WT and Gnpat KO mice were treated from P1 to P18 with 1‐O‐TDG or control vehicle (n = 3 each genotype and treatment). From postnatal day 1 (P1) to P8, treatments were delivered via subcutaneous (s.c.) injections and from P10 to P18 via intraperitoneal (i.p.) injections. Tissues were collected at P20. B. Body weight at the start of treatment. *P = 0.022, ***P = 0.012. C. Body weight at the end of treatment (P20). *P = 0.0004, **P = 0.0037. D. Light microscopy images of dorsal column track stained with PPD from control‐ and 1‐O‐TDG‐treated WT and Gnpat KO mice at P20. Scale bars are 5 μm. E. Quantification of myelinated fibers in the ventral funiculus, of control‐ and 1‐O‐TDG‐treated, WT and Gnpat KO spinal cords at P20. *P = 0.031, **P = 0.014. F. Quantification of myelinated fibers in optic nerves from of control‐ and 1‐O‐TDG‐treated WT and Gnpat KO mice at P20. *P = 0.011, **P = 0.0083, ***P = 0.0009. G. Quantification of unmyelinated fibers in optic nerves from of control‐ and 1‐O‐TDG‐treated WT and Gnpat KO mice at P20. *P = 0.040, **P = 0.0014, ***P = 0.0028. H. Quantification of myelination by determination of g‐ratio in sciatic nerves from of control‐ and 1‐O‐TDG‐treated WT and Gnpat KO mice at P20. *P = 0.0049, **P = 0.0017, ***P = 0.0066, ****P = 0.0073.
Discussion
Here, we unraveled the role of plasmalogens in CNS myelin and during myelination using a mouse model for RCDP. We demonstrate that differentiated oligodendrocytes are the prime target of a deficiency in plasmalogens causing impaired myelination and myelin maintenance. During development, OPC migrate to reach their final destination and terminate their differentiation into myelin‐forming oligodendrocytes 50. The regulation of these two processes is crucial to ensure adequate numbers of OPC, and consequently appropriate numbers of myelinating oligodendrocytes 33. Assessment of OPC and oligodendrocyte numbers during the early postnatal period revealed normal densities in spinal cords and optic nerves from Gnpat KO mice, suggesting that impaired myelination was not caused by defects in OPC migration. The lack of plasmalogens in oligodendrocytes from Gnpat KO mice did not affect the initial stages of differentiation. Oligodendrocytes from Gnpat KO mice expressed GST‐π and CC1, markers of mature oligodendrocytes 11, and in vitro assays showed normal oligodendrocyte development up to the final stages of maturation and myelin assembly. The dynamic interplay of the intrinsic mechanisms in oligodendrocytes and axon‐derived extrinsic signals are crucial steps for the suitable balance between differentiation and myelination 20. Several extrinsic signals derived from axons impact oligodendrocytes’ terminal differentiation 25, promote myelination 9 or regulate myelin thickness 48. Using in vitro myelination assays, we identified that only a reduced number of plasmalogen‐deficient oligodendrocytes are able to assemble shorter and scarcer myelin sheaths around axons. Using scaffolds of microfibers, we were able to unravel that the defect in assembling myelin sheaths was caused by a compromised intrinsic capacity of plasmalogen‐deficient oligodendrocytes to ensheath and assemble myelin segments.
In adult mice, the lack of plasmalogens continued to have a negative impact on myelin content throughout the CNS, as evidenced by reduced g‐ratio and the progressive increase in the density of axons lacking myelin sheaths. These myelin defects correlate with the neurological phenotype of Gnpat KO mice. From the age of 9 months, Gnpat KO mice start developing a severe and progressive neurological condition that includes tremors and generalized ataxia. This phenotype worsens after 1 year of age with increased tremor frequency and limb paralysis. This led us to hypothesize that altered myelin composition could contribute to failure in attaining correct myelination and the sustainment of myelin. Differential expression MBP, SEPT7 and MAG was observed in plasmalogen‐deficient myelin. Decreased levels of MBP and SEPT7 were observed during initial hypomyelination. MBP is known to be essential in initiating and driving the axonal wrapping process, myelin compaction and the maintenance of the physical stability of the sheaths 45, 57. Interestingly, plasmalogens and MBP are the two major constituents of myelin at the cytoplasmic apposition 1, 28. Thus, the complete absence of plasmalogens, together with the decreased levels of MBP, could be the major cause of inadequate formation of the myelin sheath, and consequently impaired myelination. The enrichment of septins in mature myelin 22, 26, 58, together with the reported importance of septins in myelin disorders, reflects a general association between the abundance of septins and myelin pathology. Recently, it has been described that the presence of myelin outfoldings, a common feature observed in several myelin‐related disorders, correlates with a loss of cytoskeletal septins in myelin 40. Septin filaments are localized to the non‐compacted adaxonal myelin compartment and were judged to be important for scaffolding the axon/myelin unit at a later stage of myelin maturation 40. Here we reported that plasmalogen‐deficient myelin is characterized by reduced levels of SEPT7. The association of septins with phospholipids was found to be crucial for the formation and maintenance of membrane domains 7. Our results underscore a possible role of plasmalogens on correct septin location. Moreover, the intimate relationship between septins and actin cytoskeleton 23, 47, together with the well‐known function of actin on myelination 37, 60, may also correlate the decreased levels of SEPT7 and defective myelination.
Whereas MBP and SEPT7 levels were consistently reduced in plasmalogen‐deficient myelin, the levels of MAG display an additional differential pattern of expression. During the period of hypomyelination, MAG levels were normal in myelin from Gnpat KO mice but during the period of demyelination MAG levels decreased in plasmalogen‐deficient myelin. MAG is a myelin protein preferentially expressed on the innermost myelin wrap, adjacent to the axon 49. Analysis of MAG‐null mutants revealed a surprisingly subtle phenotype, which included mild myelin abnormalities and the lack of a periaxonal cytoplasmic collar 8, 35. These observations suggest that MAG plays a role in stabilizing oligodendrocyte‐axon contacts in mature myelin sheaths, which may be involved in the long‐term stability of axons 43. Therefore, the decreased levels of MAG in plasmalogen‐deficient myelin may disturb the myelin‐axon stability and lead to the development of axonal outfoldings observed in Gnpat KO axons. Combined with the reduced levels of SEPT7, we hypothesize that the abnormal myelin composition observed in aged Gnpat KO mice could be the trigger for demyelination and for the engulfment of axonal protrusions that result in the accumulation of vesicle‐like structures.
Demyelination was observed throughout the CNS, although different degrees of severity were noted. In addition, we observed that severe demyelination did not cause major axonal loss, suggesting an unaltered trophic support capacity by mutant oligodendrocytes. Notably, whereas the optic nerve was the most severely affected CNS region with regard to myelin content, it completely lacked signs of axonal loss or damage. Therefore, and contrary to previous claims 42, no axon degeneration was observed in optic nerves from plasmalogen‐deficient mice. However, axonal damage occurred with an apparent regional specificity since axonal damage was more prominent in other CNS areas (eg, spinal cord, cerebellar white matter and internal capsule). The presence of hallmark signs of axonal damage (eg, axonal swellings with accumulation of organelles) in myelinated axons and in regions with moderate myelin defects (eg, cerebellar white matter) suggests a demyelination‐independent contribution to the sustainment of healthy axons. Therefore, we hypothesize that a plasmalogen deficiency may differentially affect different subsets of neurons or that subtle alterations in myelin content or composition may affect these subsets of neurons leading to axonal dysfunction.
Treatment options able to rescue the biochemical or pathologic defects caused by a plasmalogen defect are scarce 14, 19. Although in vitro studies have shown that the alkyl glycerols BA or CA are able to restore plasmalogen levels, a previous study showed that their effectiveness in vivo excludes the central and peripheral nervous systems 14. Treatment using BA as a plasmalogen precursor proved to be effective on systemic tissues, but inefficient on the nervous system. A possible contribution of the blood‐brain barrier (BBB) in the CNS could explain the inability of BA to normalize plasmalogen levels in the brain and spinal cord. Using the in vitro myelination system, we assayed the potential of BA and CA to rescue myelination defects in Gnpat KO oligodendrocytes. Our results demonstrate that these alkyl glycerols are not capable of restoring myelination even in the absence of a functional BBB. The feasibility of the in vitro myelination assays allowed us to test and validate the potential of other alkyl glycerols in rescuing CNS defects. We identified 1‐O‐TDG as a functional alkyl glycerol capable of rescuing plasmalogen levels in Gnpat KO cells and capable of rescuing the differentiation and myelination potential of Gnpat KO oligodendrocytes. Although plasmalogens usually contain C16:0, C18:1 and C18:0 moieties at the sn‐1 position, 1‐0‐heptadecylglycerol (containing a C17:0 alkyl chain) was also shown to be incorporated into plasmalogens 19. Our results demonstrate that shorter alkyl chains can also be incorporated into plasmalogens. In addition, our results suggest that the synthesis of plasmalogens with their characteristic vinyl‐ether bond is more important than the chain length at the sn‐1 position 13. The ability of 1‐O‐TDG to rescue myelination in vivo represents a novel and valid strategy for the development of translatable approaches to rescue plasmalogen levels in the CNS and treatment of the myelination defects observed in RCDP patients 2, 5.
Conflict of interest
The authors have declared that no conflict of interest exists.
Supporting information
Acknowledgements
We thank Paula Sampaio for microscopy support, Paula Magalhães and Tânia Meireles for genotyping, and Sofia Lamas for excellent animal care. We are grateful to Pedro Abreu for his contribution to the analysis of axonal damage. This work was supported by FEDER ‐ Fundo Europeu de Desenvolvimento Regional funds through the NORTE 2020 ‐ Norte Portugal Regional Operational Programme, Portugal 2020 (NORTE‐01‐0145‐FEDER‐030558), and by national funds through the FCT ‐ Fundacao para a Ciencia e a Tecnologia. D. Bessa‐Neto was supported by a fellowship under the project E‐Rare3/0001/2015. P. Brites is an Investigator FCT, and A.R. Malheiro was supported by the FCT (FRH/BD/93110/2013). P.P. Van Veldhoven was supported by the Flemish Fonds voor Wetenschappelijk Onderzoek (FWO/G0D7915N) under the PERescue project of the ERA‐Net for Research Programmes on Rare Diseases.
[Corrections added on 20 September 2019, after first online publication: The Acknowledgement has been updated.]
Data Availability Statement
The data that support the findings of this study are available from the corresponding author upon reasonable request.
Data Availability Statement
The data that support the findings of this study are available from the corresponding author upon reasonable request.
References
- 1. Aggarwal S, Yurlova L, Simons M (2011) Central nervous system myelin: structure, synthesis and assembly. Trends Cell Biol 21:585–593. [DOI] [PubMed] [Google Scholar]
- 2. Alkan A, Kutlu R, Yakinci C, Sigirci A, Aslan M, Sarac K (2003) Delayed myelination in a rhizomelic chondrodysplasia punctata case: MR spectroscopy findings. Magn Reson Imaging 21:77–80. [DOI] [PubMed] [Google Scholar]
- 3. Baglole CJ, Reddy SY, Pollock SJ, Feldon SE, Sime PJ, Smith TJ, Phipps RP (2005) Isolation and phenotypic characterization of lung fibroblasts. Methods Mol Med 117:115–127. [DOI] [PubMed] [Google Scholar]
- 4. Bams‐Mengerink AM, Koelman JH, Waterham H, Barth PG, Poll‐The BT (2013) The neurology of rhizomelic chondrodysplasia punctata. Orphanet J Rare Dis 8:174. [DOI] [PMC free article] [PubMed] [Google Scholar]
- 5. Bams‐Mengerink AM, Majoie CB, Duran M, Wanders RJ, Van Hove J, Scheurer CD et al (2006) MRI of the brain and cervical spinal cord in rhizomelic chondrodysplasia punctata. Neurology 66:798–803; discussion 789. [DOI] [PubMed] [Google Scholar]
- 6. Baroy T, Koster J, Stromme P, Ebberink MS, Misceo D, Ferdinandusse S et al (2015) A novel type of rhizomelic chondrodysplasia punctata, RCDP5, is caused by loss of the PEX5 long isoform. Hum Mol Genet 24:5845–5854. [DOI] [PubMed] [Google Scholar]
- 7. Barral Y, Mermall V, Mooseker MS, Snyder M (2000) Compartmentalization of the cell cortex by septins is required for maintenance of cell polarity in yeast. Mol Cell 5:841–851. [DOI] [PubMed] [Google Scholar]
- 8. Bartsch U (1996) Myelination and axonal regeneration in the central nervous system of mice deficient in the myelin‐associated glycoprotein. J Neurocytol 25:303–313. [DOI] [PubMed] [Google Scholar]
- 9. Bauer NG, Richter‐Landsberg C, Ffrench‐Constant C (2009) Role of the oligodendroglial cytoskeleton in differentiation and myelination. Glia 57:1691–1705. [DOI] [PubMed] [Google Scholar]
- 10. Bergles DE, Richardson WD (2015) Oligodendrocyte development and plasticity. Cold Spring Harb Perspect Biol 8:a020453. [DOI] [PMC free article] [PubMed] [Google Scholar]
- 11. Billon N, Jolicoeur C, Ying QL, Smith A, Raff M (2002) Normal timing of oligodendrocyte development from genetically engineered, lineage‐selectable mouse ES cells. J Cell Sci 115:3657–3665. [DOI] [PubMed] [Google Scholar]
- 12. Bin JM, Harris SN, Kennedy TE (2016) The oligodendrocyte‐specific antibody ‘CC1’ binds Quaking 7. J Neurochem 139:181–186. [DOI] [PubMed] [Google Scholar]
- 13. Braverman NE, Moser AB (2012) Functions of plasmalogen lipids in health and disease. Biochim Biophys Acta 1822:1442–1452. [DOI] [PubMed] [Google Scholar]
- 14. Brites P, Ferreira AS, da Silva TF, Sousa VF, Malheiro AR, Duran M et al (2011) Alkyl‐glycerol rescues plasmalogen levels and pathology of ether‐phospholipid deficient mice. PLoS One 6:e28539. [DOI] [PMC free article] [PubMed] [Google Scholar]
- 15. Brites P, Mooyer PA, El Mrabet L, Waterham HR, Wanders RJ (2009) Plasmalogens participate in very‐long‐chain fatty acid‐induced pathology. Brain 132(Pt 2):482–492. [DOI] [PubMed] [Google Scholar]
- 16. Buchert R, Tawamie H, Smith C, Uebe S, Innes AM, Al Hallak B et al (2014) A peroxisomal disorder of severe intellectual disability, epilepsy, and cataracts due to fatty acyl‐CoA reductase 1 deficiency. Am J Hum Genet 95:602–610. [DOI] [PMC free article] [PubMed] [Google Scholar]
- 17. da Silva TF, Eira J, Lopes AT, Malheiro AR, Sousa V, Luoma A et al (2014) Peripheral nervous system plasmalogens regulate Schwann cell differentiation and myelination. J Clin Invest 124:2560–2570. [DOI] [PMC free article] [PubMed] [Google Scholar]
- 18. da Silva TF, Sousa VF, Malheiro AR, Brites P (2012) The importance of ether‐phospholipids: a view from the perspective of mouse models. Biochim Biophys Acta 1822:1501–1508. [DOI] [PubMed] [Google Scholar]
- 19. Das AK, Holmes RD, Wilson GN, Hajra AK (1992) Dietary ether lipid incorporation into tissue plasmalogens of humans and rodents. Lipids 27:401–405. [DOI] [PubMed] [Google Scholar]
- 20. Emery B (2010) Regulation of oligodendrocyte differentiation and myelination. Science 330:779–782. [DOI] [PubMed] [Google Scholar]
- 21. Feng G, Mellor RH, Bernstein M, Keller‐Peck C, Nguyen QT, Wallace M et al (2000) Imaging neuronal subsets in transgenic mice expressing multiple spectral variants of GFP. Neuron 28:41–51. [DOI] [PubMed] [Google Scholar]
- 22. Fewou SN, Fernandes A, Stockdale K, Francone VP, Dupree JL, Rosenbluth J et al (2010) Myelin protein composition is altered in mice lacking either sulfated or both sulfated and non‐sulfated galactolipids. J Neurochem 112:599–610. [DOI] [PubMed] [Google Scholar]
- 23. Gladfelter AS, Bose I, Zyla TR, Bardes ES, Lew DJ (2002) Septin ring assembly involves cycles of GTP loading and hydrolysis by Cdc42p. J Cell Biol 156:315–326. [DOI] [PMC free article] [PubMed] [Google Scholar]
- 24. Grider MH, Chen Q, Shine HD (2006) Semi‐automated quantification of axonal densities in labeled CNS tissue. J Neurosci Methods 155:172–179. [DOI] [PubMed] [Google Scholar]
- 25. Ishibashi T, Dakin KA, Stevens B, Lee PR, Kozlov SV, Stewart CL, Fields RD (2006) Astrocytes promote myelination in response to electrical impulses. Neuron 49:823–832. [DOI] [PMC free article] [PubMed] [Google Scholar]
- 26. Jahn O, Tenzer S, Werner HB (2009) Myelin proteomics: molecular anatomy of an insulating sheath. Mol Neurobiol 40:55–72. [DOI] [PMC free article] [PubMed] [Google Scholar]
- 27. Khanna AJ, Braverman NE, Valle D, Sponseller PD (2001) Cervical stenosis secondary to rhizomelic chondrodysplasia punctata. Am J Med Genet 99:63–66. [DOI] [PubMed] [Google Scholar]
- 28. Kirschner DA, Ganser AL (1982) Myelin labeled with mercuric chloride. Asymmetric localization of phosphatidylethanolamine plasmalogen. J Mol Biol 157:635–658. [DOI] [PubMed] [Google Scholar]
- 29. Lariosa‐Willingham KD, Rosler ES, Tung JS, Dugas JC, Collins TL, Leonoudakis D (2016) Development of a central nervous system axonal myelination assay for high throughput screening. BMC Neurosci 17:16. [DOI] [PMC free article] [PubMed] [Google Scholar]
- 30. Lee S, Chong SY, Tuck SJ, Corey JM, Chan JR (2013) A rapid and reproducible assay for modeling myelination by oligodendrocytes using engineered nanofibers. Nat Protoc 8:771–782. [DOI] [PMC free article] [PubMed] [Google Scholar]
- 31. McCarthy KD, de Vellis J (1980) Preparation of separate astroglial and oligodendroglial cell cultures from rat cerebral tissue. J Cell Biol 85:890–902. [DOI] [PMC free article] [PubMed] [Google Scholar]
- 32. Mezzar S, de Schryver E, Van Veldhoven PP (2014) RP‐HPLC‐fluorescence analysis of aliphatic aldehydes: application to aldehyde‐generating enzymes HACL1 and SGPL1. J Lipid Res 55:573–582. [DOI] [PMC free article] [PubMed] [Google Scholar]
- 33. Mitew S, Hay CM, Peckham H, Xiao J, Koenning M, Emery B (2014) Mechanisms regulating the development of oligodendrocytes and central nervous system myelin. Neuroscience 276:29–47. [DOI] [PubMed] [Google Scholar]
- 34. Miyamoto N, Maki T, Shindo A, Liang AC, Maeda M, Egawa N et al (2015) Astrocytes promote oligodendrogenesis after white matter damage via brain‐derived neurotrophic factor. J Neurosci 35:14002–14008. [DOI] [PMC free article] [PubMed] [Google Scholar]
- 35. Montag D, Giese KP, Bartsch U, Martini R, Lang Y, Bluthmann H et al. (1994) Mice deficient for the myelin‐associated glycoprotein show subtle abnormalities in myelin. Neuron 13:229–246. [DOI] [PubMed] [Google Scholar]
- 36. Nave KA, Werner HB (2014) Myelination of the nervous system: mechanisms and functions. Annu Rev Cell Dev Biol 30:503–533. [DOI] [PubMed] [Google Scholar]
- 37. Nawaz S, Sanchez P, Schmitt S, Snaidero N, Mitkovski M, Velte C et al (2015) Actin filament turnover drives leading edge growth during myelin sheath formation in the central nervous system. Dev Cell 34:139–151. [DOI] [PMC free article] [PubMed] [Google Scholar]
- 38. Norton WT, Poduslo SE (1973) Myelination in rat brain: changes in myelin composition during brain maturation. J Neurochem 21:759–773. [DOI] [PubMed] [Google Scholar]
- 39. Norton WT, Poduslo SE (1973) Myelination in rat brain: method of myelin isolation. J Neurochem 21:749–757. [DOI] [PubMed] [Google Scholar]
- 40. Patzig J, Erwig MS, Tenzer S, Kusch K, Dibaj P, Mobius W et al (2016) Septin/anillin filaments scaffold central nervous system myelin to accelerate nerve conduction. Elife 5:e17119. [DOI] [PMC free article] [PubMed] [Google Scholar]
- 41. Powers JM, Kenjarski TP, Moser AB, Moser HW (1999) Cerebellar atrophy in chronic rhizomelic chondrodysplasia punctata: a potential role for phytanic acid and calcium in the death of its Purkinje cells. Acta Neuropathol 98:129–134. [DOI] [PubMed] [Google Scholar]
- 42. Rodemer C, Thai TP, Brugger B, Kaercher T, Werner H, Nave KA et al (2003) Inactivation of ether lipid biosynthesis causes male infertility, defects in eye development and optic nerve hypoplasia in mice. Hum Mol Genet 12:1881–1895. [DOI] [PubMed] [Google Scholar]
- 43. Schachner M, Bartsch U (2000) Multiple functions of the myelin‐associated glycoprotein MAG (siglec‐4a) in formation and maintenance of myelin. Glia 29:154–165. [DOI] [PubMed] [Google Scholar]
- 44. Schrakamp G, Schalkwijk CG, Schutgens RB, Wanders RJ, Tager JM, van den Bosch H (1988) Plasmalogen biosynthesis in peroxisomal disorders: fatty alcohol versus alkylglycerol precursors. J Lipid Res 29:325–334. [PubMed] [Google Scholar]
- 45. Snaidero N, Velte C, Myllykoski M, Raasakka A, Ignatev A, Werner HB et al (2017) Antagonistic functions of MBP and CNP establish cytosolic channels in CNS myelin. Cell Rep 18:314–323. [DOI] [PMC free article] [PubMed] [Google Scholar]
- 46. Snyder F (1999) The ether lipid trail: a historical perspective. Biochim Biophys Acta 1436:265–278. [DOI] [PubMed] [Google Scholar]
- 47. Spiliotis ET, Nelson WJ (2006) Here come the septins: novel polymers that coordinate intracellular functions and organization. J Cell Sci 119(Pt 1):4–10. [DOI] [PMC free article] [PubMed] [Google Scholar]
- 48. Taveggia C, Thaker P, Petrylak A, Caporaso GL, Toews A, Falls DL et al (2008) Type III neuregulin‐1 promotes oligodendrocyte myelination. Glia 56:284–293. [DOI] [PubMed] [Google Scholar]
- 49. Trapp BD, Andrews SB, Cootauco C, Quarles R (1989) The myelin‐associated glycoprotein is enriched in multivesicular bodies and periaxonal membranes of actively myelinating oligodendrocytes. J Cell Biol 109:2417–2426. [DOI] [PMC free article] [PubMed] [Google Scholar]
- 50. Trapp BD, Nishiyama A, Cheng D, Macklin W (1997) Differentiation and death of premyelinating oligodendrocytes in developing rodent brain. J Cell Biol 137:459–468. [DOI] [PMC free article] [PubMed] [Google Scholar]
- 51. Trapp BD, Peterson J, Ransohoff RM, Rudick R, Mork S, Bo L (1998) Axonal transection in the lesions of multiple sclerosis. N Engl J Med 338:278–285. [DOI] [PubMed] [Google Scholar]
- 52. Van Veldhoven PP, Bell RM (1988) Effect of harvesting methods, growth conditions and growth phase on diacylglycerol levels in cultured human adherent cells. Biochim Biophys Acta 959:185–196. [DOI] [PubMed] [Google Scholar]
- 53. Van Veldhoven PP, Mannaerts GP (1987) Inorganic and organic phosphate measurements in the nanomolar range. Anal Biochem 161:45–48. [DOI] [PubMed] [Google Scholar]
- 54. Vanderver A, Prust M, Tonduti D, Mochel F, Hussey HM, Helman G et al (2015) Case definition and classification of leukodystrophies and leukoencephalopathies. Mol Genet Metab 114:494–500. [DOI] [PMC free article] [PubMed] [Google Scholar]
- 55. Wanders RJ, Waterham HR (2006) Biochemistry of mammalian peroxisomes revisited. Annu Rev Biochem 75:295–332. [DOI] [PubMed] [Google Scholar]
- 56. Watkins TA, Emery B, Mulinyawe S, Barres BA (2008) Distinct stages of myelination regulated by gamma‐secretase and astrocytes in a rapidly myelinating CNS coculture system. Neuron 60:555–569. [DOI] [PMC free article] [PubMed] [Google Scholar]
- 57. Weil MT, Mobius W, Winkler A, Ruhwedel T, Wrzos C, Romanelli E et al (2016) Loss of myelin basic protein function triggers myelin breakdown in models of demyelinating diseases. Cell Rep 16:314–322. [DOI] [PMC free article] [PubMed] [Google Scholar]
- 58. Werner HB, Kuhlmann K, Shen S, Uecker M, Schardt A, Dimova K et al (2007) Proteolipid protein is required for transport of sirtuin 2 into CNS myelin. J Neurosci 27:7717–7730. [DOI] [PMC free article] [PubMed] [Google Scholar]
- 59. White AL, Modaff P, Holland‐Morris F, Pauli RM (2003) Natural history of rhizomelic chondrodysplasia punctata. Am J Med Genet A 118A:332–342. [DOI] [PubMed] [Google Scholar]
- 60. Zuchero JB, Fu MM, Sloan SA, Ibrahim A, Olson A, Zaremba A et al (2015) CNS myelin wrapping is driven by actin disassembly. Dev Cell 34:152–167. [DOI] [PMC free article] [PubMed] [Google Scholar]
Associated Data
This section collects any data citations, data availability statements, or supplementary materials included in this article.
Supplementary Materials
Data Availability Statement
The data that support the findings of this study are available from the corresponding author upon reasonable request.