

Abstract
Oxidative stress (OS) occurs in brains of patients with epilepsy and coincides with brain inflammation, and both phenomena contribute to seizure generation in animal models. We investigated whether expression of OS and brain inflammation markers co‐occurred also in resected brain tissue of patients with epileptogenic cortical malformations: hemimegalencephaly (HME), focal cortical dysplasia (FCD) and cortical tubers in tuberous sclerosis complex (TSC). Moreover, we studied molecular mechanisms linking OS and inflammation in an in vitro model of neuronal function. Untangling interdependency and underlying molecular mechanisms might pose new therapeutic strategies for treating patients with drug‐resistant epilepsy of different etiologies. Immunohistochemistry was performed for specific OS markers xCT and iNOS and brain inflammation markers TLR4, COX‐2 and NF‐κB in cortical tissue derived from patients with HME, FCD IIa, IIb and TSC. Additionally, we studied gene expression of these markers using the human neuronal cell line SH‐SY5Y in which OS was induced using H2O2. OS markers were higher in dysmorphic neurons and balloon/giant cells in cortex of patients with FCD IIb or TSC. Expression of OS markers was positively correlated to expression of brain inflammation markers. In vitro, 100 µM, but not 50 µM, of H2O2 increased expression of TLR4, IL‐1β and COX‐2. We found that NF‐κB signaling was activated only upon stimulation with 100 µM H2O2 leading to upregulation of TLR4 signaling and IL‐1β. The NF‐κB inhibitor TPCA‐1 completely reversed this effect. Our results show that OS positively correlates with neuroinflammation and is particularly evident in brain tissue of patients with FCD IIb and TSC. In vitro, NF‐κB is involved in the switch to an inflammatory state after OS. We propose that the extent of OS can predict the neuroinflammatory state of the brain. Additionally, antioxidant treatments may prevent the switch to inflammation in neurons thus targeting multiple epileptogenic processes at once.
Keywords: epilepsy, focal cortical dysplasia, hemimegalencephaly, inflammation, oxidative stress, tuberous sclerosis complex
Abbreviations
- ARE
antioxidant response element
- AKT
protein kinase B
- C1ORF43
chromosome 1 open reading frame 43
- CAT
catalase
- COX‐2
cyclooxygenase 2
- DAB
3,3′‐diaminobenzidine
- DCF
2′,7′‐dichlorofluorescein
- DMEM
Dulbecco’s modified Eagle’s medium
- EF1α
elongation factor 1α
- F
frontal
- FA
focal aware
- FB
focal to bilateral
- FCD
focal cortical dysplasia
- FCS
fetal calf serum
- FIA
focal impaired awareness
- GPx
glutathione peroxidase
- HO‐1
heme oxygenase
- H2DCF‐DA
2′,7′‐dichlorofluorescein diacetate
- HME
hemimegalencephaly
- HMGB‐1
high mobility group box 1
- I
insular
- iNOS
inducible nitric oxide synthase
- IL‐1β
interleukin 1β
- IRAK1/2
interleukin 1 receptor associated kinase 1/2
- IRS
immuno reactivity score
- KEAP‐1
Kelch like ECH associated protein
- MAPK
mitogen activated protein kinase
- MCD
malformations of cortical development
- MTT
3‐(4,5‐dimethylthiazol‐2‐yl)‐2,5‐diphenyl tetrazolium bromide
- MYD88
adapter myeloid differentiation primary response 88
- NF‐κB
nuclear factor kappa‐light‐chain‐enhancer of activated B cells
- NO
nitric oxide
- Nrf‐2
nuclear factor erythroid 2 like 2
- O
occipital
- OS
oxidative stress
- PBS
phosphate buffered saline
- ROS
reactive oxygen species
- SOD
superoxide dismutase
- T
temporal
- TAB2
TGF‐β activated kinase 1/MAP3K7 binding protein 2
- TC
tonic‐clonic
- TIR
Toll/interleukin‐1 receptor
- TLE‐HS
temporal lobe epilepsy with hippocampal sclerosis
- TLR4
Toll like receptor 4
- TRAF6
TNF receptor associated factor 6
- TSC
tuberous sclerosis complex
- xCT
solute carrier family 7 member 11
Background
Oxidative stress (OS) and brain inflammation are closely related phenomena and they are often found concomitantly in various neurological disorders including epilepsy 2, 13, 69. Various studies support the existence of a self‐sustaining cycle between OS generation and brain inflammation 10, 13, 68. Neurons are specifically vulnerable to oxidative damage because of their post‐mitotic state and high metabolic demand 67. Recently, the presence of OS was shown in resected brain tissue of patients with temporal lobe epilepsy and hippocampal sclerosis (TLE‐HS). Furthermore, antioxidant treatment in models of acquired epilepsy significantly improved disease outcomes 45, 50, 51, 53. This suggests that patients with epileptic syndromes might benefit from antioxidant therapies. To test if OS is also a common mechanism induced in other epileptogenic pathologies, we studied the presence of OS markers in resected cortical tissue from patients suffering from hemimegalencephaly (HME), focal cortical dysplasia (FCD) type IIa, type IIb or tuberous sclerosis complex (TSC). Moreover, we investigated the molecular mechanisms potentially linking OS and brain inflammation.
OS is defined as an imbalance in the cellular redox state because of impairment of antioxidant scavenging mechanisms and an increase in reactive oxygen (ROS) and nitrogen species formation. In physiological conditions, ROS can serve different roles depending on the cellular context as they are important sensors in many cellular processes 62. High concentrations of ROS act as cytotoxic agents causing irreversible damage via oxidation of lipids, protein and DNA 61, and they may contribute to drug‐resistance in epilepsy 23. Additionally, nitric oxide (NO) derived from the inducible NOS (iNOS) can further exacerbate OS by reacting with superoxide anions (O2 −) to form highly reactive oxidant peroxynitrite (ONOO−) that damages cell macromolecules similar to ROS 48. The cell possesses a multitude of antioxidant mechanisms that can buffer ROS, in order to protect the cell from oxidative damage. These include the enzymes superoxide dismutase (SOD), catalase (CAT) and glutathione peroxidase (GPx). SOD catalyzes the dismutation of superoxide anions (O2 −) originating from cellular respiration to molecular oxygen (O2) and hydrogen peroxide (H2O2), which can be converted by CAT and GPx to H2O 71. In addition, other endogenous antioxidant signaling pathways exist like the redox sensitive nuclear factor erythroid 2 like 2 (Nrf‐2) 47. Nrf‐2 is a transcription factor that under increased OS conditions dissociates from its cytoplasmatic repressor protein Kelch like ECH associated protein 1 (KEAP1), thereby moving to the nucleus where it binds to antioxidant response elements (ARE) in the promotor region of antioxidant genes such as heme oxygenase 1 (HO‐1) and solute carrier family 7 member 11 (xCT) 24, 40, 47. Importantly, activation of the aforementioned antioxidant defense system is closely associated with inflammatory signaling in the cell.
The nuclear factor kappa‐light‐chain‐enhancer of activated B cells (NF‐κB) transcription factor family enables cells to respond to a wide variety of stimuli with an inflammatory response. The NF‐κB pathway is facilitated by stimulation of Toll‐like receptor 4 (TLR4) via a well characterized pathway. TLR4 plays an important role in initiating inflammatory responses and has been shown to critically contribute to seizure development 43. Importantly, disulfide high mobility group box‐1 (HMGB‐1), a protein associated with ictogenesis, is generated under OS and it was shown to bind TLR4 to promote seizures and excitoxicity 43. Upon HMGB‐1 stimulation, TLR4 associates with the adapter myeloid differentiation primary response 88 (MyD88) via the Toll/interleukin‐1 receptor (TIR) domain followed by the recruitment and activation of signaling molecules like interleukin 1 receptor associated kinase 1 (IRAK1), IRAK2, TNF receptor associated factor 6 (TRAF6) and TGF‐β activated kinase 1/MAP3K7 binding protein 2 (TAB2). These signaling molecules promote the activation and translocation of the transcription factor NF‐κB and consequently expression of pro‐inflammatory mediators such as interleukin‐1 β (IL‐1β) and cyclooxygenase‐2 (COX‐2) 14, 27, 32. Although it is known for a long time that OS modulates NF‐κB activation, the underlying mechanisms, especially concerning at what checkpoint ROS can switch a cell from a homeostatic to a detrimental inflammatory state, have not yet been clearly elucidated 6, 30, 66. More importantly, activation of NF‐κB driven genes seems to be highly cell type dependent and its relationship with OS in neurons is poorly understood.
The aim of the current study was twofold. First, to investigate the correlation between OS and brain inflammation in brain tissue of patients with HME, FCD II or TSC and intractable epilepsy. The FCD subtypes investigated were focal cortical dysplasia type IIa (FCD IIa) and type IIb (FCD IIb). Second, we investigated the magnitude of the oxidative insult required to lead to a transition from homeostatic cellular ROS signaling to initiation of pathologic inflammatory responses in vitro, and the mechanisms implicated. We evaluated therefore the acute effect of sub‐toxic concentrations of the oxidizing agent H2O2 on TLR4 gene expression, inflammatory mediators, and TLR4 signaling components and regulators in human neuronal SH‐SY5Y cells. In addition, to clarify the potential link between OS and NF‐κB activation, the aforementioned targets were also investigated in SH‐SY5Y cells in the presence of the NF‐κB inhibitor TPCA‐1.
Methods
Subjects
The cases included in this study were obtained from the archives of the Departments of Neuropathology of the Amsterdam UMC, (Amsterdam, the Netherlands). Cortical brain samples were obtained from patients undergoing surgery for intractable epilepsy and who were diagnosed with HME (n = 5; aged 6–23 months; with features of FCD type IIa), FCD IIa (n = 5; aged 18–45 years), FCD IIb (n = 5; aged 21–45 years) or TSC (n = 4; aged 2–16 years) (Table 1; Suppl. Figure 1). Surgical material was processed according to the consensus standard operational procedure for tissue inspection, distribution, and processing, using specific markers as recommended by the international consensus FCD classification system 7. All cases were reviewed independently by two neuropathologists, and the diagnosis of FCD was confirmed according to the international consensus classification system proposed for grading FCD 8. FCD type II is characterized by disrupted cortical lamination and cytological abnormalities and includes two subtypes, FCD type IIa (with dysmorphic neurons, but without balloon cells) and FCD type IIb (with dysmorphic neurons and balloon cells), 8. The HME cases included are characterized by the enlargement of one cerebral hemisphere and the resected cortical specimens display features of FCD type IIa. All patients with cortical tubers fulfilled the diagnostic criteria for TSC 60. Cortical tubers consist of areas of cortical dyslamination that contain different cell types, including dysmorphic neurons and giant cells 3, 16. None of the FCD patients fulfilled the diagnostic criteria for TSC. Control material was obtained at autopsy from cortex of 12 controls (aged 2–62 years), without a history of seizures or other neurological diseases (Suppl. Table 2). All autopsies were performed within 24 h after death. Tissue was obtained and used in accordance with the Declaration of Helsinki and the AMC Research Code provided by the Medical Ethics Committee. The clinical information of each patient is reported in Table 1.
Table 1.
Clinical information of patients with epilepsy. Abbreviations: FCD = focal cortical dysplasia; HME = hemimegalencephaly; TSC = tuberous sclerosis complex; FIA = focal impaired awareness; FB = focal to bilateral; TC = tonic‐clonic; FA = focal aware; F = frontal; T = temporal; O = occipital; I = insular; y = years; mo = months; m = male; f = female.
| Pathology | Gender | Age | Duration epilepsy | Seizure types | Brain area | Seizures/month |
|---|---|---|---|---|---|---|
| HME/FCDIIa | f | 8 mo | 8 mo | FIA, FB | I | >200 |
| HME/FCDIIa | f | 13 mo | 12 mo | FIA, FB | T | >100 |
| HME/FCDIIa | m | 23 mo | 22 mo | FB/TC | T | >200 |
| HME/FCDIIa | m | 16 mo | 16 mo | FIA, FB | T | >200 |
| HME/FCDIIa | f | 6 mo | 6 mo | FB/TC | F | >100 |
| FCD IIa | m | 44 y | 26 y | FIA | T | 6 |
| FCD IIa | f | 45 y | 19 y | FIA | F | 375 |
| FCD IIa | m | 32 y | 29 y | FIA, FB/TC | F | 90 |
| FCD IIa | f | 32 y | 24 y | FIA, FB/TC | T | 9 |
| FCD IIa | m | 18 y | 14 y | FA, FIA, FB (absence) | F | 20 |
| FCD IIb | f | 23 y | 22 y | FB (absence), FB/TC | F | 40 |
| FCD IIb | f | 41 y | 40 y | FIA (hypermotor) | F | 105 |
| FCD IIb | f | 37 y | 30 y | FB (tonic) | O | 20 |
| FCD IIb | m | 21 y | 15 y | FIA (hypermotor) | F | 450 |
| FCD IIb | f | 45 y | 19 y | FIA (hypermotor) | F | 375 |
| TSC | f | 4 y | 10 mo | FIA | F | 600 |
| TSC | m | 2 y | 2 y | FIA | F | 600 |
| TSC | f | 13 y | 13 y | FIA | F | 84 |
| TSC | m | 3 y | 3 y | FIA | T | 128 |
Figure 1.
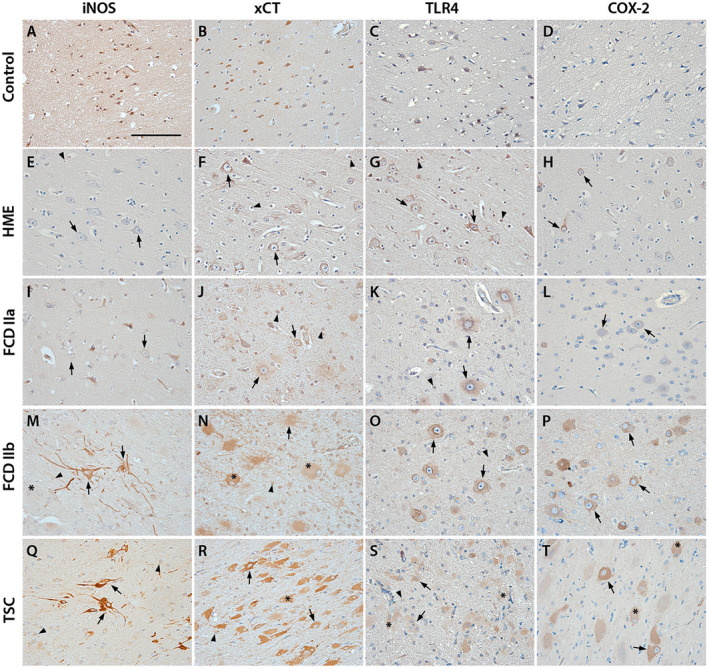
Representative images of oxidative stress markers (iNOS, xCT) and inflammatory markers (TLR4, COX‐2) in control and surgical tissue of HME, FCD IIa, FCD IIb and TSC. Panels A–D show expression of all markers in cortical tissue of autopsy controls. TLR4, iNOS and xCT display (very) weak expression in cortical neurons (A–C), COX‐2 staining is absent (D). HME and FCD IIa tissue show very weak staining for iNOS in dysmorphic neurons (E, I). TLR4 and xCT expression in HME and FCD IIa dysmorphic neurons and glia is higher but not different to control tissue (F, G, J, K). COX‐2 in dysmorphic neurons in HME is weak with sparsely distributed cells displaying strong reactivity (H, arrows). Very weak staining for COX‐2 in FCD IIa could only be detected in dysmorphic neurons (L). In FCD IIb iNOS, xCT, TLR4 and COX‐2 were strongly higher compared to control in dysmorphic neurons and glia (M–P). Balloon cells had a very strong expression of all markers. In TSC, a similar pattern was observed: iNOS, xCT, TLR4 and COX‐2 being expressed in dysmorphic neurons and glia (Q–T). Giant cell expression of all markers was strong as for balloon cells in FCD IIb (M–T, asterisks). Sections were counterstained with hematoxylin. Scale bar: 100 µm in A; arrows = dysmorphic neurons, arrowheads = glia, asterisk* = balloon/giant cells
Table 2.
Immunoreactivity scores of iNOS, xCT, COX‐2 and TLR4 in control and surgical tissue of HME, FCD IIa, FCD IIb and TSC.
| (Dysmorphic) neurons | Glia | Giant/Balloon cells | ||
|---|---|---|---|---|
| iNOS | Control | 2 (0–4) | 2 (0–2) | – |
| HME | 2 (2–3) | 1 (0–2) | – | |
| FCD IIa | 2 (2–4) | 2 (2–4) | – | |
| FCD IIb | 9 (6–9)** | 9 (4–9)** | 7.5 (6–9)** | |
| TSC | 7.5 (6–9)* | 6 (4–9)* | 7.5 (6–9)** | |
| xCT | Control | 3 (3–6) | 3 (3) | – |
| HME | 3 (2–3) | 3 (2–3) | – | |
| FCD IIa | 3 (3–6) | 3 (3–6) | – | |
| FCD IIb | 9 (9)*** | 6 (3–9) | 9 (9)** | |
| TSC | 9 (9)** | 6 (3–6) | 9 (9)** | |
| TLR4 | Control | 3 (0–3) | 3 (3) | – |
| HME | 3 (2–6) | 3 (2–3) | – | |
| FCD IIa | 3 (2–6) | 3 (2–3) | – | |
| FCD IIb | 9 (3–9) | 6 (3–9) | 9 (6–9)** | |
| TSC | 9 (9)** | 6 (3–9) | 6 (6–9)** | |
| COX2 | Control | 0 (0–1) | 0 (0) | – |
| HME | 3 (3–6)** | 0 (0–3) | – | |
| FCD IIa | 1 (0–4) | 0 (0–1) | – | |
| FCD IIb | 3 (1–6)* | 2 (1–4)* | 4 (3–6)** | |
| TSC | 3.5 (3–6)** | 2 (1–4)* | 2.5 (2–6)* |
The immunoreactivity score (IRS) is given as median with the range in brackets. Immunoreactivity was evaluated using a 0–3 scale (0 = absent, 1 = weak, 2 = moderate, 3 = strong staining). In addition, the number of positive cells was evaluated (0 = absent, 1 = rare, 2 = sparse, 3 = high). The product of these two scores (the immunoreactivity score, IRS) was calculated for each case and compared between groups. Kruskal–Wallis test followed by the Dunn’s post hoc test; *P < 0.05, **P < 0.01, ***P < 0.001; HME n = 5, FCD IIa n = 5, FCD IIb n = 5, TSC n = 4.
Immunohistochemistry of epilepsy‐associated pathologies
Human brain tissue was fixed in 10% buffered formalin and embedded in paraffin. Paraffin‐embedded tissue was sectioned at 5 µm, mounted on pre‐coated glass slides (Star Frost, Waldemar Knittel, Braunschweig, Germany) and processed for immunohistochemical staining. Sections were deparaffinated in xylene, rinsed in ethanol (100%, 95%, 70%) and incubated for 20 minutes in 0.3% hydrogen peroxide diluted in methanol to block endogenous peroxidase activity. Antigen retrieval was performed using a pressure cooker in 0.01 M sodium citrate buffer (pH 6.0) at 120°C for 10 minutes. Slides were washed with phosphate buffered saline (PBS, pH 7.4) and incubated overnight with primary antibodies against xCT (polyclonal rabbit, gift from Prof. Vezzani, Milan, Italy, 1:250), iNOS (polyclonal rabbit, Abcam, Cambridge, UK; 1:250), COX‐2 (clone D5H5, monoclonal rabbit, Cell signaling Technology, Beverly, MA, USA; 1:600), TLR4 (polyclonal rabbit, Santa Cruz Biotechnology, Dallas, TX, USA; 1:20) and NF‐κB p65 (polyclonal rabbit, Abcam, Cambridge, UK; 1:100) in PBS at 4°C. Sections were washed in PBS and then stained with a polymer based peroxidase immunohistochemistry detection kit (Brightvision plus kit, ImmunoLogic, Duiven, the Netherlands) according to the manufacturer’s instructions. Staining was performed using Bright 3,3′‐diaminobenzidine (DAB) substrate solution (ImmunoLogic, Duiven, the Netherlands). Reaction was stopped by washing in distilled water. Sections were counterstained with Haematoxylin‐Mayer solution (Klinipath, Breda, the Netherlands), dehydrated in alcohol and xylene and coverslipped.
Evaluation of immunohistochemistry
All tissue sections selected for investigation of OS and inflammatory markers were evaluated by two independent observers, blind to clinical data, for the presence or absence of various histopathological parameters and specific immunoreactivity (IR) for the different markers used for the diagnosis of HME, FCD IIa, FCD IIb, and TSC tubers. In the case of discordant evaluations, independent re‐evaluation was performed by both observers to define the final score. The intensity of immunoreactive staining (IR) for iNOS, xCT, TLR4 and COX‐2 was evaluated using a 0–3 scale (0 = absent, 1 = weak, 2 = moderate, 3 = strong staining). All areas of the lesion were examined and the score represents the predominant staining found in each case. In addition, the number of cells showing immunoreactivity for the different markers (0 = absent, 1 = rare, 2 = sparse, 3 = high) was also scored. As described previously 73, the immunoreactivity score (IRS) was calculated for each case by multiplying the intensity score by the number score and compared between groups.
Cell culture and treatment
SH‐SY5Y neuroblastoma cells were cultured in Dulbecco’s modified Eagle’s medium (DMEM)/HAM F12 (1:1) (Gibco, Life Technologies, Grand Island, NY, USA) supplemented with 50 units/mL penicillin, 50 μg/mL streptomycin, 1% L‐Glutamine and 10% fetal calf serum (FCS; Gibco, Life Technologies, Grand Island, NY, USA). The cultures were maintained in a 5% CO2 incubator at 37°C. For experiments cells were seeded into 96 and 12‐well cell culture plates (Greiner Bio‐One, Kremsmünster, Austria) and allowed to adhere for 24 h. The culture medium was then replaced with fresh medium containing 1% FCS, treated with different amount of hydrogen peroxide (H2O2, 50 μM or 100 μM, Sigma‐Aldrich, St Louis, MO, USA) and incubated for 3 h. For TPCA‐1 treatment culture medium was replaced with fresh medium containing either 0.05% dimethyl sulfoxide (DMSO) or 1 µM TPCA‐1 (Selleck Chemicals, Munich, Germany) in DMSO (0.05% final DMSO concentration) 1 h prior to H2O2 stimulation.
MTT and DCF assay
Cell viability was determined by the 3‐(4,5‐dimethylthiazol‐2‐yl)‐2,5‐diphenyl tetrazolium bromide (MTT, Sigma‐Aldrich, St Louis, MO, USA) cell viability assay. Subsequent to H2O2 treatment, 15 µL of 5 mg/mL MTT reagent was added to each well and the plate was incubated for 2 h at 37°C in a 5% CO2 incubator. The reaction mixture was discarded and 100 μl acid isopropanol (4 mM HCl, 0.1% Nonidet P‐40 in isopropanol) was added to each well to stop color development. Plates were kept in agitation at room temperature for about 15–20 minutes in the dark. Cell density was determined by measuring optical density at 570 nm wavelength using a microplate reader (BMG Labtech, Ortenberg, Germany). Absorbance of treated cells was plotted relative to control cells.
Intracellular ROS levels were measured by the 2′,7′‐dichlorofluorescein (DCF, Sigma‐Aldrich, St Louis, MO, USA) method. The cells were incubated with 10 µM 2′,7′‐dichlorofluorescein diacetate (H2DCF‐DA) in DMEM without phenol red for 30 minutes at 37°C in the dark. After H2DCF‐DA staining, cells were washed twice with pre‐warmed PBS and then suspended in DMEM without phenol red. The formation of DCF was measured with a microplate reader with excitation and emission wavelength at 485 nm (bandwidth 5 nm) and 535 nm (bandwidth 5 nm), respectively. Levels of DCF fluorescence were directly proportional to intracellular ROS levels and the increase in signal caused by H2O2 treatment was reported as a fold‐change compared to untreated samples.
RNA isolation
For RNA isolation, after H2O2 stimulation and/or TPCA‐1 treatment the cells were washed twice with PBS and homogenized in 700 µL Qiazol Lysis Reagent (Qiagen Benelux, Venlo, the Netherlands). Total RNA fraction was isolated using the miRNeasy Mini kit (Qiagen Benelux, Venlo, the Netherlands) according to manufacturer’s instructions. The concentration and purity of RNA was determined at 260/280 nm using a NanoDrop 2000 spectrophotometer (Thermo Fisher Scientific, Wilmington, DE, USA).
Quantitative real‐time PCR analysis
Quantitative real‐time PCR was used to evaluate gene expression of antioxidant enzymes, inflammatory mediators, and TLR4 signaling components (primer sequences in Suppl. Table 1). Briefly, 250 ng of total RNA was reverse‐transcribed into cDNA using oligo dT primers. Quantitative real‐time PCR was performed in 384‐well optical plates and conducted on a Roche Lightcycler 480 thermocycler (Roche Applied Science, Basel, Switzerland). Quantification of data was performed using the computer program LinRegPCR in which linear regression on the Log(fluorescence) per cycle number data is applied to determine the amplification efficiency per sample 55. The starting concentration of each specific product was divided by the geometric mean of the starting concentration of the reference genes [elongation factor 1α (EF1α) and chromosome 1 open reading frame 43 (C1ORF43)] and this ratio was compared between groups.
Statistical analysis
Statistical analyses were performed with Graphpad Prism® software (Graphpad software Inc., La Jolla, CA, USA). For DCF assay, MTT assay and H2O2 regulation non‐parametric Kruskal–Wallis test followed by the Dunn’s post hoc test was used to assess differences between groups. Non‐parametric Mann‐Whitney U test was used for TPCA‐1 data. Correlations between OS and inflammation markers in human tissue were assessed using the Spearman’s rank correlation test. Comparison of staining intensity of immunohistochemistry was done using non‐parametric Kruskal–Wallis test followed by the Dunn’s post hoc test. A P‐value < 0.05 was considered to indicate a significant difference.
Results
Expression of oxidative stress and inflammatory markers in malformations of cortical development
The expression of iNOS, xCT, TLR4 and COX‐2 was investigated in surgically resected cortical tissue of patients with HME, FCD IIa, IIb or TSC (see methods for diagnostic criteria) using immunohistochemistry (see summary of quantification in Table 2). Overall, expression of all investigated markers was mainly restricted to the cytoplasm in all cell types. In control tissue, weak staining was observed for the OS markers iNOS and xCT in neurons and cells with glial morphology (glia) (Figure 1A,B). For the inflammatory marker TLR4, weak staining could be detected in neurons and glia (Figure 1C). COX‐2 expression could not be detected in neurons or glia of control tissue (Figure 1D). In normally appearing neurons in HME and FCD IIa, the expression of iNOS, xCT, TLR4 and COX‐2 was not different from control tissue displaying weak staining (Figure 1E–L). However, dysmorphic neurons in HME and FCD IIa displayed higher expression of xCT, TLR4 and COX‐2, but not iNOS compared to normally appearing neurons (Figure 1E–H and I–L; arrows). Expression of COX‐2 in HME was specifically higher in a subset of dysmorphic neurons scattered throughout grey and white matter (Figure 1H; P = 0.0002). In comparison, iNOS staining was enhanced in FCD IIb in both dysmorphic neurons (P = 0.0002) and glia (P = 0.001) and in dysmorphic neurons in TSC as compared to HME, FCD IIa and controls (Figure 1M,Q vs. A,E,I). xCT staining was higher in dysmorphic neurons (P < 0.0001) in both FCD IIb and TSC (Figure 1N,R). Higher expression of iNOS (P = 0.0005) and xCT (P < 0.0001) was also detected in balloon cells in FCD IIb (Figure 1M,N) and giant cells in TSC (Figure 1Q,R). In accordance with OS markers, TLR4 (dysmorphic neurons P = 0.0025, glia P = 0.014) and COX‐2 (dysmorphic neurons P = 0.0002, glia P = 0.005) were both upregulated in dysmorphic neurons and glia of FCD IIb and TSC (Figure 1O,P,S,T). Upregulation of inflammatory markers TLR4 (P = 0.0003) and COX‐2 (P = 0.0005) was also seen in giant cells (Figure 1S,T; asterisk) and balloon cells.
Expression of NF‐κB p65 in malformations of cortical development
NF‐κB expression was detected in cortical neurons and cells with glial morphology in control tissue (Figure 2A). Pathological tissue displayed the same staining intensity in normally appearing neurons and glia, showing no difference to control specimens (Figure 2B–E). Expression in neurons was restricted to the cytoplasm and did not show any overlap with nuclear hematoxylin staining in control cortex and normally appearing neurons. As for most normally appearing neurons, the majority of dysmorphic neurons displayed cytoplasmic staining (Figure 2B,C,D1,E1, arrow), however nuclear NF‐κB p65 staining could be detected for a small subpopulation of dysmorphic neurons in all pathologies (Figure 2B for HME, arrowhead). Moreover, some balloon and giant cells also displayed NF‐κB p65 accumulation in the nucleus (Figure 2D2, E2; arrowheads) suggesting translocation of NF‐κB p65 from the cytoplasm to the nucleus.
Figure 2.
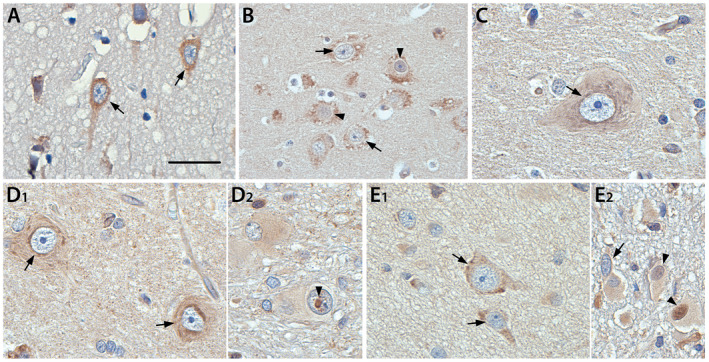
Representative images of cytoplasmic and nuclear expression of NF‐κB p65 in control and surgical tissue of HME, FCD IIa, FCD IIb and TSC. The expression of NF‐κB p65 in cortical neurons of control tissue (A) and dysmorphic neurons in HME and FCD IIa was mainly restricted to the cytoplasm (B, C). Similarly, dysmorphic neurons in FCD IIb and TSC expressed NF‐κB p65 in the cytoplasm (D1, E1). Occasional nuclear staining in dysmorphic neurons could be detected (representative for HME in B, arrowheads). In comparison some balloon cells (D2) and giant cells (E2) displayed nuclear staining, suggesting translocation of NF‐κB p65 from the cytoplasm to the nucleus. Arrows = cytoplasmic staining, arrowheads = nuclear staining. Sections were counterstained with hematoxylin. Scale bar A, C, D1, D2, E1 = 25 µm; Scale bar B, E2 = 50 µm.
Effects of H2O2 treatment on OS and viability in SH‐SY5Y cells
We evaluated the intracellular ROS levels of SH‐SY5Y cells treated with H2O2 (50 μM or 100 μM) for 3 h. As expected, stimulation with both H2O2 concentrations promoted a significant elevation of DCF formation (Figure 3A); no differences in cell viability were evident between the treated and the control groups (Figure 3B). In order to evaluate whether H2O2 stimulation was associated with the dysregulation of antioxidant enzymes, we measured the mRNA expression levels of SOD1, CAT and GPx. Interestingly, we observed a consistent decrease (P = 0.0004) of mRNA levels for CAT at both 50 µM and 100 µM of H2O2 (Figure 3C) while we did not detect differences in SOD1 and GPx expression between treated/control groups (data not shown). As additional proof that the cells were stimulated with subtoxic doses of H2O2, we analyzed the expression of Nrf‐2 and its target HO‐1 (Figure 3D,E). Both genes were upregulated (Nrf‐2 P = 0.0028; HO‐1 P = 0.0002) after 50 µM and 100 µM H2O2 treatment (Figure 3D,E).
Figure 3.
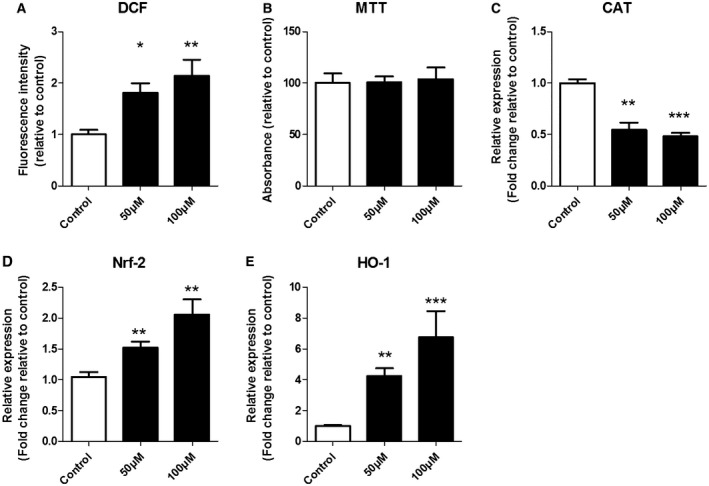
The effect of H2O2 on intracellular ROS accumulation, cell viability and gene expression of oxidative stress markers. SH‐SY5Y cells were treated with different amounts of hydrogen peroxide (H2O2, 50 μM or 100 μM) for 3 h. The intracellular accumulation of ROS was assessed by DCF fluorescence intensity (A). Cell viability was determined using MTT assay (B). The mRNA level of catalase was reduced at both concentration, whereas the expression of Nrf‐2 and HO‐1 was increased (C–E). mRNA expression was normalized to the geometric mean of reference genes C1ORF43 and EIF1α. Kruskal–Wallis test followed by the Dunn’s post hoc test. Error bars represent standard error of mean (SEM); *P < 0.05, **P < 0.01, ***P < 0.001. Data are representative of three independent experiments with three replicates for each group.
Effects of H2O2 treatment on pro‐inflammatory mediators
To assess the potential contribution of OS to the development of an inflammatory response, we measured the mRNA levels of the inflammatory mediators IL‐1β, COX‐2 and TLR4 after 50 μM or 100 μM H2O2 incubation for 3 h in SH‐SY5Y cells (Figure 4A–C). We observed an increased COX‐2 mRNA expression (P = 0.0004) at both H2O2 concentrations (Figure 4B) whereas the mRNA expression of IL‐1β (P = 0.001) and TLR4 (P = 0.0055) was increased only at 100 µM H2O2 compared to respective control group (Figure 4A,C). Next, we focused on TLR4 signaling components in cells exposed to 100 µM H2O2 and we found that the mRNA expression of both TAB2 (P = 0.0059) and IRAK2 (P = 0.0003) were increased compared to control (Figure 4D,E).
Figure 4.
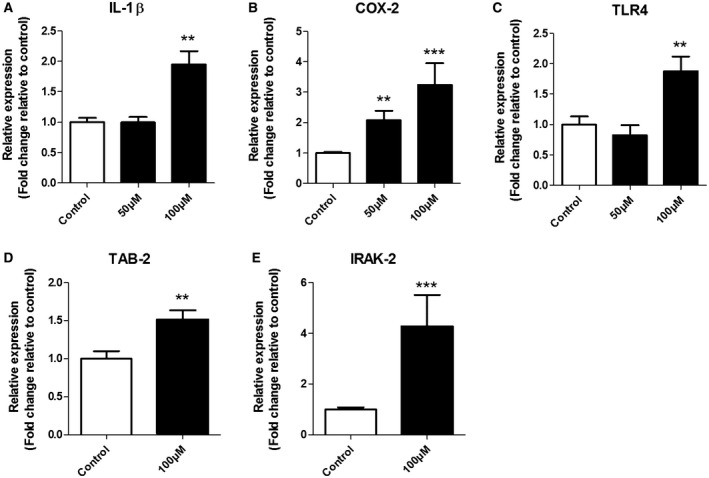
Expression of IL‐1β, COX‐2 and TLR4 (50 μM or 100 μM) and TAB2 and IRAK2 (100 µM) in response to H2O2 treatment for 3 h. Quantitative real‐time PCR of IL‐1β (A), COX‐2 (B) and TLR4 (C) mRNA after 50 µM and 100 µM H2O2 as well as TAB2 (D) and IRAK2 (E) after 100 µM H2O2. Data are expressed relative to levels observed in control groups; mRNA expression was normalized to the geometric mean of reference genes C1ORF43 and EIF1α. Kruskal–Wallis test followed by the Dunn’s post hoc test. Error bars represent standard error of mean (SEM); **P < 0.01, ***P <0.001. Data are representative of three independent experiments with three replicates for each group.
The role of NF‐κB signaling in the development of an inflammatory response after H2O2 exposure
In order to investigate whether NF‐κB is involved in the molecular mechanisms by which H2O2 upregulates IL‐1β, COX‐2 and TLR4, we evaluated the effect of the NF‐κB inhibitor TPCA‐1 on gene expression of these inflammatory mediators in SH‐SY5Y cells treated with 100 µM H2O2 for 3 h. The H2O2‐mediated upregulation of COX‐2 (P < 0.0001) and TLR4 (P = 0.0206) (Figure 5B,C) was reversed by TPCA‐1 pretreatment (IL‐1β P = 0.014, TLR4 P = 0.0016, COX‐2 P = 0.004 vs H2O2 alone; Figure 5A–C).
Figure 5.
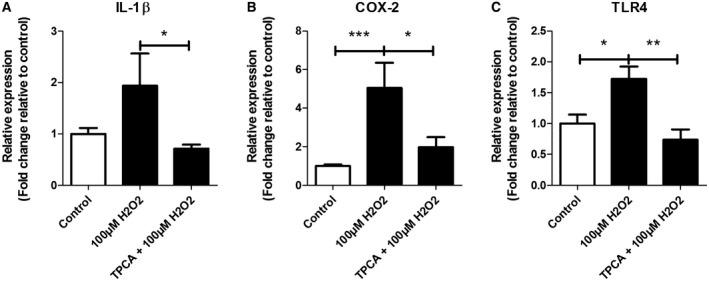
Expression of IL‐1β, COX‐2 and TLR4 after stimulation with 100 µM H2O2 with or without TPCA‐1‐ pretreatment. Quantitative real‐time PCR of IL‐1β (A), COX‐2 (B) and TLR4 (C) in SH‐SY5Y cells TPCA‐1 pretreated with or without 100 µM H2O2. Data are expressed relative to expression observed in control groups; mRNA expression was normalized to the geometric mean of reference genes C1ORF43 and EF1α. Nonparametric Mann–Whitney U test. Error bars represent standard error of mean (SEM); *P < 0.05, **P < 0.01, ***P < 0.001. Data are representative of three independent experiments with three replicates for each group.
Effects of H2O2 treatment on NF‐κB regulators SHIP‐1 and SOCS‐1
In order to further clarify the mechanisms by which OS modulate TLR4/NF‐κB signaling, we measured the mRNA expression of SOCS‐1 and SHIP‐1 in SH‐SY5Y cells after H2O2 pretreated with or without TPCA‐1 (Figure 6). The mRNA expression of SOCS‐1 was increased after 50 µM (P = 0.0002) and 100 µM (P < 0.0001) H2O2 compared to the control group (Figure 6A,B). In addition, we found an increase in mRNA expression for SHIP‐1 (P < 0.0001 in both conditions) in all experimental conditions compared to the control group (Figure 6C,D). TPCA‐1 pre‐treatment inhibited the H2O2‐induced increase in SOCS‐1 (50 µM P = 0.0421, 100 µM P = 0.0011; Figure 6A,B) but not SHIP‐1 (Figure 6C,D) expression.
Figure 6.
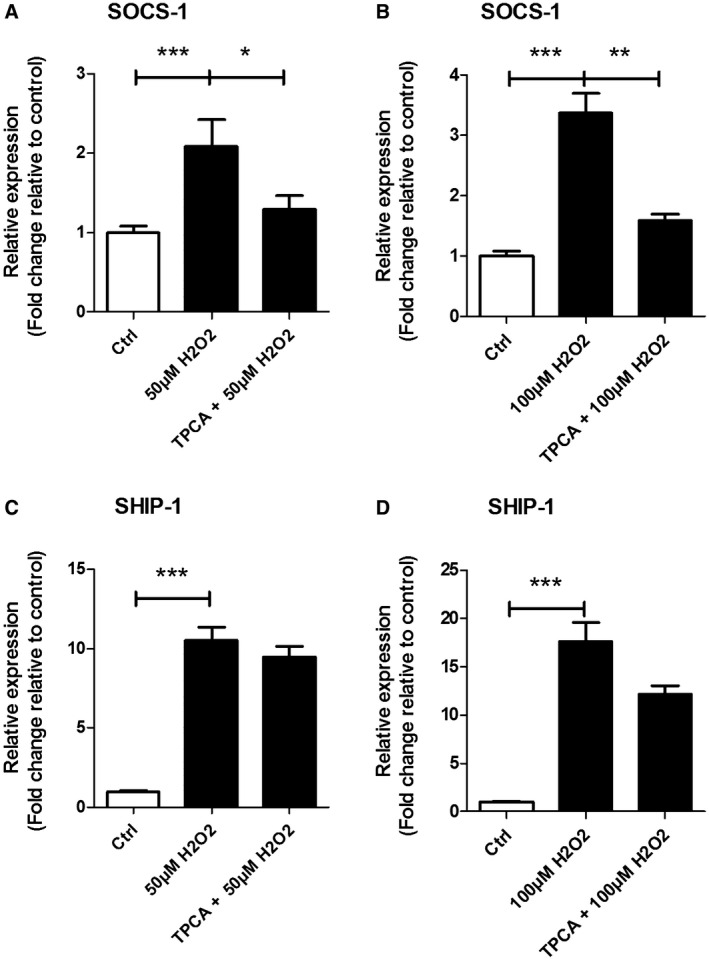
Expression of SOCS1 and SHIP1 after stimulation with or without TPCA‐1‐ pretreatment and treated with H2O2. Quantitative real‐time PCR of SOCS1 (A, B) and SHIP1 (C, D) in SH‐SY5Y cells TPCA‐1‐ pretreated and/or H2O2‐treated. Data are expressed relative to expression observed in control groups; mRNA expression was normalized to the geometric mean of reference genes C1ORF43 and EF1α. Nonparametric Mann–Whitney U test. Error bars represent standard error of mean (SEM);* P < 0.05, **P < 0.01, ***P < 0.001. Data are representative of three independent experiments with three replicates for each group.
Discussion
This study shows higher expression of OS and inflammatory markers in resected brain tissue of patients with HME, FCD II or TSC, as compared to autoptic control specimens. In addition, we show that the expression of OS markers positively correlates with the expression of inflammatory markers in FCD IIb and TSC. To explain the relationship between OS and inflammation we provide evidence in SH‐SY5Y neuronal cells that NF‐κB mediates OS induction of inflammatory genes with ictogenic and excitotoxic properties.
Expression of OS markers, inflammatory markers and NF‐κB p65 in HME, FCD II and TSC
We report a consistent upregulation of OS markers, primarily in dysmorphic neurons and giant/balloon cells, but also glia, in FCD IIb and TSC. The presence of OS was previously reported in patients with TLE 37, 41, 50, 58, progressive myoclonic epilepsy 5, acute encephalopathy with refractory epilepsy 63 and genetic generalized epilepsy 36. FCD and TSC represent the most frequent developmental disorders leading to refractory epilepsy in the pediatric population. The FCDs comprise brain lesions displaying cortical dyslamination, cytoarchitectural lesions and abnormalities in white matter in any combination 9. The presence of OS has not been characterized yet except for one study showing that peroxiredoxin 6, an endogenous antioxidant molecule, was decreased in FCD patients 54. TSC is a genetic disorder owing to a loss of function mutation in the TSC1 or TSC2 gene that together act as inhibitors of the mTOR pathway 56. A link with OS has been suggested by examining resected angiomyolipomas of TSC patients and in models of TSC1/2 deficient cells and mice 18, 25, 26. However, OS presence and extent has not been addressed in detail yet. HME is a rare malformation of cortical development (associated with developmental delay and severe epilepsy), characterized by the enlargement of one cerebral hemisphere displaying different features of FCD type II and TSC cortical lesions, such as cortical dyslamination and the presence of hypertrophic and dysmorphic neurons [for review see 3, 16]. All three pathologies (HME, FCD II and TSC) present with aberrant mTOR signaling, thus share similar pathomechanisms and accumulating evidence suggests that they represent a spectrum of disorders involving hyperactivation of the mTOR pathway 1, 4, 15, 17, 39. However, the role and interplay of OS and inflammation in HME has not been investigated in detail. We show higher iNOS and xCT expression in brain tissue of FCD IIb and TSC indicating the presence of OS. We also identified higher expression of TLR4 and COX‐2 in the same brain specimens, in accordance with previous evidence of altered, ictogenic TLR4 signaling and increased brain inflammation 73. Notably, upregulation of TLR4 signaling was positively correlated with the expression of OS markers in neurons and glia.
The analyzed markers of OS and inflammation were higher in dysmorphic neurons, glia, giant cells and balloon cells, and iNOS expression was especially upregulated in balloon/giant cells. Although neuronal NO production has essential physiological functions in neurons excessive levels by reacting with ROS can potentially lead to the production of peroxynitrite which is a highly reactive radical species 64. The higher production of xCT in the same cells is an index of ROS generation as xCT is Nrf‐2 dependent and can be induced by ROS 24. Interestingly, glutamate‐cysteine ligase catalytic subunit (GCLC), an enzyme crucial in the synthesis of antioxidant glutathione, is considered to be pivotal for the redox adaptation leading to positive selection of mutant cells in TSC 42. Combined with higher iNOS expression, this set of data suggest that mutant cells in TSC drive OS but are also more resistant to it via glutathione dependent ROS reduction. Thus, in TSC, OS could be a key element in the progression of the disease by damaging healthy neurons via excessive ROS production and by selecting resistant cells carrying the pathologic mutation. Concerning neuroinflammation, the accumulation of NF‐κB p65 in the nuclei of selected subpopulations of dysmorphic neurons in all pathologies and balloon/giant cells in FCD IIb and TSC suggests that these cells may produce excessive inflammatory mediators via the canonical NF‐κB pathway 33. Indeed, previous studies reported upregulation of TLR4 in giant cells of fetal TSC brains as early as 23 gestational weeks indicating a prolonged exposure of the developing brain to a pro‐inflammatory environment already before birth 52. Moreover, this study concluded that giant cells appeared prior to the development of dysmorphic neurons. Combining inflammation and OS would impose damaging molecules to the surrounding neurons.
Inflammation and OS can be cause and consequence of each other and both processes were shown to be involved in epileptogenesis 44, 70. Although they are concomitantly expressed in resected FCD type II and TSC epileptogenic tissues, it is noteworthy that dysmorphic neurons in HME and FCD IIa did not show higher expression of iNOS and COX‐2 compared to control. The expression of xCT and TLR4 in these cells was higher to some extent but much less than in FCD IIb and TSC. Since balloon cells are lacking in FCD IIa and in most HME cases, the overall expression of OS and inflammatory markers was consequently less than in FCD IIb and TSC. It is noteworthy however, that although dysmorphic neurons in HME displayed similar staining to that seen in FCD IIa for iNOS, TLR4 and xCT, a few sparsely distributed neurons in the grey and white matter exhibited very strong COX‐2 expression compared to FCD IIa. Thus, the staining pattern of HME for the investigated markers lies between FCD IIa and FCD IIb, possibly explained by the occasional presence of balloon cells, which are lacking in FCD IIa, acting as drivers of inflammation and/or OS in HME. To elucidate the mechanisms that could underlie the differential expression pattern in dysmorphic neurons we investigated the neuronal inflammatory response to OS in vitro.
SH‐SY5Y cells possess a dose‐dependent intracellular switch to an inflammatory state after OS
To understand the contribution of OS to the inflammatory state of dysmorphic neurons in the epileptogenic lesions, we used the human neuronal cell line SH‐SY5Y and induced OS using H2O2. Since SH‐SY5Y cells express human‐specific proteins we used this cell line to study the neuronal response to OS in vitro. SH‐SY5Y is a neuroblastoma cell line that resembles neurons in an undifferentiated state, mostly catecholaminergic, which is easily maintained and produces reliable, reproducible results 35. It is noteworthy though that these cells are derived from a tumor, hence they may not express neuronal markers to the same extent as neurons in the human brain. However, for the study of basic mechanisms we assume that general responses to OS are comparable between SH‐SY5Y cells in vitro and neurons in vivo. Moreover, we decided not to differentiate SH‐SY5Y cells into specific neuronal lineages since the investigated malformations of cortical development are characterized by neuronal cells that display aberrant differentiation states 46. We observed that H2O2 induced a significant ROS overproduction, while not being cytotoxic. The increase in ROS was associated with activation of the antioxidant response. To investigate if a sustained elevation of OS could promote the development of an inflammatory state, we analyzed changes in expression levels of TLR4, TLR4 signaling components and its inflammatory mediators IL‐1β and COX‐2 in SH‐SY5Y cells treated with H2O2. Interestingly, we observed an increase in expression of COX‐2 at both H2O2 concentrations used while mRNA expression of TLR4 and IL‐1β were only increased significantly at the highest H2O2 concentration together with increased signaling proteins such as TAB2 and IRAK2. Thus, sub‐lethal OS mediates increased transcription of pro‐inflammatory genes and downstream signaling molecules in neurons. TLR4 signaling activation in neurons was previously reported after oxidative insults like ischemia and reperfusion 21, 29, 65. Since TLR4 deficiency in mice can reduce oxidative damage to the brain 12, 34 and IL‐1β activates NF‐κB 38, OS and neuroinflammation could induce a self‐perpetuating cycle of inflammatory signaling via autocrine/paracrine signaling (Figure 7) 28. This would be in line with the positive correlation of OS and inflammation in FCD IIb and TSC. Since we could not observe this correlation in HME and FCD IIa one might expect different mechanisms, secondary to mTOR activity, driving the pathology between HME/FCD IIa and FCD IIb/TSC. Interestingly, mouse models of inflammation via intrauterine lipopolysaccharide infusion 11 and peripheral influenza infection 31 were shown to have altered neuronal morphology, proving that a pro‐inflammatory environment could have a direct effect on neuronal morphology. Moreover, longer durations of epilepsy in FCD IIb was shown to affect cell morphology in dysplastic areas directly 20. These findings support the idea that additional factors other than the genetic drivers in malformations of cortical development, like OS and the resulting inflammation, could contribute to the histopathological features in FCD IIb and cortical tubers in TSC. In line with this, a recent study addressing the ontogenetic processes at the origin of the complex cytological alteration in FCD type II suggests the concomitant occurrence of two different events: the first very early during cortical development related to the somatic gene mutation acting on mTOR pathway and the second one, promoted by the presence of inflammatory processes that could be responsible for a second wave of cytoarchitectural abnormalities 57.
Figure 7.
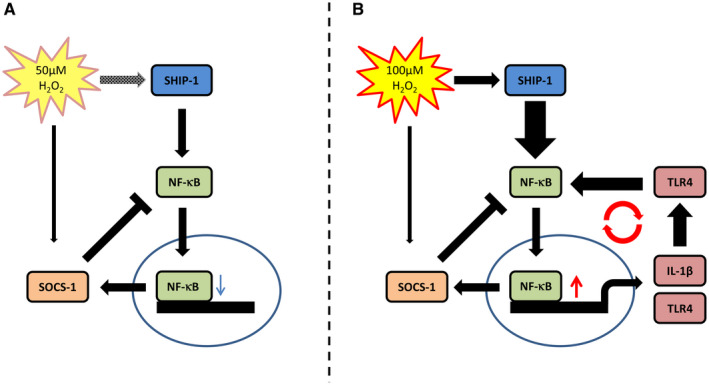
Proposed mechanism of OS‐mediated switch to an inflammatory state. Low OS at 50 µM H2O2 stimulates SHIP‐1 and, mediated via NF‐κB, SOCS‐1 expression alike creating an equilibrium that does not induce expression of inflammatory genes. High OS at 100 µM H2O2 leads to increased SHIP‐1 expression and NF‐κB activation and subsequently increased IL‐1β and TLR4 expression which reinforces NF‐κB signaling further. In this condition SOCS‐1 cannot equilibrate the NF‐κB signal leading to a self‐perpetuating inflammatory signal.
It is noteworthy that FCD IIa and IIb are only discriminated on the histopathological level whereas in patients both FCD subtypes display a similarly high degree of intrinsic epileptogenicity 49. Thus, seizures alone may not be the only determinants of the observed prominent higher expression of OS and inflammatory markers in FCD type IIb and cortical tubers. Therefore, the lesion per se with its specific cytoarchitectural and functional abnormalities, or the concomitant presence of the lesion and the epileptic activity, is likely to play a role in modulating OS and pro‐inflammatory molecules in these malformations of cortical development.
SHIP‐1 might be a mediator of the switch to an inflammatory state in SH‐SY5Y cells
To better understand the potential role of OS in modulating TLR4/NF‐κB pathway and understand the concentration‐dependent switch to an inflammatory state, we evaluated the changes in the expression of two regulatory proteins, namely SOCS1 and SHIP1. While SHIP1 positively regulates NF‐κB through the inactivation of protein kinase B (AKT), which suppresses mitogen activated protein kinase (MAPK) activation 19, SOCS1 has been proposed as negative regulator by binding to the p65 subunit of NF‐κB. Binding facilitates ubiquitination and degradation of p65 59, 72. We observed that both SOCS1 and SHIP‐1 were increased upon stimulation with H2O2. SHIP‐1 expression and regulation of NF‐κB seems to be counterbalanced at low H2O2 concentrations via negative regulation of, for example, SOCS‐1, which prevents transcription of NF‐κB targets including IL‐1β (Figure 7A). The dose‐dependent increase of SHIP‐1 promotes a disequilibrium between SOCS‐1 and SHIP‐1 in favor of SHIP‐1, thus initiating self‐perpetuating NF‐κB‐dependent transcription of pro‐inflammatory genes (Figure 7B). Moreover, TPCA‐1 can prevent SOCS‐1 upregulation which does not occur for SHIP‐1. Interestingly, this effect was also shown in other cell lines 22 making SHIP‐1 a key player in the translation of OS to inflammation in neurons as well.
Conclusion
Our study shows that OS is common to FCD type IIb and TSC and is positively correlated to neuroinflammation in epileptogenic tissue. We also show that the neuronal cell line SH‐SY5Y responds to OS with dose dependent induction of inflammatory mediators. We propose that the extent of OS is pivotal for inducing or perpetuating an inflammatory process. Based on our hypothesis, antioxidant therapy could potentially prevent the switch to inflammation in neurons, and possibly other cell types, thereby preventing the consequent cascade of events contributing to the epileptogenic process.
Ethics Approval and Consent to Participate
The tissue was obtained and used in accordance with the Declaration of Helsinki and the Amsterdam UMC Research Code provided by the Medical Ethics Committee.
Sources of Funding
The research leading to these results has received funding from the European Union’s Seventh Framework Programme (FP7/2007‐2013) under grant agreement no. 602391 (EPISTOP; JvS, EA, FEJ) and no. 602102 (EPITARGET; AV, EAvV, EA), the Dutch Epilepsy Foundation, project number 16‐05 (EAvV) and the European Union’s Horizon 2020 Research and Innovation Programme under the Marie Sklodowska‐Curie grant agreement no. 642881 (ECMED; AK, EA) and no. 722053 (EU‐GliaPhD; TSZ, EA).
Disclosures
The authors declare that they have no competing interests.
Authors’ Contributions
AA and TSZ performed quantitative real‐time PCR analysis. TSZ and JJA performed immunohistochemical analyses. Data analysis was performed by AA and TSZ. EAvV, JDM and AMI contributed to the data analysis and interpretation. Cell culture experiments were performed by AA and TSZ. JvS and AK contributed to cell culture experiments. AV provided the antibodies for oxidative stress markers and MP the SH‐SY5Y cell line. WvS, PCvR, FEJ, WvH, JCB, SI and EA helped with the selection and collection of the brain tissues. EA conceived the study and participated in its design and coordination together with EAvV. TSZ, AA, JDM, AM, EAvV, EA drafted and finalized the manuscript. All authors read, revised, and approved the final manuscript.
Supporting information
Figure S1. Representative haematoxylin and eosin staining for the classification of HME, FCD IIa, FCD IIb and TSC.
Table S1. Primer sequences used for quantitative real‐time PCR.
Table S2. Clinical information on autopsy control specimens.
References
- 1. Aronica E, Boer K, Baybis M, Yu J, Crino P (2007) Co‐expression of cyclin D1 and phosphorylated ribosomal S6 proteins in hemimegalencephaly. Acta Neuropathol 114:287–293. [DOI] [PubMed] [Google Scholar]
- 2. Aronica E, Crino PB (2011) Inflammation in epilepsy: clinical observations. Epilepsia 52(Suppl. 3):26–32. [DOI] [PubMed] [Google Scholar]
- 3. Aronica E, Muhlebner A (2017) Neuropathology of epilepsy. Handb Clin Neurol 145:193–216. [DOI] [PubMed] [Google Scholar]
- 4. Baybis M, Yu J, Lee A, Golden JA, Weiner H, McKhann G 2nd et al (2004) mTOR cascade activation distinguishes tubers from focal cortical dysplasia. Ann Neurol 56:478–487. [DOI] [PubMed] [Google Scholar]
- 5. Ben‐Menachem E, Kyllerman M, Marklund S (2000) Superoxide dismutase and glutathione peroxidase function in progressive myoclonus epilepsies. Epilepsy Res 40:33–39. [DOI] [PubMed] [Google Scholar]
- 6. Blackwell TS, Blackwell TR, Holden EP, Christman BW, Christman JW (1996) In vivo antioxidant treatment suppresses nuclear factor‐kappa B activation and neutrophilic lung inflammation. J Immunol 157:1630–1637. [PubMed] [Google Scholar]
- 7. Blumcke I, Aronica E, Miyata H, Sarnat HB, Thom M, Roessler K et al (2016) International recommendation for a comprehensive neuropathologic workup of epilepsy surgery brain tissue: a consensus task force report from the ILAE commission on diagnostic methods. Epilepsia 57:348–358. [DOI] [PubMed] [Google Scholar]
- 8. Blumcke I, Spreafico R (2011) An international consensus classification for focal cortical dysplasias. Lancet Neurol 10:26–27. [DOI] [PubMed] [Google Scholar]
- 9. Blumcke I, Thom M, Aronica E, Armstrong DD, Vinters HV, Palmini A et al (2011) The clinicopathologic spectrum of focal cortical dysplasias: a consensus classification proposed by an ad hoc Task Force of the ILAE diagnostic methods commission. Epilepsia 52:158–174. [DOI] [PMC free article] [PubMed] [Google Scholar]
- 10. Brasier AR (2006) The NF‐kappaB regulatory network. Cardiovasc Toxicol 6:111–130. [DOI] [PubMed] [Google Scholar]
- 11. Burd I, Bentz AI, Chai J, Gonzalez J, Monnerie H, Le Roux PD et al (2010) Inflammation‐induced preterm birth alters neuronal morphology in the mouse fetal brain. J Neurosci Res 88:1872–1881. [DOI] [PMC free article] [PubMed] [Google Scholar]
- 12. Cao CX, Yang QW, Lv FL, Cui J, Fu HB, Wang JZ (2007) Reduced cerebral ischemia‐reperfusion injury in Toll‐like receptor 4 deficient mice. Biochem Biophys Res Commun 353:509–514. [DOI] [PubMed] [Google Scholar]
- 13. Castellani P, Balza E, Rubartelli A (2014) Inflammation, DAMPs, tumor development, and progression: a vicious circle orchestrated by redox signaling. Antioxid Redox Signal 20:1086–1097. [DOI] [PubMed] [Google Scholar]
- 14. Cogswell JP, Godlevski MM, Wisely GB, Clay WC, Leesnitzer LM, Ways JP, Gray JG (1994) NF‐kappa B regulates IL‐1 beta transcription through a consensus NF‐kappa B binding site and a nonconsensus CRE‐like site. J Immunol 153:712–723. [PubMed] [Google Scholar]
- 15. Crino PB (2007) Focal brain malformations: a spectrum of disorders along the mTOR cascade. Novartis Found Symp 288:260–272; discussion 72–81. [DOI] [PubMed] [Google Scholar]
- 16. Curatolo P, Moavero R, van Scheppingen J, Aronica E (2018) mTOR dysregulation and tuberous sclerosis‐related epilepsy. Expert Rev Neurother 18:185–201. [DOI] [PubMed] [Google Scholar]
- 17. D’Gama AM, Geng Y, Couto JA, Martin B, Boyle EA, LaCoursiere CM et al (2015) Mammalian target of rapamycin pathway mutations cause hemimegalencephaly and focal cortical dysplasia. Ann Neurol 77:720–725. [DOI] [PMC free article] [PubMed] [Google Scholar]
- 18. Di Nardo A, Kramvis I, Cho N, Sadowski A, Meikle L, Kwiatkowski DJ, Sahin M (2009) Tuberous sclerosis complex activity is required to control neuronal stress responses in an mTOR‐dependent manner. J Neurosci 29:5926–5937. [DOI] [PMC free article] [PubMed] [Google Scholar]
- 19. Fang H, Pengal RA, Cao X, Ganesan LP, Wewers MD, Marsh CB, Tridandapani S (2004) Lipopolysaccharide‐induced macrophage inflammatory response is regulated by SHIP. J Immunol 173:360–366. [DOI] [PubMed] [Google Scholar]
- 20. Finardi A, Colciaghi F, Castana L, Locatelli D, Marras CE, Nobili P et al (2013) Long‐duration epilepsy affects cell morphology and glutamatergic synapses in type IIB focal cortical dysplasia. Acta Neuropathol 126:219–235. [DOI] [PubMed] [Google Scholar]
- 21. Gill R, Tsung A, Billiar T (2010) Linking oxidative stress to inflammation: toll‐like receptors. Free Radic Biol Med 48:1121–1132. [DOI] [PMC free article] [PubMed] [Google Scholar]
- 22. Gloire G, Charlier E, Rahmouni S, Volanti C, Chariot A, Erneux C, Piette J (2006) Restoration of SHIP‐1 activity in human leukemic cells modifies NF‐kappaB activation pathway and cellular survival upon oxidative stress. Oncogene 25:5485–5494. [DOI] [PubMed] [Google Scholar]
- 23. Grewal GK, Kukal S, Kanojia N, Saso L, Kukreti S, Kukreti R (2017) Effect of oxidative stress on ABC transporters: contribution to epilepsy pharmacoresistance. Molecules 22:365. [DOI] [PMC free article] [PubMed] [Google Scholar]
- 24. Habib E, Linher‐Melville K, Lin HX, Singh G (2015) Expression of xCT and activity of system xc(‐) are regulated by NRF2 in human breast cancer cells in response to oxidative stress. Redox Biol 5:33–42. [DOI] [PMC free article] [PubMed] [Google Scholar]
- 25. Habib SL (2009) Insight into mechanism of oxidative DNA damage in angiomyolipomas from TSC patients. Mol Cancer 8:13. [DOI] [PMC free article] [PubMed] [Google Scholar]
- 26. Habib SL, Abboud HE (2016) Tuberin regulates reactive oxygen species in renal proximal cells, kidney from rodents, and kidney from patients with tuberous sclerosis complex. Cancer Sci 107:1092–1100. [DOI] [PMC free article] [PubMed] [Google Scholar]
- 27. Hayden MS, Ghosh S (2008) Shared principles in NF‐kappaB signaling. Cell 132:344–362. [DOI] [PubMed] [Google Scholar]
- 28. Hiscott J, Marois J, Garoufalis J, D’Addario M, Roulston A, Kwan I et al (1993) Characterization of a functional NF‐kappa B site in the human interleukin 1 beta promoter: evidence for a positive autoregulatory loop. Mol Cell Biol 13:6231–6240. [DOI] [PMC free article] [PubMed] [Google Scholar]
- 29. Hua F, Ma J, Ha T, Xia Y, Kelley J, Williams DL et al (2007) Activation of Toll‐like receptor 4 signaling contributes to hippocampal neuronal death following global cerebral ischemia/reperfusion. J Neuroimmunol 190:101–111. [DOI] [PMC free article] [PubMed] [Google Scholar]
- 30. Janssen‐Heininger YM, Poynter ME, Baeuerle PA (2000) Recent advances towards understanding redox mechanisms in the activation of nuclear factor kappaB. Free Radic Biol Med 28:1317–1327. [DOI] [PubMed] [Google Scholar]
- 31. Jurgens HA, Amancherla K, Johnson RW (2012) Influenza infection induces neuroinflammation, alters hippocampal neuron morphology, and impairs cognition in adult mice. J Neurosci 32:3958–3968. [DOI] [PMC free article] [PubMed] [Google Scholar]
- 32. Kaltschmidt C, Kaltschmidt B, Lannes‐Vieira J, Kreutzberg GW, Wekerle H, Baeuerle PA, Gehrmann J (1994) Transcription factor NF‐kappa B is activated in microglia during experimental autoimmune encephalomyelitis. J Neuroimmunol 55:99–106. [DOI] [PubMed] [Google Scholar]
- 33. Karin M, Ben‐Neriah Y (2000) Phosphorylation meets ubiquitination: the control of NF‐[kappa]B activity. Annu Rev Immunol 18:621–663. [DOI] [PubMed] [Google Scholar]
- 34. Kilic U, Kilic E, Matter CM, Bassetti CL, Hermann DM (2008) TLR‐4 deficiency protects against focal cerebral ischemia and axotomy‐induced neurodegeneration. Neurobiol Dis 31:33–40. [DOI] [PubMed] [Google Scholar]
- 35. Kovalevich J, Langford D (2013) Considerations for the use of SH‐SY5Y neuroblastoma cells in neurobiology. Methods Mol Biol 1078:9–21. [DOI] [PMC free article] [PubMed] [Google Scholar]
- 36. Kudin AP, Baron G, Zsurka G, Hampel KG, Elger CE, Grote A et al (2017) Homozygous mutation in TXNRD1 is associated with genetic generalized epilepsy. Free Radic Biol Med 106:270–277. [DOI] [PubMed] [Google Scholar]
- 37. Kunz WS, Kudin AP, Vielhaber S, Blumcke I, Zuschratter W, Schramm J et al (2000) Mitochondrial complex I deficiency in the epileptic focus of patients with temporal lobe epilepsy. Ann Neurol 48:766–773. [PubMed] [Google Scholar]
- 38. Lawrence T (2009) The nuclear factor NF‐kappaB pathway in inflammation. Cold Spring Harb Perspect Biol 1:a001651. [DOI] [PMC free article] [PubMed] [Google Scholar]
- 39. Ljungberg MC, Bhattacharjee MB, Lu Y, Armstrong DL, Yoshor D, Swann JW et al (2006) Activation of mammalian target of rapamycin in cytomegalic neurons of human cortical dysplasia. Ann Neurol 60:420–429. [DOI] [PubMed] [Google Scholar]
- 40. Loboda A, Damulewicz M, Pyza E, Jozkowicz A, Dulak J (2016) Role of Nrf2/HO‐1 system in development, oxidative stress response and diseases: an evolutionarily conserved mechanism. Cell Mol Life Sci 73:3221–3247. [DOI] [PMC free article] [PubMed] [Google Scholar]
- 41. Lopez J, Gonzalez ME, Lorigados L, Morales L, Riveron G, Bauza JY (2007) Oxidative stress markers in surgically treated patients with refractory epilepsy. Clin Biochem 40:292–298. [DOI] [PubMed] [Google Scholar]
- 42. Malik AR, Liszewska E, Skalecka A, Urbanska M, Iyer AM, Swiech LJ et al (2015) Tuberous sclerosis complex neuropathology requires glutamate‐cysteine ligase. Acta Neuropathol Commun 3:48. [DOI] [PMC free article] [PubMed] [Google Scholar]
- 43. Maroso M, Balosso S, Ravizza T, Liu J, Aronica E, Iyer AM et al (2010) Toll‐like receptor 4 and high‐mobility group box‐1 are involved in ictogenesis and can be targeted to reduce seizures. Nat Med 16:413–419. [DOI] [PubMed] [Google Scholar]
- 44. Martinc B, Grabnar I, Vovk T (2012) The role of reactive species in epileptogenesis and influence of antiepileptic drug therapy on oxidative stress. Curr Neuropharmacol 10:328–343. [DOI] [PMC free article] [PubMed] [Google Scholar]
- 45. McElroy PB, Liang LP, Day BJ, Patel M (2017) Scavenging reactive oxygen species inhibits status epilepticus‐induced neuroinflammation. Exp Neurol 298:13–22. [DOI] [PMC free article] [PubMed] [Google Scholar]
- 46. Muhlebner A, Iyer AM, van Scheppingen J, Anink JJ, Jansen FE, Veersema TJ et al (2016) Specific pattern of maturation and differentiation in the formation of cortical tubers in tuberous sclerosis omplex (TSC): evidence from layer‐specific marker expression. J Neurodev Disord 8:9. [DOI] [PMC free article] [PubMed] [Google Scholar]
- 47. Nguyen T, Nioi P, Pickett CB (2009) The Nrf2‐antioxidant response element signaling pathway and its activation by oxidative stress. J Biol Chem 284:13291–13295. [DOI] [PMC free article] [PubMed] [Google Scholar]
- 48. Pacher P, Beckman JS, Liaudet L (2007) Nitric oxide and peroxynitrite in health and disease. Physiol Rev 87:315–424. [DOI] [PMC free article] [PubMed] [Google Scholar]
- 49. Palmini A, Najm I, Avanzini G, Babb T, Guerrini R, Foldvary‐Schaefer N et al (2004) Terminology and classification of the cortical dysplasias. Neurology 62:S2–S8. [DOI] [PubMed] [Google Scholar]
- 50. Pauletti A, Terrone G, Shekh‐Ahmad T, Salamone A, Ravizza T, Rizzi M et al (2017) Targeting oxidative stress improves disease outcomes in a rat model of acquired epilepsy. Brain 140:1885–1899. [DOI] [PMC free article] [PubMed] [Google Scholar] [Retracted]
- 51. Pearson JN, Rowley S, Liang LP, White AM, Day BJ, Patel M (2015) Reactive oxygen species mediate cognitive deficits in experimental temporal lobe epilepsy. Neurobiol Dis 82:289–297. [DOI] [PMC free article] [PubMed] [Google Scholar]
- 52. Prabowo AS, Anink JJ, Lammens M, Nellist M, van den Ouweland AM, Adle‐Biassette H et al (2013) Fetal brain lesions in tuberous sclerosis complex: TORC1 activation and inflammation. Brain Pathol 23:45–59. [DOI] [PMC free article] [PubMed] [Google Scholar]
- 53. Puttachary S, Sharma S, Verma S, Yang Y, Putra M, Thippeswamy A et al (2016) 1400W, a highly selective inducible nitric oxide synthase inhibitor is a potential disease modifier in the rat kainate model of temporal lobe epilepsy. Neurobiol Dis 93:184–200. [DOI] [PubMed] [Google Scholar]
- 54. Qin L, Liu X, Liu S, Liu Y, Yang Y, Yang H et al (2017) Differentially expressed proteins underlying childhood cortical dysplasia with epilepsy identified by iTRAQ proteomic profiling. PLoS One 12:e0172214. [DOI] [PMC free article] [PubMed] [Google Scholar]
- 55. Ramakers C, Ruijter JM, Deprez RH, Moorman AF (2003) Assumption‐free analysis of quantitative real‐time polymerase chain reaction (PCR) data. Neurosci Lett 339:62–66. [DOI] [PubMed] [Google Scholar]
- 56. Randle SC (2017) Tuberous sclerosis complex: a review. Pediatr Ann 46:e166–e171. [DOI] [PubMed] [Google Scholar]
- 57. Rossini L, Villani F, Granata T, Tassi L, Tringali G, Cardinale F et al (2017) FCD Type II and mTOR pathway: evidence for different mechanisms involved in the pathogenesis of dysmorphic neurons. Epilepsy Res 129:146–156. [DOI] [PubMed] [Google Scholar]
- 58. Rumia J, Marmol F, Sanchez J, Gimenez‐Crouseilles J, Carreno M, Bargallo N et al (2013) Oxidative stress markers in the neocortex of drug‐resistant epilepsy patients submitted to epilepsy surgery. Epilepsy Res 107:75–81. [DOI] [PubMed] [Google Scholar]
- 59. Ryo A, Suizu F, Yoshida Y, Perrem K, Liou YC, Wulf G et al (2003) Regulation of NF‐kappaB signaling by Pin1‐dependent prolyl isomerization and ubiquitin‐mediated proteolysis of p65/RelA. Mol Cell 12:1413–1426. [DOI] [PubMed] [Google Scholar]
- 60. Samueli S, Abraham K, Dressler A, Groeppel G, Jonak C, Muehlebner A et al (2015) Tuberous Sclerosis Complex: new criteria for diagnostic work‐up and management. Wien Klin Wochenschr 127:619–630. [DOI] [PubMed] [Google Scholar]
- 61. Sayre LM, Smith MA, Perry G (2001) Chemistry and biochemistry of oxidative stress in neurodegenerative disease. Curr Med Chem 8:721–738. [DOI] [PubMed] [Google Scholar]
- 62. Shadel GS, Horvath TL (2015) Mitochondrial ROS signaling in organismal homeostasis. Cell 163:560–569. [DOI] [PMC free article] [PubMed] [Google Scholar]
- 63. Shiihara T, Kato M, Ichiyama T, Takahashi Y, Tanuma N, Miyata R, Hayasaka K (2006) Acute encephalopathy with refractory status epilepticus: bilateral mesial temporal and claustral lesions, associated with a peripheral marker of oxidative DNA damage. J Neurol Sci 250:159–161. [DOI] [PubMed] [Google Scholar]
- 64. Steinert JR, Chernova T, Forsythe ID (2010) Nitric oxide signaling in brain function, dysfunction, and dementia. Neuroscientist 16:435–452. [DOI] [PubMed] [Google Scholar]
- 65. Tang SC, Arumugam TV, Xu X, Cheng A, Mughal MR, Jo DG et al (2007) Pivotal role for neuronal Toll‐like receptors in ischemic brain injury and functional deficits. Proc Natl Acad Sci U S A 104:13798–13803. [DOI] [PMC free article] [PubMed] [Google Scholar]
- 66. Toledano MB, Leonard WJ (1991) Modulation of transcription factor NF‐kappa B binding activity by oxidation‐reduction in vitro. Proc Natl Acad Sci U S A 88:4328–4332. [DOI] [PMC free article] [PubMed] [Google Scholar]
- 67. Uttara B, Singh AV, Zamboni P, Mahajan RT (2009) Oxidative stress and neurodegenerative diseases: a review of upstream and downstream antioxidant therapeutic options. Curr Neuropharmacol 7:65–74. [DOI] [PMC free article] [PubMed] [Google Scholar]
- 68. Vaziri ND, Rodriguez‐Iturbe B (2006) Mechanisms of disease: oxidative stress and inflammation in the pathogenesis of hypertension. Nat Clin Pract Nephrol 2:582–593. [DOI] [PubMed] [Google Scholar]
- 69. Vezzani A, French J, Bartfai T, Baram TZ (2011) The role of inflammation in epilepsy. Nat Rev Neurol 7:31–40. [DOI] [PMC free article] [PubMed] [Google Scholar]
- 70. Vezzani A, Friedman A, Dingledine RJ (2013) The role of inflammation in epileptogenesis. Neuropharmacology 69:16–24. [DOI] [PMC free article] [PubMed] [Google Scholar]
- 71. Weydert CJ, Cullen JJ (2010) Measurement of superoxide dismutase, catalase and glutathione peroxidase in cultured cells and tissue. Nat Protoc 5:51–66. [DOI] [PMC free article] [PubMed] [Google Scholar]
- 72. Yoshimura A, Naka T, Kubo M (2007) SOCS proteins, cytokine signalling and immune regulation. Nat Rev Immunol 7:454–465. [DOI] [PubMed] [Google Scholar]
- 73. Zurolo E, Iyer A, Maroso M, Carbonell C, Anink JJ, Ravizza T et al (2011) Activation of Toll‐like receptor, RAGE and HMGB1 signalling in malformations of cortical development. Brain 134:1015–1032. [DOI] [PubMed] [Google Scholar]
Associated Data
This section collects any data citations, data availability statements, or supplementary materials included in this article.
Supplementary Materials
Figure S1. Representative haematoxylin and eosin staining for the classification of HME, FCD IIa, FCD IIb and TSC.
Table S1. Primer sequences used for quantitative real‐time PCR.
Table S2. Clinical information on autopsy control specimens.