

Abstract
The association between p53 immunohistochemistry and TP 53 mutation status has been controversial. The present study aims to re‐evaluate the efficacy of p53 immunohistochemistry to predict the mutational status of TP 53. A total of 157 diffuse gliomas (World Health Organization grades II–IV) were assessed by exon‐by‐exon DNA sequencing from exon 4 through 10 of TP 53 using frozen tissue samples. Immunohistochemistry with a p53 antibody (DO‐7) on paired formalin‐fixed paraffin‐embedded materials was assessed for the extent and intensity of reactivity in all cases. A total of 72 mutations were detected in 66 samples. They included 60 missense mutations, five nonsense mutations, four deletions and three alterations in the splicing sites. A receiver operating characteristic curve analysis revealed that strong p53 immunoreactivity in more than 10% of cells provided the most accurate prediction of mutation. Using this cutoff value, 52 of 55 immunopositive cases harbored a mutation, whereas only 14 of 102 immunonegative cases showed mutations, sensitivity and specificity being 78.8% and 96.7%. Tumors with frameshift mutations frequently showed negative immunostaining. Staining interpretation by an independent observer yielded comparable accuracy. We thus propose p53 immunohistochemistry as a moderately sensitive and highly specific marker to predict TP 53 mutation.
Keywords: astrocytoma, glioblastoma, immunohistochemistry, p53, Sanger sequence
Introduction
The TP53 gene on chromosome 17p13.1 encodes the p53 protein, which plays a pivotal role in multiple cellular processes including G1 arrest, DNA repair, apoptosis and differentiation 15. These activities are largely dependent on its function as a transcription factor, that is, by binding to DNA and activating transcription 11, 27. TP53 mutation is the most frequent genetic alteration among human cancers 13, 26. The p53 protein is inactivated directly by TP53 mutations or indirectly by alterations of genes that interact with p53, such as MDM2 27. TP53 is deemed as a tumor–suppressor gene because its loss of function is involved in the development of tumors and many of TP53 mutations coincide with loss of heterozygosity, leaving no wild‐type allele. However, it is also known that a mutant p53 protein can form a complex with its wild‐type counterpart and impair the activity of the normal protein, acting as a “dominant negative” oncogene 19.
TP53 is strongly involved in the tumorigenesis of gliomas; TP53 mutations are one of the most common genetic alterations (up to 70%) in diffuse astrocytomas World Health Organization (WHO) grade II (DA) and anaplastic astrocytoma grade III (AA) 8. They are almost invariably associated with isocitrate dehydrogenase 1 or 2 (IDH1/2) mutations in these tumors 7. They are however rare among oligodendroglial tumors, another type of diffuse gliomas that frequently harbor IDH1/2 mutation as well as total 1p/19q loss. This has led to the hypothesis that astrocytomas and oligodendroglial tumors share IDH1/2 mutation‐harboring progenitor cells as the common cell of origin, from which astrocytomas develop through acquiring TP53 mutations, among others. On the other hand, TP53 mutations are also common among primary glioblastomas (GBM) found in around 30% of them. Unlike in astrocytomas, TP53 mutations in GBM are not accompanied by preceding IDH1/2 mutations, but co‐operate with inactivation of the RB1 pathway by means of either RB1 mutations or CDK4 amplification, among others, to ensure simultaneous silencing of both the p53 and RB1 pathways. Thus, the mutated TP53 appears to play a dual role in the development of adult gliomas. These tumor‐specific patterns of TP53 mutations make it a valuable potential diagnostic marker 4, 7, 18.
The activity of the p53 protein is mostly controlled post‐translationally. The ubiquitin E3 ligase Mdm2 is a key regulator of p53. Mdm2 binds to p53 and attaches ubiquitin (ubiquitination), leading to degradation of the protein. In addition to the role as a negative regulator, Mdm2 is also known to promote TP53 translation and protein synthesis by interacting with mRNA. These interactions of MDM2 with TP53 at mRNA and protein levels meticulously control the balance between synthesis and degradation of p53 21. The wild‐type p53 protein has a rapid turnover and is normally undetectable by immunohistochemistry (IHC) 14. In contrast, the mutant p53 protein escapes from degradation and accumulates in the cells, thus detected as positive staining by IHC 2. This somewhat paradoxical upregulation of p53 has been exploited to estimate the presence of TP53 mutations.
Practically, p53 IHC using formalin‐fixed paraffin‐embedded materials has been employed as a surrogate for DNA sequencing for detecting mutations. Because TP53 mutation is a characteristic feature of astrocytic tumors while it is rarely observed in pure oligodendrogliomas (OLs) 4, some investigators use positive p53 immunostaining as a diagnostic support to determine astrocytic differentiation in morphologically ambiguous cases. However, several investigations conducted over the last two decades have shown a somewhat disappointing concordance between TP53 mutation status and p53 IHC in a few series of gliomas 5, 10, 12, 16, 22, 24, 29 (Table 1). Although a relatively high concordance ranging from 55% to 82% has been reported in these studies, the frequency of p53 immunoreactivity in the absence of detectable mutations (“false‐positive rate”) was high (11.5%–45.2%). The discrepancy may be rooted in technical limitations, because most of the past investigations have employed the polymerase chain reaction (PCR)‐assisted single‐strand conformation polymorphism (SSCP) technique, which is known to have limited sensitivity in detecting mutations. In addition, criteria for staining interpretation in those earlier works were rather ambiguous, which might also have introduced considerable variability in the certainty of the results. Thus, the reliability of p53 IHC to predict TP53 mutations is currently uncertain.
Table 1.
A literature review of the comparative studies between p53 IHC and TP 53 mutations
| Author | Year | Histology (WHO grade) | No. | Method | Exon | Concordance rate (%) | Immunohistochemistry | False positive (%) | |||
|---|---|---|---|---|---|---|---|---|---|---|---|
| IHC(+)/Mut(+) | IHC(+)/Mut(−) | IHC(−)/Mut(+) | IHC(−)/Mut(−) | ||||||||
| Louis | 1993 | Astrocytic gliomas (II–IV) | 34 | SSCP | 5–8 | 59 | 8 | 10 | 4 | 12 | 29.4 |
| Newcomb | 1993 | Glioblastoma (IV) | 37 | SSCP | 2–11 | 81 | 17 | 7 | 0 | 13 | 18.9 |
| Koga | 1994 | Glioma (II–IV) | 19 | SSCP + Seq | 4–8 | 74 | 5 | 3 | 2 | 9 | 15.8 |
| Lang | 1994 | Astrocytic gliomas (I–III) | 31 | SSCP + Seq | 2–11 | 55 | 6 | 14 | 0 | 11 | 45.2 |
| Schiffer | 1995 | Glioma (I–IV) of childhood | 30 | SSCP + Seq | 5–8 | 73 | 3 | 8 | 0 | 19 | 26.7 |
| Hagel | 1996 | Oligodendrocytic gliomas (II–IV) | 122 | SSCP | 5–9 | 82 | 7 | 15 | 7 | 93 | 12.3 |
| Kyritsis | 1996 | Glioma (II–IV) | 61 | Seq | 5–8 | 82 | 17 | 7 | 4 | 33 | 11.5 |
| Watanabe | 1997 | Astrocytic gliomas (II–IV) | 144 | SSCP + Seq | 4–8 | 74 | nd | 26 | 9 | nd | 18.1 |
| Gillet | 2014 | Glioma (II) | 59 | Ion Torrent + Seq | 1–11 | 78 | 24 | 6 | 7 | 22 | 10.2 |
| This study | 2014 | Glioma (II–IV) | 157 | Seq | 4–10 | 89 | 52 | 3 | 14 | 88 | 2.5 |
Abbreviations: IHC = immunohistochemistry; Seq = DNA sequencing; SSCP = single‐strand conformation polymorphism; WHO = World Health Organization.
Here, we compared the p53 immunoreactivity and the TP53 mutation status obtained by DNA sequencing in 157 diffuse gliomas in order to establish an optimal criterion to interpret p53 immunostaining that best predicts the gene mutation status. We found that a strong p53 immunoreactivity in more than 10% of cells predicts missense mutations of TP53 with a high accuracy, reinstating p53 IHC as a practicable biomarker.
Materials and Methods
Tumor samples
A total of 157 diffuse gliomas were included in the study. All histopathological specimens were reviewed and the tumors were classified according to the latest WHO classification 17. Snap‐frozen fresh tumor tissues obtained at the time of surgery were available for each case. The tumor series include 29 DAs, two OLs, six oligoastrocytomas (OA), 28 AAs, five anaplastic OLs (AO), 19 anaplastic OAs (AOA) and 68 GBMs. Among the 68 GBMs, 62 were primary GBMs (pGBM) and six secondary GBMs (sGBM), which were determined based on the clinical history of the patients. The IDH1/2 mutation and the 1p and 19q copy number status were previously determined for this cohort, using pyrosequencing and multiplex ligation‐dependent probe amplification (MLPA), respectively, as described 1. The study has been approved by the institutional review board.
DNA extraction
Genomic DNA was extracted from the frozen tumor tissues using a DNeasy tissue kit (Qiagen, Tokyo, Japan) according to the manufacturer's recommendations.
TP 53 mutational analysis
TP53 mutations were screened by direct Sanger sequencing in all cases. Sequences in the TP53 exons 4–10, which covered virtually all regions where mutations were previously reported, including mutational hotspots in exons 5–8, as well as at least 10 bases of adjacent intron sequences, were amplified by PCR. Primer sequences are listed in Table 2. PCR was performed in a total of 10 μL reaction containing 10 ng of tumor DNA, 2 μL of 10× PCR buffer, 2 μL of 10 mM dNTPs, 1.6 μL of 25 mM MgCl2, 0.5 μL of each forward and reverse primers (20 μM), and 0.1 μL of 5 U/μL AmpliTaq Gold 360 PCR Master Mix (Applied Biosystems, Inc., Foster City, CA). Initial denaturation was performed at 95°C for 10 minutes. This was followed by 35 cycles of amplification consisting of denaturation at 95°C for 30 s, annealing at 55°C for 30 s and extension at 72°C for 30 s. For the PCR of exon 7, the annealing temperature was set at 60°C, and the amplification cycle was 30. The PCR products were treated with ExoSAP‐IT (USB Corporation, Cleveland, OH, USA). Cycle sequencing was carried out using the BigDye Terminator v3.1 cycle sequencing kit (Applied Biosystems, Inc.). One case (AA043) in which no mutation was found in exons 4–10 despite diffuse positive immunoreactivity (see Results section) was further sequenced for exons 2, 3 and 11.
Table 2.
List of primers
| Exon | Template | Direction | Sequence |
|---|---|---|---|
| 2–3 | gDNA | F | TTGGAAGCGTCTCATGCTG |
| R | GTAGATGGGTGAAAAGAGCAG | ||
| 4 | gDNA | F | M13‐ACGTTCTGGTAAGGACAAGGG |
| R | GAGGAATCCCAAAGTTCCAAAC | ||
| 5–6 | gDNA | F | M13‐GCCGTGTTCCAGTTGCTTTATC |
| R | GCCACTGACAACCACCCTTA | ||
| 7 | gDNA | F | M13‐ACAGGTCTCCCCAAGGCGCAC |
| R | CAGTGTGCAGGGTGGCAAGTG | ||
| 8–9 | gDNA | F | M13‐AAATGGGACAGGTAGGACC |
| R | TGTTAGACTGGAAACTTTCCAC | ||
| 10 | gDNA | F | ACTTACTTCTCCCCCTCCTC |
| R | M13‐GAATCCTATGGCTTTCCAACC | ||
| 11 | gDNA | F | CCTTCAAAGCATTGGTCAGG |
| R | CCAAAACCCAAAATGGCAGG | ||
| 8–11 | cDNA | F | GCGCACAGAGGAAGAGAATC |
| R | GGTAGACTGACCCTTTTTGGAC |
Abbreviations: M13‐ = the M13 forward primer sequence (GTAAAACGACGGCCAG) added to be used for sequencing.
For DA095, the only case with a mutation in intron 9, TA cloning and sequencing using the PCR product were performed in order to accurately determine the mutated sequence. Total RNA was extracted from the frozen samples using an RNeasy Mini Kit (Qiagen) according to the manufacturer's recommendations. First‐strand cDNA was synthesized from 500 ng of total RNA with Superscript III (Invitrogen Life Technologies, Carlsbad, CA, USA). PCR was performed using the primers located within exon 8 (forward) and 11 (reverse) that amplifies a part of the transcript with the condition mentioned above. The PCR product was subcloned into a pMD20‐T vector using the Mighty TA cloning kit (Takara Bio Inc., Tokyo, Japan) and sequenced.
IHC
A 4 μm‐thick section of a representative block for each tumor was deparaffinized. Heat‐induced epitope retrieval was performed with citrate buffer (pH 6.0). The slides were treated with 3% hydrogen peroxide for 20 minutes to block endogenous peroxidase activity, followed by washing in deionized water for 2–3 minutes. The slides were then incubated with a primary antibody against p53 (1:100, DO‐7; Dako, Carpinteria, CA, USA) for 30 minutes at room temperature. Immunoreactions were detected using the EnVision detection system (Dako). The reactions were visualized with 3,3′‐diaminobenzidine, followed by counterstaining with hematoxylin. Only nuclear staining in viable tumor cells was considered significant. The staining intensity was dichotomized into weak and strong as follows: strong intensity was defined as being readily visible using a 4× objective lens, while weak intensity was defined as being readily visible only at higher magnifications. The extent of weak and strong reactivity was separately recorded as a percentage (0%−100%) of the total number of tumor cells examined. The interpretation was performed primarily by careful visual inspection in the most reactive area of the slide, which was complemented by manual counting as necessary. The scoring was performed, blinded to the TP53 mutation status, by a board‐certified pathologist who was in charge of our neuropathology diagnostic service (AY). This assessment was used as a basis for the subsequent analysis to establish the optimal cutoff value to predict TP53 mutation status.
Interobserver reproducibility
To test the reproducibility of the immunohistochemical criteria established in this study, all 157 immunostained slides were independently assessed by a second scorer, who is also a board‐certified pathologist currently actively involved in the neuropathology diagnostic service (SF). This assessment was performed entirely blinded to both the TP53 mutation status and the staining interpretation produced by the first scorer. The results of two scorers were then statistically compared.
Statistical analysis
A receiver operating characteristic (ROC) curve was applied to compare the IHC results and mutational status. The chi‐square test (two tailed) was used to compare the categorical variables. A linear scale was applied to test the inter‐scorer concordance of IHC evaluation and the R 2 value was calculated. Statistical analyses were carried out using JMP® 10 (SAS Institute Inc., Cary, NC, USA). P < 0.05 was considered statistically significant.
Results
DNA sequencing
A total of 72 mutations were detected in 66 samples, including 60 missense mutations, five nonsense mutations, four deletions and three alterations in the splicing sites (Table 3). Mutations were most frequently observed in exon 5 (18 cases, 11.4%) followed by exon 8 (17 cases, 10.8%). The great majority of the mutations were within exon 5 through to exon 8 affecting the DNA binding domain (61/72 cases, 84.7%) (Figure 1). The most common recurrent mutation was R273C (nine cases, 5.7%), followed by R248W (five cases, 3.2%) and R248Q (three cases, 1.9%). All the other 47 types of mutation existed in only one or two tumor samples. Among the 65 single nucleotide substitutions, the great majority were either G : C > A : T (49, 75.4%) or A : T > G : C (9, 13.8%) transition. The prevalence of mutations is shown in Table 3 in reference to the tumor histology. A high incidence of mutations was observed in DAs (16/28 cases, 57.1%), AAs (17/29 cases, 58.6%) and sGBM (4/6 cases, 66.7%). No mutation was found in OLs (0/2 cases) and AOs (0/5 cases) (Table 3). A mutation affecting exon 9 was found in a single case, DA095. This case was found to have a tandem duplication of a 55 base pair (bp) fragment that extended from the 54 bases of exon 9 to the first base of intron 9, inserted after the first base of intron 9, which corresponds to the splice donor site (Figure 2A). As sequencing showed approximately a 50:50 mixture of the inserted and wild‐type sequences (Figure 2A, DA095), it was considered that the insertion occurred in one allele while the other allele remained intact, although the allelic status has not been examined for this case. Sequencing of the cloned RT‐PCR product spanning a part of exon 8 through to exon 11 revealed that the inserted fragment as well as the first base of intron 9 were transcribed, producing a transcript with an additional 55 bp between exon 9 and 10 (Figure 2B,C). This insertion causes a frameshift resulting in the truncation of the protein product (see below).
Table 3.
Profile of TP 53 mutations in 157 gliomas according to the histological diagnosis
| DA | OL | OA | AA | AO | AOA | pGBM | sGBM | Total | |
|---|---|---|---|---|---|---|---|---|---|
| Mutation | |||||||||
| Present | 16 | 0 | 1 | 17 | 0 | 4 | 24 | 4 | 66 |
| Absent | 12 | 2 | 5 | 12 | 5 | 15 | 38 | 2 | 91 |
| Total | 28 | 2 | 6 | 29 | 5 | 19 | 62 | 6 | 157 |
| Frequency (%) | 57.1 | 0.0 | 16.7 | 58.6 | 0.0 | 21.1 | 38.7 | 66.7 | 42.0 |
| Location | |||||||||
| Exon 4 | 1 | 0 | 0 | 2 | 0 | 1 | 2 | 0 | 6 |
| Exon 5 | 3 | 0 | 0 | 3 | 0 | 1 | 9 | 2 | 18 |
| Exon 6 | 3 | 0 | 0 | 5 | 0 | 1 | 2 | 1 | 12 |
| Exon 7 | 3 | 0 | 0 | 6 | 0 | 0 | 5 | 0 | 14 |
| Exon 8 | 5 | 0 | 1 | 3 | 0 | 1 | 5 | 2 | 17 |
| Exon 9 | 1 | 0 | 0 | 0 | 0 | 0 | 0 | 0 | 1 |
| Exon 10 | 0 | 0 | 0 | 0 | 0 | 0 | 4 | 0 | 4 |
| Mutation type | |||||||||
| Missense | 14 | 0 | 1 | 15 | 0 | 3 | 22 | 5 | 60 |
| Nonsense | 1 | 0 | 0 | 2 | 0 | 0 | 2 | 0 | 5 |
| Frameshift | 1 | 0 | 0 | 2 | 0 | 1 | 3 | 0 | 7 |
Abbreviations: AA = anaplastic astrocytoma grade III; AO = anaplastic oligodendroglioma grade III; AOA = anaplastic oligoastrocytoma grade III; DA = diffuse astrocytoma grade II; OA = oligoastrocytoma grade II; OL = oligodendroglioma grade II; pGBM = primary glioblastoma; sGBM = secondary glioblastoma defined by clinical history.
Figure 1.
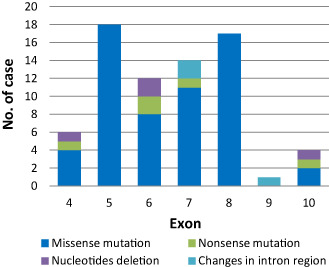
The mutation profile of TP 53 at each exon. Most mutations (61/72, 84.7%) clustered within exons 5–8, which contain the mutation hotspots. There was no mutation within exon 9, except one case with a tandem duplication at the splice donor site in intron 9 (see Figure 2).
Figure 2.
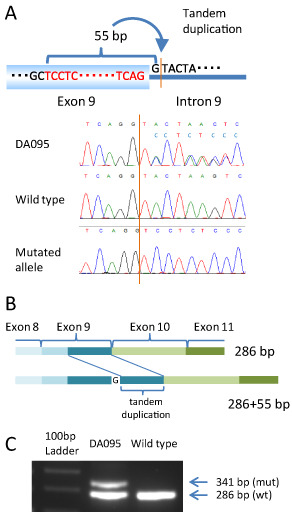
A. A schematic picture of the genetic alteration in DA095, which had a 55 bp tandem duplication inserted after the first base of the splicing site of intron 9. The electropherogram from genomic DNA, the wild‐type and the mutant transcript from the cDNA of DA095 are shown. B. The gene rearrangement caused by this tandem duplication is shown. A 55 bp duplication caused frameshift. C. An electrophoresis image of the polymerase chain reaction products of cDNA from DA095 reveals two products: one being 286 bp from the normal allele and the other 341 bp from the mutant allele.
IHC
Among the 157 cases, 153 (97.5%) showed at least focal p53 staining of any intensity, while four (2.5%) showed a total lack of immunoreactivity. Strong reactivity was observed in 123 cases with a range of 0%–100%, while weak reactivity was seen in 151 cases with a range of 0%–70%. The stained cells were distributed in a relatively uniform manner in all but four cases, in which significant intratumoral staining heterogeneity was observed. The representative findings of IHC are shown in Figure 3.
Figure 3.
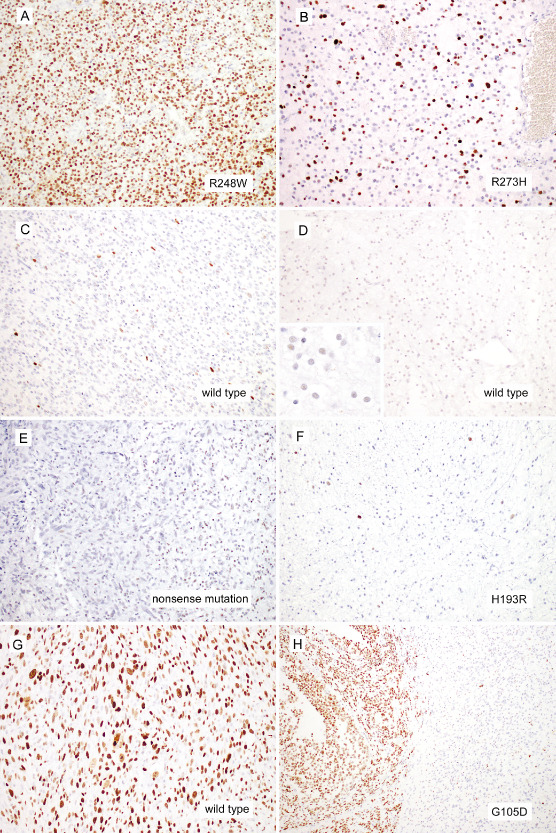
Representative immunohistochemistry images are shown. The majority of TP 53 mutant diffuse gliomas demonstrated strong p53 immunoreactivity in more than 10% of tumor cells (A, AOA025, an anaplastic astrocytoma with R248W mutation; B, DA076, a diffuse astrocytoma with R273H mutation). Similarly, the majority of TP 53 wild‐type diffuse gliomas demonstrated strong p53 reactivity in less than 10% of tumor cells (C, GBM214, a TP 53 wild‐type glioblastoma; D, DA055, a TP 53 wild‐type diffuse astrocytoma. The inset demonstrates that DA055 shows weak p53 immunoreactivity over half of the cells). The p53 immunoreactivity failed to correlate with TP 53 mutation status in some cases. Some TP 53 mutant tumors lacked strong p53 immunoreactivity in >10% of tumor cells, approximately half of which harbored truncating mutations alone (E, AA064, an anaplastic astrocytoma harboring a nonsense TP 53 mutation with only weak p53 immunoreactivity; F, DA090, diffuse astrocytoma harboring a missense mutation with negligible intense p53 immunoreactivity). In contrast, one TP 53 wild‐type tumor exhibited diffuse strong p53 reactivity (G, a TP 53 wild‐type glioblastoma showing diffuse strong p53 staining). A subset of gliomas showed heterogeneous p53 immunoreactivity. In this example of TP 53 mutant (G105D) anaplastic oligoastrocytoma, strong diffuse reactivity was restricted to the left half of this field (H, AOA042). Magnification: A–G: 200×; H: 100×.
Correlation between p53 IHC and TP 53 mutations
In search for optimal criteria to interpret the immunohistochemical results that would best predict the mutation status of p53, the results of direct sequencing and IHC were compared using a ROC curve. The analyses were performed separately taking into consideration either strong staining only, weak staining only or staining of any intensity (ie, strong and weak intensity). The analyses showed that the best performance was achieved when a cutoff value of 14%, 7% or 40% was used for strong staining only, weak staining only and staining of any intensity, respectively. The area under the curve (AUC) for each respective condition was 0.894, 0.664 and 0.887. Although the performance was comparatively high when counting either strong staining only or staining of any intensity, we decided to consider strong staining only for further analysis. This decision was made because a simple 10% cutoff value for strong staining could produce the same accuracy as using 14%, given that no cases represented strong staining in the range of 9%–13% (Figure 4). It was also based on our experience that a 10% cutoff provides more reproducible results and is readily applicable to daily diagnostic practice than a 40% cutoff value. Consequently, the IHC results were interpreted as immunopositive when strongly stained cells constituted more than 10% of all tumor cells examined and as immunonegative when they accounted for less than 10% of them. Using this criterion, all 157 cases were evaluated either as immunopositive (55 cases, 35.0%) or immunonegative (102 cases, 65.0%). When the IHC and mutation status were compared, almost all immunopositive cases harbored TP53 mutations (52/55 cases, 95%), while only 14 of 102 immunonegative cases (14%) had mutations. The sensitivity and specificity of p53 immunoreactivity to predict mutation in the gene were 78.8% and 96.7%, respectively (Table 4).
Figure 4.
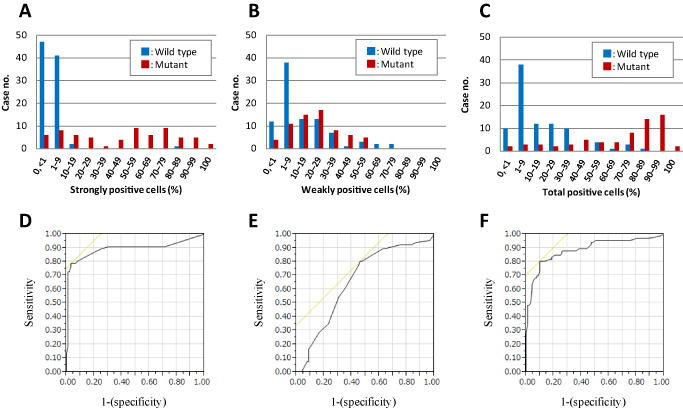
Histograms of cases with positive immunohistochemistry are shown according to the mutation status (blue, wild type; red, mutant). The histograms are for strongly positive (A), weakly positive (B) and positive cells with any intensity (total positive cells; C). Using these counts, a receiver operating characteristic (ROC) analysis was performed (D–F). The ROC curves showed that 14%, 7% or 40% positive cell counts were the appropriate cutoff values in each category, with the areas under curves showing 0.894, 0.664 and 0.887, respectively.
Table 4.
Comparison between the mutation status and immunohistochemistry
| Immunohistochemical staining pattern (% strong positive cells) | Mutational analysis | Summary | |||||||||
|---|---|---|---|---|---|---|---|---|---|---|---|
| Wild type | Missense mutation | Missense and nonsense mutation | Nucleotide deletion | Nonsense mutation | Changes in intron region | Nucleotide deletion and nonsense mutation | IHC | No mutation | Any mutation | % of mutation | |
| 0–9 (n = 102) | 88 | 8 | 2 | 1 | 3 | Negative | 88 | 14 | 14% | ||
| 10–19 (n = 8) | 2 | 4 | 1 | 1 | |||||||
| 20–29 (n = 5) | 5 | ||||||||||
| 30–39 (n = 1) | 1 | ||||||||||
| 40–49 (n = 4) | 4 | ||||||||||
| 50–59 (n = 9) | 9 | Positive | 3 | 52 | 95% | ||||||
| 60–69 (n = 6) | 5 | 1 | |||||||||
| 70–79 (n = 9) | 7 | 1 | 1 | ||||||||
| 80–89 (n = 6) | 1 | 5 | |||||||||
| 90–100 (n = 7) | 7 | ||||||||||
| Total (n = 157) | 91 | 55 | 2 | 3 | 2 | 3 | 1 | 91 | 66 | ||
Abbreviations: IHC = immunohistochemistry.
There was a significant association between the types of TP53 mutation and p53 IHC. The great majority of the cases that harbored one or more missense mutations showed p53 immunopositivity (49/57 cases, 86.0%), while only 33% (3/9 cases) of the cases with protein‐truncating mutations alone showed immunopositivity (P = 0.0003, chi‐square test). Protein‐truncating mutations were overrepresented (six cases) among the 14 immunonegative cases that harbored TP53 mutations; these included deletions (two cases), a nonsense mutation (one case) and intronic mutations (three cases), all of which would result in protein truncation. Similarly, 4 of 6 mutant cases that showed a total lack of strongly stained cells had truncating mutations alone.
There were four cases (two DAs, one AA and one GBM) that showed complete absence of p53 immunoreactivity. Among these cases with a null pattern, only one AA harbored a splicing site mutation in exon 7, while the remaining three cases were found to have no mutation.
There were six cases (two AAs and four GBMs) harboring two mutations in the same sample. Three of these had double missense mutations, two had a missense and a truncating mutation, and one had a truncating mutation and a deletion. All of these cases showed positive IHC.
Heterogeneity
There were four cases with heterogeneous IHC patterns (Figure 3H). When the percentage of immunopositive cells was estimated in the region of positive IHC, all four cases had more than 10% of strongly positive cells (AA086, AOA042, DA042AOA and GBM212; 20%, 30%, 60% and 90%, respectively) and were accordingly judged as positive by IHC.
Reproducibility of the IHC interpretation
To test the reproducibility of the immunohistochemical criteria established above, the second scorer (SF) independently assessed all the slides and recorded the percentage of tumor cells exhibiting strong p53 immunoreactivity. The actual scores (ie, the percentages of strongly stained cells) produced by the two scorers were found highly concordant (R 2 = 0.91; Figure 5). Furthermore, when the 10% cutoff value was used to categorize the results into positives and negatives, the concordance between the two scorers was 98.7% (155/157 cases; Supplementary Table S1). The details of the p53 IHC interpretation by the two scorers as well as the TP53, IDH1/2 and 1p/19q status for each individual cases are listed in Supplementary Table S1.
Figure 5.
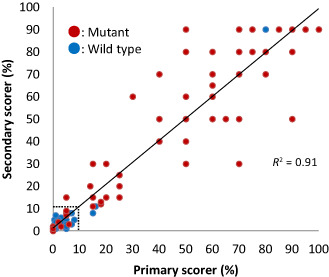
Comparison between the scores (the percentages of strongly p53 immunoreactive cells) by two independent observers showed a strong correlation (R 2 = 0.91). The concordance was even higher (98.7%, 155/157 cases) when the actual scoring was translated into the dichotomous reading in relation to the established 10% cutoff value. The dotted line indicates 10%; red dots, mutant cases; blue dots, wild‐type cases.
Discussion
The aim of the study was to establish an optimal protocol for interpreting the results of p53 IHC in order to accurately predict TP53 mutations. For this purpose, we conducted a thorough screening of the TP53 gene for mutations and compared the results with those obtained by p53 IHC performed on 157 diffuse gliomas. An optimal cutoff value was calculated using a ROC analysis, and 10% positive cells under 40× magnification was determined as the definitive standard. Under these conditions, we demonstrated a high concordance (89%) between the IHC and mutation analysis, the highest among all other previous studies. The false‐positive rate (positive IHC without detectable mutation) was very low (1.9%), indicating that positive IHC is a useful surrogate for the presence of a TP53 missense mutation. The sensitivity and specificity of p53 immunoreactivity to predict a gene mutation were 78.8% and 96.7%, respectively. The positive and negative predictive values were 94.5% and 86.3%, respectively. Furthermore, the interpretative criteria that we established showed an excellent interobserver reproducibility (98.7%). These results demonstrate that p53 IHC is a practicable surrogate for a molecular assay, and therefore may serve as a rapid and easy tool to support diagnostic decision in morphologically challenging cases.
In this study, exons 4–10 including the splicing sites in introns were directly sequenced by the Sanger method. Exons 2, 3 and 11 were not screened because we found no mutations in these exons in a previous study 8. Thus, it is highly assumed that despite omitting exons 2, 3 and 11, our investigation detected all mutations present. The p53 mutations identified in this study were largely concordant with previous reports as compiled in the International Agency for Research on Cancer (IARC) TP53 Database for glioma cases 23 or the Catalogue of Somatic Mutations in Cancer (COSMIC, http://cancer.sanger.ac.uk/cancergenome/projects/cosmic/). The most prevalent mutation in the current study was R273C (nine cases among 65 point mutations, 13.8%), followed by R248W (five cases) and R248Q (three cases). G : C to A : T conversion was dominant (75.4%) as the nucleotide change, which was also in agreement with the IARC database (1109/1389 point mutations in diffuse gliomas, 79.8%). No mutation was detected within exon 9; however, one unusual tandem duplication was found at the splice donor site. The duplicated sequence starts within exon 9 and ends at the first base of intron 9, causing the insertion of 55 bp at the splicing site. This resulted in a frameshift and the production of a truncated protein. There is no record of this tandem insertion in intron 9 in any of the three major databases: IARC TP53 Database, COSMIC or the p53 Knowledgebase (http://p53.bii.a‐star.edu.sg/index.php).
Although the IHC and mutation status were highly concordant (P < 0.0001, chi‐square test), there were 17 discrepancies among the 157 cases. There were 14 cases of negative IHC despite the presence of a mutation, eight of which were missense and six protein truncating either by frameshift or nonsense mutations. The mechanism responsible for the negative immunoreactivity of these cases may depend on the type of the mutation. Among the eight missense mutation cases that showed negative staining, five cases had the same type of mutation (c.578A > G, c.637C > T, c.742C > T, c.817C > T) as found in some of the immunopositive cases. This suggests that the staining patterns are not solely determined by the type of mutation but also by other factors. Truncating mutation cases contributed to 42.9% of negative IHC, and six among nine cases with truncating mutations showed negative IHC. Truncating mutations are known to result in loss of protein expression 25. mRNA containing premature stop codons may be degraded by the nonsense‐mediated decay (NMD) mechanism, resulting in decreased synthesis of the mutant p53 protein 9. Incidentally, the monoclonal antibody for p53 used in this study (DO‐7) recognizes an epitope located between amino acids 19 and 26 at the N‐terminus (encoded in exons 2–3), which should detect a mutant p53 protein regardless of the extent of the truncation 28. The tendency for negative IHC in truncating mutation‐harboring tumors has also been observed in other types of cancer. In an ovarian cancer study, tumors with completely negative IHC showed a strong predisposition to a high probability of truncating mutations (12 out of 17 cases) 31. It is thus clear that a negative IHC does not exclude the presence of mutations, in particular truncating mutations.
Although a positive IHC almost always correctly predicted the presence of a TP53 mutation, there were three cases that showed positive IHC without a mutation. Additional sequencing of exons 2, 3 and 11 for the case, which displayed a particularly strong immunoreactivity (80%, AA043, Figure 3G and Supplementary Table S1), revealed no nucleotide change, confirming the absence of mutation in the entire coding region. There are several possible explanations to this unusual event. It is well known that the MDM2 gene product suppresses the activity of the p53 protein by forming an oligomeric complex 20. Alternatively, p14ARF binds to and promotes the rapid degradation of Mdm2 32. Either MDM2 amplification or p14ARF homozygous deletion, two genetic alterations reported in gliomas, may result in p53 protein inactivation, hence upregulation 6. Activation of EGFR might also affect p53 IHC through downstream AKT phosphorylation leading to MDM2 activation 30. One or more of these factors may have contributed to the positive IHC in the three wild‐type TP53 cases of our study.
There were four cases that showed heterogeneous staining by IHC (Figure 3H). The histological diagnosis of these cases was one AA, two AOAs and one GBM. The heterogeneity in these cases may reflect acquisition of the TP53 mutation in a subpopulation; however, factors other than mutation may also be involved (see above). Although all these four cases had TP53 mutations (three cases: missense mutations; one case: a mutation within the splicing donor site), the staining heterogeneity may cause misinterpretation depending on the sampling 31.
In conclusion, we revisited the decade‐old controversy on the relationship between TP53 mutation and p53 IHC by conducting a thorough comparison in a large series of diffuse glioma samples. Our study established novel criteria to interpret p53 IHC, that is, strong reactivity in 10% or more tumor cells that provides a moderately sensitive and highly specific prediction of TP53 mutation. This readily applicable protocol was also found to produce highly reproducible results between two independent observers, highlighting its value in routine diagnostic practice. Although our findings need to be validated in the future using a separate cohort and/or different staining conditions, a recent study by Gillet et al using 59 grade II gliomas seem to have independently cross‐validated our results, because they also proposed a 10% strong reactivity as an optimal cutoff value to predict TP53 mutation 3. Although we admit that p53 IHC cannot replace molecular testing because approximately 20% of the mutant cases escape from IHC detection typically via protein truncation, our data reinstate p53 IHC as a viable surrogate for mutation analysis, given the high accessibility and low cost of the technique.
Supporting information
Table S1. The TP53 status in each case.
Acknowledgments
This work was supported in part by Grant‐in‐Aid for Scientific Research from the Ministry of Education, Science and Culture of Japan (No. 25462283: KI). The authors thank Sachiko Miura and Chizu Kina for superb technical assistance. The authors thank Dr Sylvia Kocialkowski for critical reading of the manuscript.
References
- 1. Arita H, Narita Y, Fukushima S, Tateishi K, Matsushita Y, Yoshida A et al (2013) Upregulating mutations in the TERT promoter commonly occur in adult malignant gliomas and are strongly associated with total 1p19q loss. Acta Neuropathol 126:267–276. [DOI] [PubMed] [Google Scholar]
- 2. Connelly JH, Bruner JM, Robey‐Cafferty SS, Sahin A (1992) p53 protein expression in transitional mucosa and adenocarcinomas of the colorectum. Mod Pathol 5:537–539. [PubMed] [Google Scholar]
- 3. Gillet E, Alentorn A, Doukouré B, Mundwiller E, van Thuij H, Reijneveld JC et al (2014) TP53 and p53 statuses and their clinical impact in diffuse low grade gliomas. J Neurooncol 118:131–139. [DOI] [PubMed] [Google Scholar]
- 4. Gupta M, Djalilvand A, Brat DJ (2005) Clarifying the diffuse gliomas—an update on the morphologic features and markers that discriminate oligodendroglioma from astrocytoma. Am J Clin Pathol 124:755–768. [DOI] [PubMed] [Google Scholar]
- 5. Hagel C, Laking G, Laas R, Scheil S, Jung R, Milde‐Langosch K, Stavrou DK (1996) Demonstration of p53 protein and TP53 gene mutations in oligodendrogliomas. Eur J Cancer 32A:2242–2248. [DOI] [PubMed] [Google Scholar]
- 6. Haupt Y, Maya R, Kazaz A, Oren M (1997) Mdm2 promotes the rapid degradation of p53. Nature 387:296–299. [DOI] [PubMed] [Google Scholar]
- 7. Ichimura K (2012) Molecular pathogenesis of IDH mutations in gliomas. Brain Tumor Pathol 29:131–139. [DOI] [PubMed] [Google Scholar]
- 8. Ichimura K, Bolin MB, Goike HM, Schmidt EE, Moshref A, Collins VP (2000) Deregulation of the p14ARF/MDM2/p53 pathway is a prerequisite for human astrocytic gliomas with G1‐S transition control gene abnormalities. Cancer Res 60:417–424. [PubMed] [Google Scholar]
- 9. Inoue K, Khajavi M, Ohyama T, Hirabayashi S, Wilson J, Reggin JD et al (2004) Molecular mechanism for distinct neurological phenotypes conveyed by allelic truncating mutations. Nat Genet 36:361–369. [DOI] [PubMed] [Google Scholar]
- 10. Koga H, Zhang S, Kumanishi T, Washiyama K, Ichikawa T, Tanaka R, Mukawa J (1994) Analysis of p53 gene mutations in low‐ and high‐grade astrocytomas by polymerase chain reaction‐assisted single‐strand conformation polymorphism and immunohistochemistry. Acta Neuropathol 87:225–232. [DOI] [PubMed] [Google Scholar]
- 11. Lane DP (1992) Cancer. p53, guardian of the genome. Nature 358:15–16. [DOI] [PubMed] [Google Scholar]
- 12. Lang FF, Miller DC, Pisharody S, Koslow M, Newcomb EW (1994) High frequency of p53 protein accumulation without p53 gene mutation in human juvenile pilocytic, low grade and anaplastic astrocytomas. Oncogene 9:949–954. [PubMed] [Google Scholar]
- 13. Levine AJ (1992) The p53 tumour suppressor gene and product. Cancer Surv 12:59–79. [PubMed] [Google Scholar]
- 14. Linden M, Nathanson S, Zarbo R (1994) Evaluation of anti‐p53 antibody staining‐quality‐control and technical considerations. Appl Immunohistochem 2:218–224. [Google Scholar]
- 15. Louis DN (1994) The p53 gene and protein in human brain tumors. J Neuropathol Exp Neurol 53:11–21. [DOI] [PubMed] [Google Scholar]
- 16. Louis DN, von Deimling A, Chung RY, Rubio MP, Whaley JM, Eibl RH et al (1993) Comparative study of p53 gene and protein alterations in human astrocytic tumors. J Neuropathol Exp Neurol 52:31–38. [DOI] [PubMed] [Google Scholar]
- 17. Louis DN, Ohgaki H, Wiestler OD, Cavenee WK, Burger PC, Jouvet A et al (2007) The 2007 WHO classification of tumours of the central nervous system. Acta Neuropathol 114:97–109. [DOI] [PMC free article] [PubMed] [Google Scholar]
- 18. McLendon R, Friedman A, Bigner D, Van Meir EG, Brat DJ, Mastrogianakis GM et al (2008) Comprehensive genomic characterization defines human glioblastoma genes and core pathways. Nature 455:1061–1068. [DOI] [PMC free article] [PubMed] [Google Scholar]
- 19. Milner J, Medcalf EA (1991) Cotranslation of activated mutant p53 with wild type drives the wild‐type p53 protein into the mutant conformation. Cell 65:765–774. [DOI] [PubMed] [Google Scholar]
- 20. Momand J, Zambetti GP, Olson DC, George D, Levine AJ (1992) The mdm‐2 oncogene product forms a complex with the p53 protein and inhibits p53‐mediated transactivation. Cell 69:1237–1245. [DOI] [PubMed] [Google Scholar]
- 21. Naski N, Gajjar M, Bourougaa K, Malbert‐Colas L, Fahraeus R, Candeias MM (2009) The p53 mRNA–Mdm2 interaction. Cell Cycle 8:31–34. [DOI] [PubMed] [Google Scholar]
- 22. Newcomb EW, Madonia WJ, Pisharody S, Lang FF, Koslow M, Miller DC (1993) A correlative study of p53 protein alteration and p53 gene mutation in glioblastoma multiforme. Brain Pathol 3:229–235. [DOI] [PubMed] [Google Scholar]
- 23. Petitjean A, Mathe E, Kato S, Ishioka C, Tavtigian SV, Hainaut P, Olivier M (2007) Impact of mutant p53 functional properties on TP53 mutation patterns and tumor phenotype: lessons from recent developments in the IARC TP53 database. Hum Mutat 28:622–629. [DOI] [PubMed] [Google Scholar]
- 24. Schiffer D, Cavalla P, Di Sapio A, Giordana MT, Mauro A (1995) Mutations and immunohistochemistry of p53 and proliferation markers in astrocytic tumors of childhood. Childs Nerv Syst 11:517–522. [DOI] [PubMed] [Google Scholar]
- 25. Tashiro H, Isacson C, Levine R, Kurman RJ, Cho KR, Hedrick L (1997) p53 gene mutations are common in uterine serous carcinoma and occur early in their pathogenesis. Am J Pathol 150:177–185. [PMC free article] [PubMed] [Google Scholar]
- 26. Vogelstein B, Kinzler KW (1992) p53 function and dysfunction. Cell 70:523–526. [DOI] [PubMed] [Google Scholar]
- 27. Vogelstein B, Lane D, Levine AJ (2000) Surfing the p53 network. Nature 408:307–310. [DOI] [PubMed] [Google Scholar]
- 28. Vojtesek B, Bartek J, Midgley CA, Lane DP (1992) An immunochemical analysis of the human nuclear phosphoprotein p53. New monoclonal antibodies and epitope mapping using recombinant p53. J Immunol Methods 151:237–244. [DOI] [PubMed] [Google Scholar]
- 29. Watanabe K, Sato K, Biernat W, Tachibana O, von Ammon K, Ogata N et al (1997) Incidence and timing of p53 mutations during astrocytoma progression in patients with multiple biopsies. Clin Cancer Res 3:523–530. [PubMed] [Google Scholar]
- 30. Yarden Y, Pines G (2012) The ERBB network: at last, cancer therapy meets systems biology. Nat Rev Cancer 12:553–563. [DOI] [PubMed] [Google Scholar]
- 31. Yemelyanova A, Vang R, Kshirsagar M, Lu D, Marks MA, Shih Ie M, Kurman RJ (2011) Immunohistochemical staining patterns of p53 can serve as a surrogate marker for TP53 mutations in ovarian carcinoma: an immunohistochemical and nucleotide sequencing analysis. Mod Pathol 24:1248–1253. [DOI] [PubMed] [Google Scholar]
- 32. Zhang Y, Xiong Y, Yarbrough WG (1998) ARF promotes MDM2 degradation and stabilizes p53: ARF‐INK4a locus deletion impairs both the Rb and p53 tumor suppression pathways. Cell 92:725–734. [DOI] [PubMed] [Google Scholar]
Associated Data
This section collects any data citations, data availability statements, or supplementary materials included in this article.
Supplementary Materials
Table S1. The TP53 status in each case.