Abstract
The astrocytic water channel proteins aquaporin 1 (AQP1) and aquaporin 4 (AQP4) are known to be altered in brains affected by several neurodegenerative disorders, including Alzheimer's disease. However, AQP expression in brains affected by Parkinson's disease (PD) has not been described in detail. Recently, it has been reported that α‐synuclein (α‐syn)‐immunolabeled astrocytes show preferential distribution in several cerebral regions, including the neocortex, in patients with PD. Here, we investigated whether AQP expression is associated with α‐syn deposition in the temporal neocortex of PD patients. In accordance with the consensus criteria for dementia with Lewy bodies, the patients were classified into neocortical (PDneo), limbic (PDlim), and brain stem (PDbs) groups. Expressions of α‐syn, AQP1, and AQP4 in the temporal lobes of the individual PD patients were examined immunohistochemically. Immunohistochemical analysis demonstrated more numerous AQP4‐positive and AQP1‐positive astrocytes in the PDneo group than in the PDbs, PDlim, and control groups. However, in the PDneo cases, these astrocytes were not often observed in α‐syn‐rich areas, and semiquantitative analysis revealed that there was a significant negative correlation between the levels of AQP4 and α‐syn in layers V–VI, and between those of AQP1 and α‐syn in layers II–III. These findings suggest that a defined population of AQP4‐ and AQP1‐expressing reactive astrocytes may modify α‐syn deposition in the neocortex of patients with PD.
Keywords: astrocyte, α‐synuclein, immunohistochemistry, pathology, water channel protein
Introduction
Parkinson's disease (PD) is the most common neurodegenerative movement disorder, characterized pathologically by progressive degeneration of the dopaminergic nigrostriatal system and the central and peripheral nervous systems 10. These lesions are associated with deposition of phosphorylated α‐synuclein (α‐syn), leading to widespread occurrence of Lewy neurites (LNs) or Lewy bodies (LBs), but the mechanisms underlying α‐syn propagation and LN/LB formation remain largely uncertain 23.
Although there is no strong correlation between α‐syn deposits and neuronal loss in PD 9, astrocytes appear to be central to the progression of PD. Indeed, it has been reported that the severity of the astrocytic reaction gradually increases with progression of Braak PD stages, and parallels the degree of cortical neuronal involvement 4. Intriguingly, it has been known that the appearance of astrocytic α‐syn inclusions seems to be associated with the progression of the PD stages 4. However, the precise role of astrocytosis or astrocytic α‐syn deposits in the pathomechanism of PD remains largely unknown, and it is also unclear whether α‐syn accumulation in the cerebral cortex in the advanced stages of PD leads to astrocytosis.
The water channel proteins, astrocytic aquaporin 1 (AQP1) and aquaporin 4 (AQP4), plays important roles in water movement in the brain 21. AQP1 is expressed in the apical membrane of the choroid plexus and participates in the formation of cerebrospinal fluid, whereas AQP4 shows polarized localization in astrocyte foot processes and is involved in brain edema formation 24. Both AQP1 and AQP4 are now known to be altered and to play pathophysiological roles in several neurodegenerative diseases 6, 16, 17, 27, as well as in various other brain insults, including stroke and traumatic injury 1. It is well documented that alterations of AQP4 may contribute to the progression of neurodegenerative diseases 11, 18. On the other hand, the pathophysiological roles of AQP1‐expressing astrocytes in brain lesions remain to be elucidated. We have previously reported marked alterations in the expression of AQP1 and AQP4 in relation to amyloid β peptide (Aβ) deposition in brains affected by Alzheimer's disease (AD) 7.
Recently, it has been reported that free water values detectable in diffusion magnetic resonance imaging increase significantly in the substantia nigra of patients with PD 14, 19, indicating that water homeostasis regulated by AQPs may be involved in neurodegeneration in PD. However, to our knowledge, AQP expression in PD brains has not been extensively examined. Moreover, no studies have demonstrated any correlation between the expression of AQP and that of α‐syn in PD. Therefore, we investigated the expression of AQP1 and AQP4 in association with α‐syn deposition in human brains affected by PD.
Materials and Methods
The present study was approved by the Ethics Committee of Fukushima Medical University. Written informed consent for autopsy, collection of samples, and subsequent use for research purposes was obtained from the next of kin of the deceased involved in this study. Brains of 11 patients with PD, 5 age‐matched control patients without neurological disorders, and 5 patients with sporadic AD (Table 1) were examined. The data of control and AD patients was published previously 7.
Table 1.
Clinical and neuropathological features of the patients. Abbreviations: M = male; F = female; PMI = postmortem interval.
| Case | Sex |
at death (years) |
Disease duration (years) |
PMI, (h) |
The DLB criteria*1 |
Braak NFTstage/amyloid deposits stage*2 |
Brain weight (g) |
|---|---|---|---|---|---|---|---|
| Control1 | M | 76 | 3.5 | 1270 | |||
| Control2 | M | 80 | 3 | 1300 | |||
| Control3 | F | 82 | 4.5 | 1210 | |||
| Control4 | M | 77 | 22 | 1175 | |||
| Control5 | M | 76 | 2 | 1275 | |||
| AD1 | F | 104 | 19 | 3.5 | VI/C | 780 | |
| AD2 | F | 86 | 20 | 4.5 | VI/C | 860 | |
| AD3 | F | 86 | 11 | 4 | VI/C | 995 | |
| AD4 | F | 100 | 6 | 3 | VI/C | 935 | |
| AD5 | M | 78 | 12 | 3.5 | VI/C | 910 | |
| PD1 | F | 81 | 23 | 3 | Neocortical | III/C | 1045 |
| PD2 | M | 83 | 18 | 8.5 | Neocortical | IV/B | 1180 |
| PD3 | M | 75 | 25 | 5 | Neocortical | II/C | 1190 |
| PD4 | M | 66 | 27 | 4 | Neocortical | II/B | 1030 |
| PD5 | F | 82 | 17 | 3.5 | Limbic | II/0 | 990 |
| PD6 | M | 83 | 4 | 4.5 | Limbic | II/0 | 1200 |
| PD7 | M | 86 | 7 | 3.5 | Limbic | II/0 | 1060 |
| PD8 | M | 76 | 16 | 5.5 | Limbic | I/0 | 1200 |
| PD9 | M | 73 | 21 | 4.5 | Limbic | II/0 | 1140 |
| PD10 | F | 70 | 22 | 3 | Brainstem | I/0 | 1098 |
| PD11 | M | 80 | 6 | 2 | Brainstem | II/0 | 1010 |
According to the dementia with Lewy bodies (DLB) criteria (*1)15 and Braak NFT or amyloid deposits stage (*2)3.
In accordance with the consensus criteria for dementia with Lewy bodies 15, the patients with PD were classified into neocortical (PDneo, n = 4), limbic (PDlim, n = 5) and brain stem (PDbs, n = 2) groups. AD diagnosis was based on clinical history and postmortem neuropathological verification 3. The temporal lobes (superior, middle, and inferior temporal gyri) of all individuals were used. Paraffin‐embedded sections 4 μm thick were immunostained using the methods described previously 7. As the primary antibodies, we used rabbit polyclonal antibodies against AQP4 (Santa Cruz; 1:500) and AQP1 (Chemicon; 1:1,000). AQP1 and AQP4 immunoreactivity (IR) was semiquantified using image analysis software (Win Roof, Mitani Corp., Japan), as described previously 7. Briefly, three random areas each measuring 3.44 mm2 in the superior, middle and inferior temporal cortex were assessed. The quantification measure, referred to as the relative density of the chromogen reaction, was defined as the saturation value of AQP1 or AQP4 immunostaining on digitized images. All data were expressed as mean ± SD. For statistical analysis, data of PDbs and PDlim were combined and described as PDbs/lim. One‐way ANOVA, followed by the Bonferroni's test, was performed for statistical comparisons of the semiquantitatively measured AQP1‐IR or AQP4‐IR levels. Differences at P < 0.05 were considered statistically significant.
A double‐labeling immunofluorescence study was performed on paraffin sections to characterize the relationship between expression of AQP and that of an astrocyte marker, glial fibrillary acidic protein (GFAP), or α‐syn. We used anti‐AQP4 and anti‐AQP1 antibodies, and mouse monoclonal antibodies against glial fibrillary acidic protein (GFAP, Chemicon; 1:1000) and α‐syn (Wako, Clone number pSyn#64, specific for human α‐syn with a phosphorylated Ser129; 1:5000). For detection of α‐syn, sections were pretreated with 98% formic acid for 5 min. As the secondary antibodies, we used Alexa Fluor 488 goat antimouse IgG (Life Technologies; 1:200) and Cy3‐conjugated donkey antirabbit IgG (Jackson; 1:100). Images of immunolabeled preparations were captured with a microscope digital camera system (DP70, Olympus). The fluorescence intensity, evaluated as relative fluorescence units (RFU), of α‐syn and either AQP1 or AQP4 in all PDneo individuals was quantified using image analysis software (Lumina Vision, Mitani Corp.), employing the methods described previously 7. For double‐peroxidase‐labeling for GFAP and α‐syn, we used the EnVision G|2 double‐stain system (Dako) in accordance with the manufacturer's protocol, and the antibodies against GFAP and α‐syn. Visualization was based on peroxidase using diaminobenzidine and alkaline phosphatase with permanent red as the chromogen. Each GFAP‐ and α‐syn‐IR is also semiquantified using the software (Win Roof).
Five random areas, each measuring 0.14 mm2, in cortical layers II–III and layers V–VI of the superior, middle, and inferior temporal gyri of the double‐fluorescence‐labeled (AQP and α‐syn) sections, and those of the double‐peroxidase‐labeled (GFAP and α‐syn) sections, were assessed. Correlations between AQP and α‐syn levels in terms of RFU, and those between GFAP and α‐syn, were assessed using both Spearman correlation and regression analyses. Additionally, we have quantified the RFU of α‐syn levels in the cortical layers II–III and V–VI of the PDneo group, and statistically compared them using Welch's t test. The level of statistical significance was set at P < 0.05. As negative controls for the staining, fluorescence‐ or peroxidase‐immunostained sections without the primary antibodies were used.
Results
Cortical AQP4‐IR was more intense in both the PDneo and AD groups than in the other groups (Figure 1A–E). As shown in Figure 1F, semiquantitative analysis revealed that the IR in the total and inferior temporal cortex in both the PDneo (48.5 ± 4.62 and 47.8 ± 3.33, respectively) and AD (53.1 ± 12.7 and 52.6 ± 6.78) groups was significantly greater than in the control (40.4 ± 10.8 and 39.3 ± 10.3) and PDbs/lim (36.3 ± 7.42 and 35.3 ± 7.65) groups. Similarly, the IR in the middle and superior temporal cortex in the PDneo group (50.3 ± 4.12 and 47.4 ± 5.89, respectively) was significantly greater than in the PDbs/lim group (37.0 ± 7.89 and 36.5 ± 6.95). Double‐labeling immunofluorescence revealed that the numbers of astrocytes showing AQP4‐IR and GFAP‐IR in the PDneo and AD groups were apparently larger than in the control group (Figure 2A–I). As depicted in Figure 2D–F, most of the GFAP positive cells in the PDneo group showed AQP4 immunoreactivity to varying degrees. In the AD brains, intense AQP4 expression patterns that resembled astrocytic profiles were observed (Figure 2G–I). With regard to the spatial relationship between AQP4‐IR and α‐syn‐IR in the deeper cortical layers V–VI of the PDneo group (Figure 3A–F), areas with weak (lower lane) and strong (upper lane) α‐syn‐IR appeared to inversely show strong and weak AQP4‐IR, respectively. In this group, there was a significant negative correlation between AQP4‐IR and α‐syn‐IR in neocortex layers V–VI (P = 0.0317), but not in neocortex layers II–III (P = 0.2481) (Figure 3G).
Figure 1.
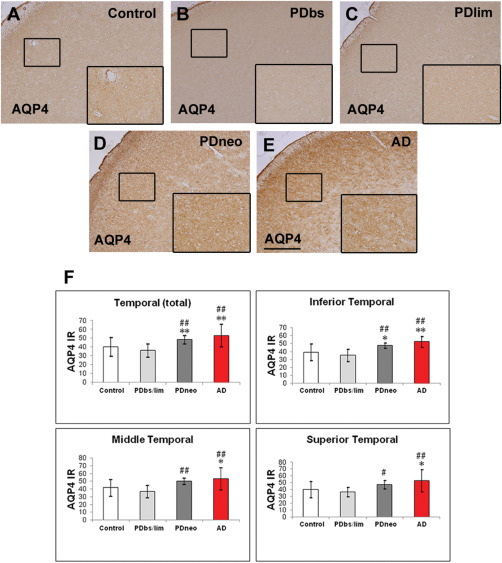
Immunohistochemistry for aquaporin 4 (AQP4) in the control brain (A), and brains with Parkinson's disease (PD) (B–D) and Alzheimer's disease (AD) (E).
PDbs, PDlim, and PDneo denote the brain stem, limbic, and neocortical groups, respectively. AQP4 immunoreactivity (IR) in the PDneo and AD groups is intense. Insets depict AQP4‐labeled areas (small squares). Scale bar: 500 μm. F: Intensity of the AQP4 IR in the total temporal neocortex (upper left panel) as well as in the inferior temporal cortex (upper right panel), in both the PDneo or AD groups is significantly greater than that in the control and PDbs/lim groups. The AQP4 IR in the middle and superior temporal cortex in the PDneo group is significantly greater than in the PDbs/lim group (lower panels). Data are given as mean ± SD. * P < 0.05 vs. control, ** P < 0.01 vs. control, # P < 0.05 vs. PDbs/lim, and ## P < 0.01 vs. PDbs/lim.
Figure 2.
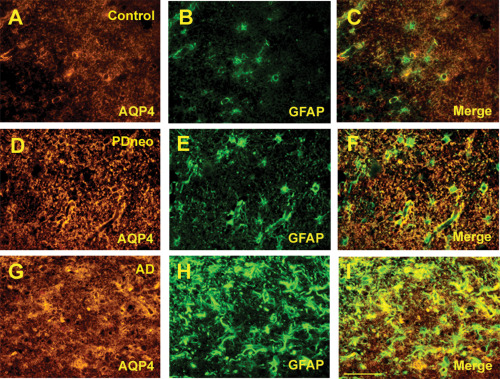
Double immunofluorescence for AQP4 (A, D, G) and glial fibrillary acidic protein (GFAP, B, E, H) in the control, PDneo, and AD groups. Merged image of both signals (C, F, I). Scale bar 50 μm.
Figure 3.
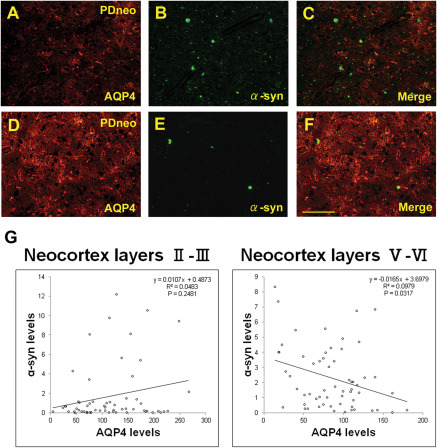
Double immunofluorescence for AQP4 (A, D) and α‐synuclein (α‐syn, B, E) in the PDneo group. Merged image of both signals (C, F). An area with intense AQP4 IR shows sparse α‐syn IR (D–F), whereas another area with relatively weak AQP4 IR contains Lewy bodies and several α‐syn IR (A–C). Scale bar: 100 μm. G: plot of α‐syn and AQP4 IR levels (RFU: relative fluorescence units) in the PDneo group. Semiquantitative analysis revealed a significant negative correlation between α‐syn and AQP4 in cortical layers V–VI (R2 = 0.0979, P = 0.0317), but not in layers II–III.
It was apparent that cortical AQP1‐IR was more intense in both the PDneo and AD groups than in the other groups (Figure 4A–E). The IR in the total, inferior, middle and superior temporal cortex in both the PDneo (22.4 ± 4.86, 24.3 ± 6.24, 21.7 ± 4.61, and 21.1 ± 2.93, respectively) and AD (34.0 ± 7.03, 35.4 ± 8.27, 33.5 ± 6.42, and 33.0 ± 6.51) groups was significantly greater than that in the control (14.2 ± 2.75, 13.2 ± 2.64, 14.2 ± 3.01 and 15.2 ± 2.38) and PDbs/lim (14.4 ± 1.75, 14.7 ± 1.52, 14.5 ± 1.58 and 14.1 ± 2.11) groups (Figure 4F). Additionally, the AQP1 IR in any of these areas was significantly increased in the AD group as compared with those of PDneo group (P < 0.01). AQP1 positive cells were observed in all layers of neocortex. In particular, a large number of them appeared in the pyramidal cell layers of patients in the PDneo and AD groups, whereas only a few AQP1 positive cells were observed in the patients of the other groups. In accordance with the morphological characteristics, AQP1‐IR was evident in reactive astrocytes. Indeed, double fluorescence demonstrated that AQP1‐IR and GFAP‐IR were often colocalized (Figure 5A–I). Although only a subpopulation of GFAP‐positive astrocytes overexpressed AQP1 in the PDneo group, the morphological difference observed with GFAP immunolabeling between AQP1+/GFAP+ and AQP1‐/GFAP+ astrocytes not evident (Figure 5D–F). In the superficial cortical layers II–III of the PDneo group (Figure 6A–F), areas with weak (lower lane) and strong (upper lane) α‐syn‐IR appeared to show inversely strong and weak AQP1‐IR, respectively. Consistent with this observation, in the PDneo group, there was a significant negative correlation between AQP1‐IR and α‐syn‐IR in layers II–III (P = 0.0438), but not in layers V–VI (P = 0.7136) (Figure 6G). With regard to α‐syn‐IR levels, there was no significant difference between in the cortical layers II–III and V–VI in the PDneo group (P = 0.2460).
Figure 4.
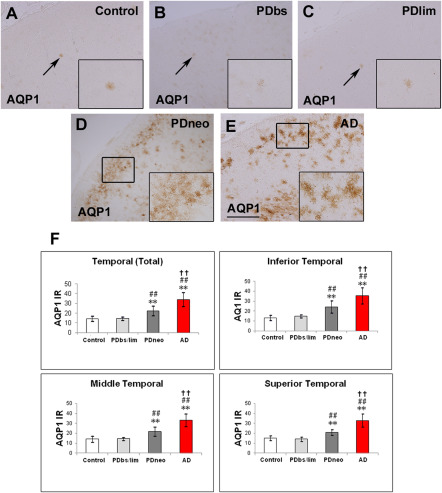
Immunohistochemistry for aquaporin 1 (AQP1) in the control (A), PDbs (B), PDlim (C), PDneo (D), and AD groups (E).
AQP1 IR in the PDneo and AD groups is more intense than in the control and PDbs/PDlim groups. Insets depict AQP1‐labeled structures (arrows) and areas (small squares). Scale bar: 500 μm. F: Intensity of the AQP1 IR in the PDneo or AD group is significantly greater than that in the control or PDbs/lim groups. Data are given as mean ± SD. ** P < 0.01 vs. control, ## P < 0.01 vs. PDbs/lim, and †† P < 0.01 vs. PDneo.
Figure 5.
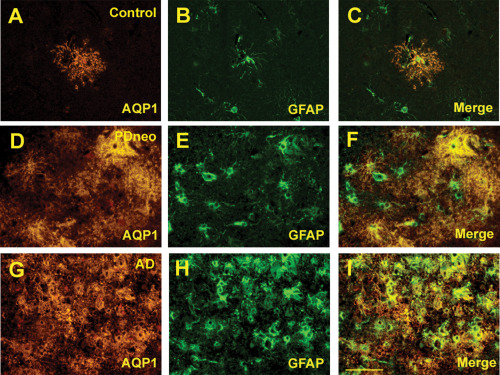
Double immunofluorescence for AQP1 (A, D, G) and GFAP (B, E, H) in the control, PDneo and AD groups. Merged image of both signals (C, F, I). Scale bar: 50 μm.
Figure 6.
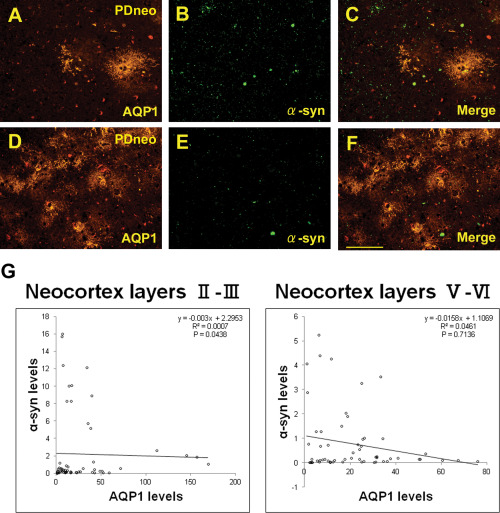
Double immunofluorescence for AQP1 (A, D) and α‐syn (B, E), as well as the merged image (C, F) in the PDneo group. The intensities of AQP1 and α‐syn appear to be inversely correlated. Scale bar: 100 μm. G: Plot of α‐syn and AQP1 IR levels (RFU) in the PDneo group. Semiquantitatively, α‐syn and AQP1 IR show a significant negative correlation in layers II–III (R2 = 0.0007, P = 0.0438), but not in layers V–VI.
There was no significant correlation between GFAP‐IR and α‐syn‐IR levels in layers II–III (P = 0.5906) or in layers V–VI (P = 0.0586) in the PDneo group (Figure 7). In the negative control sections stained without primary antibodies, no or faint lipofuscin‐like granular IR was observed (Supporting Information Figure).
Figure 7.
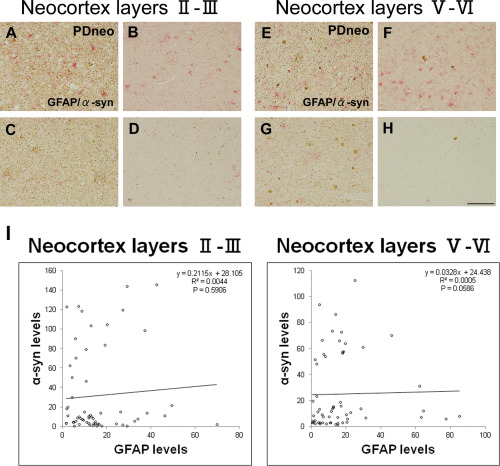
Double‐peroxidase‐labeling for GFAP (red) and α‐syn (brown) in the PDneo group.
A–D: neocortex layers II–III, and E–H: neocortex layers V–VI. Scale bar: 100 μm. Areas with intense (A, C, E, G) and sparse (B, D, F, H) α‐syn IR showing various intensities and numbers of GFAP‐IR astrocytes. I: A semiquantitative analysis showing no significant correlation between α‐syn‐IR and GFAP‐IR levels in layers II–III or in layers V–VI in the PDneo group.
Discussion
In the present study, induction of both AQP4 and AQP1 expression in astrocytes was evident in the temporal neocortex of the PDneo group, but not in the PDbs, PDlim, and control groups, indicating that water homeostasis involving astrocytes might be disturbed in association with the development of α‐syn‐related pathology in the neocortex in PD.
Aggregation of α‐syn in neurons, especially of its phosphorylated form, leads to formation of LBs and LNs, and is crucial for neurodegeneration in PD 26. On the other hand, in routine histology sections of autopsied brains, α‐syn aggregation is detected in a small number of astrocytes in the neocortex of sporadic PD, although these astrocytes can be found much frequently in the brains of patients with SNCA duplication 8. Consistent with this, α‐syn‐IR in the present study appeared to be represented largely by LBs and LNs in neurons, rather than in astrocytes. Recently, however, astrocytic α‐syn‐IR has been noted to develop preferentially in several cerebral regions, including the amygdala, thalamus, septum, claustrum, and cerebral cortex, of patients with sporadic PD showing a Braak neuropathological stage of 4 or higher 5. In the temporal neocortex, the topographical distribution pattern of these α‐syn‐IR astrocytes closely parallels that of the cortical LBs and LNs. Therefore, it has been speculated that a pathological form of the α‐syn molecule escape from the axon terminals of cortical efferent fibers, to be taken up by astrocytes nearby 5, 13. Based on this theoretical background, we investigated a series of temporal neocortex samples from PD patients, in which a various degrees of α‐syn involvement in neurons were evident in the PDneo, PDbs, and PDlim groups.
With regard to α‐syn accumulation in neocortical astrocytes, a previous study has indicated that astrocytes located in cortical layers V–VI are heavily involved, whereas those in layers II–III show a moderate degree of involvement 5. To elucidate the possible association between α‐syn‐IR and astrocytes expressing AQP4 and AQP1, we performed double labeling of these proteins and found that AQP4 expression level was negatively correlated with that of α‐syn in layers V–VI, and AQP1 expression level was negatively correlated with that of α‐syn in layer II–III. It is conceivable that astrocytes in these layers may attempt to take up and degrade the α‐syn 5, 13. Thus, a defined population of AQP4‐ and AQP1‐expressing reactive astrocytes might contribute, at least temporarily, to a reduction in local deposition of α‐syn in a layer‐specific manner. On the other hand, as another hypothesis for the negative correlation between the AQPs and α‐syn, astrocytic uptake of α‐syn might suppress the activity of astrocytes, thus modify the expression of AQPs 25.
A recent biochemical study has indicated that Aβ and α‐syn can act as seeds, and affect each other's aggregation pathways 20. It is true that the neocortex in PDneo patients usually exhibits Aβ senile plaques 12, 22, as was the case in the present study. Furthermore, it has been postulated that Aβ deposition causes abnormal brain water homeostasis by interfering with AQP function 16. Consistent with this, our previous morphological study of AD brains demonstrated characteristic AQP expression in the areas surrounding senile plaques 7. These observations strengthen the view that, in PD, reactive astrocytes expressing AQP are key mediators of α‐syn pathology in conjunction with advancement of the pathological process in the neocortex.
In summary, we have demonstrated significant alterations in the expression of AQP4 and AQP1 in relation to α‐syn deposition in the neocortex affected by PD. Although the main limitation of the present study is its small sample size, we obtained consistent observations that allow us to propose a possible relationship between AQPs and α‐syn. It is not clear how astrocytosis and enlargement of the astroglia in the context of PD impacts on any astrocytic protein 25. According to an in vitro study, the neurotransmitter dopamine regulates astrocyte proliferation and AQP4 expression 2. However, it is unclear whether the similar phenomenon could occur in human brains. Further studies will be needed to elucidate the mechanistic relationship between reactive astrocytes bearing AQP‐mediated water balance and the neurodegenerative process.
Supporting information
Additional Supporting Information may be found in the online version of this article at the publisher's web‐site:
Supplemental Figure Negative controls, in which incubation with primary antibodies had been omitted. (A) Diaminobenzidine immunostaining (Scale bar: 500 μm). (B, C) The EnVision G|2 double‐staining (Scale bar: 100 μm). B and C show each of neocortex layers II‐III and layers V‐VI. (D‐I) Double‐labeling immunofluorescence (Scale bar: 100 μm). As secondary antibodies, we used Cy3‐conjugated donkey anti‐rabbit IgG (D, G) and Alexa Fluor 488 goat anti‐mouse IgG (E, H).
Acknowledgments
This work was supported by JSPS KAKENHI Grant Number 26461314, and a Collaborative Research Project (2224) grant from the Brain Research Institute, University of Niigata. The authors would like to thank Junko Takasaki and Chieko Tanda for their technical assistance.
References
- 1. Badaut J, Fukuda AM, Jullienne A, Petry KG (2013) Aquaporin and brain disease. Biochem Biophys Acta 1840:1554–1565. [DOI] [PMC free article] [PubMed] [Google Scholar]
- 2. Benga I, Benga O (2012) Implications of water channel proteins in selected neurological disorders: epilepsies, muscular dystrophies, amyotrophic lateral sclerosis, neuromyelitis optica, Parkinson's disease, and spongiform encephalopathies. Mol Aspects Med 33:590–604. [DOI] [PubMed] [Google Scholar]
- 3. Braak H, Braak E (1991) Neuropathological staging of Alzheimer‐related changes. Acta Neuropathol 82:239–259. [DOI] [PubMed] [Google Scholar]
- 4. Braak H, Del Tredici K (2008) Invited article: nervous system pathology in sporadic Parkinson disease. Neurology 70:1916–1925. [DOI] [PubMed] [Google Scholar]
- 5. Braak H, Sastre M, Del Tredici K (2007) Development of α‐synuclein immunoreactive astrocytes in the forebrain parallels stages of intraneuronal pathology in sporadic Parkinson's disease. Acta Neuropathol 114:213–241. [DOI] [PubMed] [Google Scholar]
- 6. Foglio E, Fabrizio RL (2010) Aquaporins and neurodegenerative diseases. Curr Neuropharmacol 8:112–121. [DOI] [PMC free article] [PubMed] [Google Scholar]
- 7. Hoshi A, Yamamoto T, Shimizu K, Ugawa Y, Nishizawa M, Takahashi H, Kakita A (2012) Characteristics of aquaporin expression surrounding senile plaques and cerebral amyloid angiopathy in Alzheimer's disease. J Neuropathol Exp Neurol 71:750–759. [DOI] [PubMed] [Google Scholar]
- 8. Ikeuchi T, Kakita A, Shiga A, Kasuga K, Kaneko H, Tan CF, Idezuka J, Wakabayashi K et al (2008) Patients homozygous and heterozygous for SNCA duplication in a family with parkinsonism and dementia. Arch Neurol 65:514–519. [DOI] [PubMed] [Google Scholar]
- 9. Jellinger KA (2008) A critical reappraisal of current staging of Lewy‐related pathology in human brain. Acta Neuropathol 116:1–16. [DOI] [PubMed] [Google Scholar]
- 10. Jellinger KA (2012) Neuropathology of sporadic Parkinson's disease: evaluation and changes of concepts. Mov Disord 27:8–30. [DOI] [PubMed] [Google Scholar]
- 11. Kress BT, Iliff JJ, Xia M, Wang M, Wei HS, Zeppenfeld D, Xie L et al (2014) Impairment of paravascular clearance pathways in the aging brain. Ann Neurol 76:845–861. [DOI] [PMC free article] [PubMed] [Google Scholar]
- 12. Lashley T, Holton JL, Gray E, Kirkham K, O'Sullivan SS, Hilbig A, et al (2008) Cortical α‐synuclein load is associated with amyloid‐β plaque burden in a subset of Parkinson's disease patients. Acta Neuropathol 115:417–425. [DOI] [PubMed] [Google Scholar]
- 13. Lee HJ, Suk JE, Patrick C, Bae EJ, Cho JH, Rho S, Hwang D et al (2010) Direct transfer of α‐synuclein from neuron to astroglia causes inflammatory responses in synucleinopathies. J Biol Chem 285:9262–9272. [DOI] [PMC free article] [PubMed] [Google Scholar]
- 14. Lehéricy S (2013) Diffusion MRI in the diagnosis of parkinsonism and tremor. Mov Disord 28:1762–1763. [DOI] [PubMed] [Google Scholar]
- 15. McKeith IG, Dickson DW, Lowe J, Emre M, O'Brien JT, Feldman H, Cummings J et al (2005) Diagnosis and management of dementia with Lewy bodies: third report of the DLB consortium. Neurology 65:1863–1872. [DOI] [PubMed] [Google Scholar]
- 16. Misawa T, Arima K, Mizusawa H, Satoh J (2008) Close association of water channel AQP1 with amyloid‐β deposition in Alzheimer disease brains. Acta Neuropathol 116:247–260. [DOI] [PMC free article] [PubMed] [Google Scholar]
- 17. Moftakahar P, Lynch MD, Pomakian JL, Vinters HV (2010) Aquaporin expression in the brains of patients with or without cerebral amyloid angiopathy. J Neuropathol Exp Neurol 69:1201–1209. [DOI] [PMC free article] [PubMed] [Google Scholar]
- 18. Nedergaard M (2013) Garbage truck of the brain. Science 340:1529–1530. [DOI] [PMC free article] [PubMed] [Google Scholar]
- 19. Ofori E, Pasternak O, Planetta PJ, Burciu R, Snyder A, Febo M et al (2015) Increased free water values in the substantia nigra of Parkinson's disease: a single‐site and multi‐site study. Neurobiol Aging 36:1097–1104. [DOI] [PMC free article] [PubMed] [Google Scholar]
- 20. Ono K, Takahashi R, Ikeda T, Yamada M (2012) Cross‐seeding effects of amyloid β‐protein and α‐synuclein. J Neurochem 122:883–890. [DOI] [PubMed] [Google Scholar]
- 21. Papadopoulos MC, Verkman AS (2013) Aquaporin water channels in the nervous system. Nat Rev Neurosci 14:265–277. [DOI] [PMC free article] [PubMed] [Google Scholar]
- 22. Pletnikova O, West N, Lee MK, Rudow GL, Skolasky RL, Dawson TM, Marsh L et al (2005) Aβ deposition is associated with enhanced cortical alpha‐synuclein lesions in Lewy body diseases. Neurobiol Aging 26:1183–1192. [DOI] [PubMed] [Google Scholar]
- 23. Schulz‐Schaeffer WJ (2012) Neurodegeneration in Parkinson's disease: moving Lewy bodies out of focus. Neurology 79:2298–2299. [DOI] [PubMed] [Google Scholar]
- 24. Tait MJ, Saadoun S, Bell BA, Papadopoulos MC (2008) Water movements in the brain: role of aquaporin. Trends Neurosci 31:37–43. [DOI] [PubMed] [Google Scholar]
- 25. Tong J, Ang LC, Williams B, Furukawa Y, Fitzmaurice P, Guttman M, Boileau I et al (2015) Low levels of astroglial markers in Parkinson's disease: relationship to α‐synuclein accumulation. Neurobiol Dis 82:243–253. [DOI] [PMC free article] [PubMed] [Google Scholar]
- 26. Xu Y, Deng Y, Qing H (2015) The phosphorylation of α‐synuclein: development and implication for the mechanism and therapy of the Parkinson's disease. J Neurochem. doi: 10.1111/jnc.13234. [DOI] [PubMed] [Google Scholar]
- 27. Yang W, Wu Q, Yuan C, Gao J, Xiao M, Gu M, Ding J et al (2012) Aquaporin‐4 mediates astrocyte response to β‐amyloid. Mol Cell Neurosci 49:406–414. [DOI] [PubMed] [Google Scholar]
Associated Data
This section collects any data citations, data availability statements, or supplementary materials included in this article.
Supplementary Materials
Additional Supporting Information may be found in the online version of this article at the publisher's web‐site:
Supplemental Figure Negative controls, in which incubation with primary antibodies had been omitted. (A) Diaminobenzidine immunostaining (Scale bar: 500 μm). (B, C) The EnVision G|2 double‐staining (Scale bar: 100 μm). B and C show each of neocortex layers II‐III and layers V‐VI. (D‐I) Double‐labeling immunofluorescence (Scale bar: 100 μm). As secondary antibodies, we used Cy3‐conjugated donkey anti‐rabbit IgG (D, G) and Alexa Fluor 488 goat anti‐mouse IgG (E, H).


