Abstract
Spinocerebellar ataxia type 2 (SCA2) is a hereditary neurodegenerative disorder caused by the expansion of the trinucleotide CAG repeats encoding elongated polyglutamine tract in ataxin‐2, the SCA2 gene product. Polyglutamine diseases comprise nine genetic entities, including seven different forms of spinocerebellar ataxias, Huntington's disease, and spinal and bulbar muscular atrophy. These are pathologically characterized by neuronal loss and intranuclear aggregates or inclusions of mutant proteins including expanded polyglutamine in selected neuronal groups. Previously, we examined immunolocalization of ubiquitin, expanded polyglutamine (probed by 1C2 antibody), and ataxin‐2 in genetically confirmed SCA2 patients. In the present study, we expanded this approach by distinguishing different patterns of subcellular 1C2 immunoreactivity (“granular cytoplasmic,” “cytoplasmic and nuclear” and “nuclear with inclusions.”) and by quantifying their regional frequencies in three autopsied SCA2 brains at different stage of the disease. Comparison with neuronal loss and gliosis revealed that overall 1C2 immunoreactivity was paralleled with their severity. Furthermore, appearance of granular cytoplasmic pattern corresponded to early stage, cytoplasmic and nuclear pattern to active stage, and nuclear with inclusions pattern to final stage. We conclude that this 1C2‐immunoreactive typing may be useful for evaluating the overall severity and extent of affected regions and estimating the neuropathological stage of SCA2.
Keywords: 1C2‐immunoreactive typing, cytoplasmic and nuclear, granular cytoplasmic, nuclear with inclusions, spinocerebellar ataxia type 2
Introduction
Polyglutamine diseases are hereditary neurodegenerative disorders that are caused by expanded trinucleotide CAG repeats within the coding region of the disease‐causing gene, which are translated into an abnormally expanded polyglutamine tract in the mutant protein. Polyglutamine diseases comprise at least nine disorders, including dentatorubral–pallidoluysian atrophy, Huntington's disease, several different spinocerebellar ataxias (SCA1, 2, 3, 6, 7 and 17), and spinal and bulbar muscular atrophy 7.
Spinocerebellar ataxia type 2 (SCA2) is one of the polyglutamine diseases clinically characterized by cerebellar ataxia, slow eye movements, hyporeflexia, choreoathetosis and dementia. Worldwide, SCA2 is among the three most frequently occurring types of autosomal dominant spinocerebellar ataxias, together with SCA3 and SCA6 21.
Based on the characteristic distribution of neuronal loss in all three layers of the cerebellar cortex, the inferior olivary nucleus and the pontine nuclei in autopsy cases carrying the SCA2 mutation 10, this disease has been classically known as familial olivopontocerebellar atrophy or the Menzel type of ataxia.
However, recent detailed neuropathological studies 1, 5, 13, 14, 22 have clarified the neuronal degeneration in the cerebellar flocculus, cerebral white matter, cranial nerves, and partial demyelination of the posterior and anterior roots. Nonetheless, some lesions, such as those in the cerebral cortex, hippocampus and dentate nuclei, still have not been confirmed as degenerative sites associated with SCA2. As with other polyglutamine diseases, the gene product containing expanded polyglutamine encoded by the SCA2 gene (ataxin‐2) is considered to be a major component of neuronal intranuclear inclusions (NIIs) 12. Immunohistochemistry for expanded polyglutamine has demonstrated three different patterns: “granular cytoplasmic,” “cytoplasmic and nuclear” and “nuclear with inclusions.” Here we performed a neuropathological study of three autopsy cases in which these three different types of neuronal cytopathology were semiquantified for possible correlation with the severity and extent of neurodegeneration at multiple sites in brains of SCA2 patients. In this study, granular cytoplasmic accumulation of expanded polyglutamine was detectable much more frequently than NII formation and involved a wide range of central nervous system (CNS) regions extending far beyond those previously described to be degenerative in SCA2. Furthermore, we have shown that gradual translocation of expanded polyglutamine from the cytoplasm to the nucleus was associated with increasing severity of neurodegeneration.
Materials and Methods
Brain tissues from three SCA2 patients from unrelated families were obtained post‐mortem. Their clinical features and CAG repeat numbers, confirmed by direct sequencing, are summarized in Table 1. This study also included four control brains of non‐neurological disease (4 male, 53–81 years, mean age: 73 years).
Table 1.
Clinical features of three spinocerebellar ataxia type 2 patients
| Case | 1 | 2 | 3 |
|---|---|---|---|
| CAG repeat size | 41 | 41 | 43 |
| Sex | Male | Female | Male |
| Age at onset | 47 | 27 | 30 |
| Disease duration (years) | 10 | 21 | 20 |
| Dementia | + | + | + |
| Cerebellar ataxia | + | + | + |
| Ophthalmoplegia | + | − | + |
| Slow eye movement | + | + | + |
| Amyotrophy | + | + | + |
| Tendon reflex | Hyporeflexia | Areflexia | Areflexia |
| Involuntary movement | − | + | + |
| Deep sensory disturbance | Not examined | + | + |
+ = positive finding; − = negative finding.
Each brain was fixed in 10% formalin for 3–4 weeks, embedded in paraffin and sectioned at a thickness of 4 μm. Representative sections were stained with hematoxylin and eosin to assess the extent and severity of neuronal loss and gliosis, which were graded independently as −, none; +, mild; ++, moderate; or +++, severe. The extent and severity of neuronal loss and gliosis was evaluated as the fraction of cell loss relative to the control neurons as follows: −, <10% (none); +, 10%–30% (mild); ++, 30%–60% (moderate); and +++, >60% (severe).
Other sections were autoclaved at 121°C for 20 min, incubated in 100% formic acid for 5 min, and then incubated in 1% H2O2 for 10 min. Sections were then immunostained with an anti‐polyglutamine antibody, 1C2 (Chemicon, Temecula, CA, USA, 1:9000) 17, an anti‐ubiquitin antibody, Z0458 (Dako, Denmark, 1:1000) and anti‐ataxin‐2, 15F6 (Immochem, Christchurch, New Zealand, 1:200) using the avidin‐biotin‐peroxidase complex method (ABC Elite, Vector, Burlingame, CA, USA). These immunostained preparations were used to evaluate the subcellular distribution of pathologically altered proteins and NIIs consisting of expanded polyglutamine stretches in ataxin‐2. The overall frequency of 1C2‐positive lesions in each area was evaluated as the fraction relative to the surviving neurons as follows: −, <1%; +, 1%–20%; ++, 20%–40%; +++, 40%–60%; ++++, 60%–80%; +++++, >80%.
In the present study, we expanded this approach by distinguishing different patterns of subcellular 1C2 immunoreactivity (IR; “granular cytoplasmic,” “cytoplasmic and nuclear,” and “nuclear with inclusions.”) and by quantifying their regional frequencies in three autopsied SCA2 brains at different stages of the disease. We counted 100 cells, which were randomly chosen in each region and classified them in three types according to 1C2‐positive neuron typing and calculated relative frequency of each type.
Results
Neuropathological findings in SCA2 brains
For each brain, macroscopic inspection showed marked atrophy of the cerebellum, pons, medulla oblongata, basal ganglia, frontal lobe, and spinal cord as well as depigmentation of the substantia nigra.
In each brain, severe neuronal loss and gliosis were present in all three layers of the cerebellar cortex, and in the pontine nuclei and the inferior olivary nucleus (Figure 1). In the extrapyramidal system and the motor neuron system, marked degeneration was present in the substantia nigra and anterior horn, but these regions contained neither Lewy bodies nor Bunina bodies. The olivocerebellar and pontocerebellar pathways and the posterior column, predominantly Goll's fascicle, contained severe degeneration and astrocytic gliosis. The red nucleus and thalamus, predominantly the medial region, were also moderately affected. The globus pallidus, subthalamic nucleus and locus ceruleus were degenerated to a lesser extent. Degeneration of the head of the caudate nucleus and of the deep layers of the cerebral cortex was observed in case 3, which was an early adult‐onset type in the advanced clinical stage. In all three cases, the cerebral white matter, hippocampus, extra‐oculomotor system and dentate nuclei appeared normal.
Figure 1.
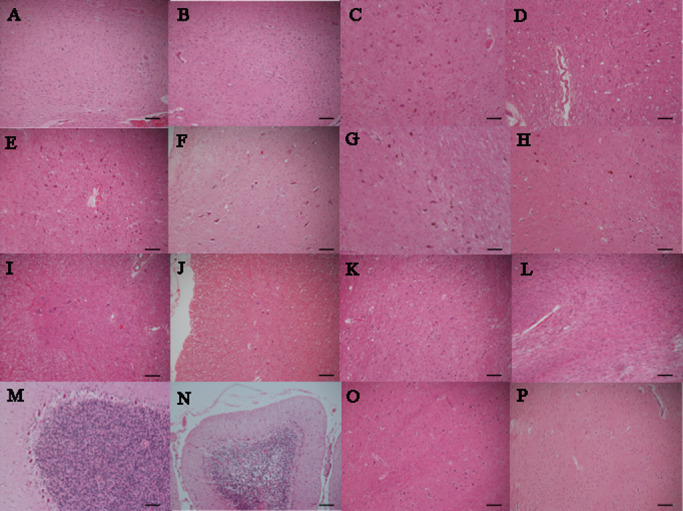
Each extent of neuronal loss and gliosis of spinocerebellar ataxia type 2 ( SCA 2) in comparison with control. A. Dentate nucleus of control. B. No neuronal loss and gliosis of dentate nucleus in SCA2 (case 2). C. Oculomotor nucleus of control. D. Mild neuronal loss and gliosis of oculomotor nucleus in SCA2 (case 2). E. Hypoglossal nucleus of control. F. Mild neuronal loss and gliosis of hypoglossal nucleus in SCA2 (case 3). G. Substantia nigra of control. H. Moderate neuronal loss and gliosis of substantia nigra in SCA2 (case1). I. Anterior horn of control. J. Moderate neuronal loss and gliosis of anterior horn in SCA2 (case 1). K. Pontine nucleus of control. L. Severe neuronal loss and gliosis of pontine nucleus in SCA2 (case 1). (M) Purkinje cells of control. N. Severe neuronal loss and gliosis of Purkinje cells in SCA2 (case 3). O. Inferior olivary nucleus of control. P. Severe neuronal loss and gliosis of inferior olivary nucleus in SCA2 (case 1). (hematoxylin and eosin; scale bars 100 μm).
Photos of each extent of neuronal loss and gliosis of SCA2 in comparison with control are shown in Figure 1. Extent of neuronal loss and gliosis in Figure 1A, Figure 1C and Figure 1E shows mild, moderate and severe, respectively.
Immunohistochemistry in SCA2 brains
To investigate the distribution of neuropathological changes associated with SCA2, we conducted immunohistochemical studies with antibodies targeting ubiquitin, SCA2 protein (ataxin‐2) and expanded polyglutamine stretches (1C2).
Ubiquitin‐like IR was found in the nucleoplasm of most neurons and in the cytoplasm of Purkinje cells (data not shown). Ataxin‐2‐like IR was mainly observed in the cytoplasm and, to a lesser extent, in the nuclei of neurons. This cytoplasmic staining was granular and was sometimes concentrated in the area adjacent to the nucleus (data not shown).
Because 1C2 labeling was the most intense and abundant in SCA2 brains, but absent in normal controls 4, we used 1C2‐immunoreactivity (1C2‐IR) to determine the extent of polyglutamine‐related cytopathology in this study. The cytopathology was classified as A: cytoplasmic granular staining (Figure 2A); B: cytoplasmic and nuclear staining (Figures 2B,C); or C: nuclear staining with NIIs (Figure 2D), in order of decreasing frequency. The relative extent of each category of cytopathology (A, B or C) was also quantified.
Figure 2.
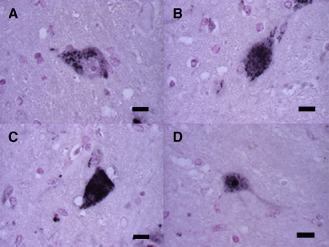
1 C2–IR ‐labeling patterns classified into three groups. 1 C2–IR ‐labeling occurred in three patterns in the pons. A. The first pattern is characterized by granular staining in only the cytoplasm of a neuron. B,C. The second pattern shows fine granular and/or diffuse staining in the nucleus and cytoplasm. D. Neuronal intranuclear inclusions occur in the third pattern. (scale bars 10 μm).
Quantitative data are shown in Table 2. As expected, the most severe degeneration (neuronal loss and gliosis), involving all three layers of the cerebellar cortex and the pontine and inferior olivary nuclei, was found in all three SCA2 cases. Marked degeneration was present in the substantia nigra, anterior horn, cranial nerve nuclei and thalamus, especially in the anterior thalamic nuclei. The frequency of 1C2‐positive structures (1C2‐immunoreactive frequency: 1C2‐IF) of two of the three cases, cases 1 and 2 (CAG repeat number 41 for both cases), was very similar, and that of case 3 (CAG repeat number 43) was significantly higher relative to cases 1 and 2 (P < 0.05, Figure 3). Figure 4 summarizes the results of this morphometric study according to neuronal loss, gliosis and 1C2‐IF. Semiquantitative comparison between degeneration (neuronal loss and gliosis) and the overall 1C2‐IF demonstrated a rough correlation. In mildly affected or unaffected regions of the brain, such as the cerebral cortex, hippocampus, dentate nuclei and cranial nerve nuclei, nuclear labeling was infrequent. The majority of these neurons exhibited the granular type of cytoplasmic staining. In cerebral white matter, 1C2 labeling was observed in a few glial cells. Except for in the cerebellar cortex, in the most severely affected regions, such as the pontine nucleus, substantia nigra, inferior olivary nucleus, thalamus, anterior horn, and locus ceruleus, the majority of neurons exhibited the cytoplasmic and nuclear type of staining.
Table 2.
Neuropathological features in spinocerebellar ataxia type 2 patients
| Case 1 | Case 2 | Case 3 | |||||||||||||||||
|---|---|---|---|---|---|---|---|---|---|---|---|---|---|---|---|---|---|---|---|
| 1C2‐IR type (%) | 1C2‐IR type (%) | 1C2‐IR type (%) | |||||||||||||||||
| NL | G | 1C2 | CS | CNS | NS | NL | G | 1C2 | CS | CNS | NS | NL | G | 1C2 | CS | CNS | NS | ||
| Cerebral cortex (frontal) | III ● IV | − | − | + | 70 | 30 | 0 | − | − | + | 71 | 29 | 0 | − | − | ++ | 83 | 17 | 0 |
| V ● VI | − | − | ++ | 60 | 35 | 5 | − | − | ++ | 58 | 23 | 19 | ++ | ++ | +++ | 55 | 44 | 1 | |
| Cerebral cortex (occipital) | III ● IV | − | − | + | 100 | 0 | 0 | − | − | + | 61 | 26 | 13 | − | − | ++ | 17 | 83 | 0 |
| V ● VI | − | − | ++ | 68 | 32 | 0 | − | − | ++ | 41 | 24 | 35 | ++ | ++ | ++ | 32 | 68 | 0 | |
| Hippocampus | − | − | + | 87 | 13 | 0 | − | − | +++ | 93 | 7 | 0 | − | − | ++ | 88 | 8 | 4 | |
| Cerebral white matter | − | − | + | 100 | 0 | 0 | − | − | − | 0 | 0 | 0 | − | + | + | 100 | 0 | 0 | |
| Caudate nucleus | − | − | + | 70 | 30 | 0 | − | − | − | 0 | 0 | 0 | + | ++ | ++ | 91 | 9 | 0 | |
| Putamen | − | − | + | 80 | 20 | 0 | − | − | − | 0 | 0 | 0 | + | + | ++ | 83 | 17 | 0 | |
| Pallidum | + | + | ++ | 20 | 80 | 0 | − | − | − | 0 | 0 | 0 | + | + | + | 100 | 0 | 0 | |
| Thalamus | ++ | ++ | ++ | 42 | 58 | 1 | ++ | ++ | + | 100 | 0 | 0 | ++ | ++ | ++ | 60 | 40 | 0 | |
| Oculomotor nucleus | − | − | +++ | 91 | 9 | 0 | + | + | ++ | 93 | 7 | 0 | + | + | +++ | 93 | 7 | 0 | |
| Red nucleus | + | + | ++++ | 81 | 18 | 1 | ++ | ++ | ++ | 90 | 10 | 0 | ++ | ++ | ++++ | 75 | 24 | 1 | |
| Substantia nigra | ++ | ++ | ++++ | 68 | 30 | 2 | +++ | +++ | ++++ | 71 | 25 | 4 | +++ | +++ | ++++ | 75 | 21 | 4 | |
| Subtjalamic nucleus | + | + | + | 100 | 0 | 0 | + | + | + | 100 | 0 | 0 | + | + | + | 100 | 0 | 0 | |
| Abducens nucleus | − | − | − | 0 | 0 | 0 | − | − | − | 0 | 0 | 0 | − | − | + | 100 | 0 | 0 | |
| Potine nucleus | +++ | +++ | +++++ | 19 | 75 | 6 | +++ | +++ | +++ | 41 | 33 | 26 | +++ | +++ | ++++ | 31 | 54 | 15 | |
| Locus ceruleus | − | − | ++ | 71 | 29 | 0 | − | − | ++ | 100 | 0 | 0 | + | + | + | 67 | 33 | 0 | |
| Hypoglossal nucleus | − | − | + | 82 | 18 | 0 | + | + | ++ | 71 | 29 | 0 | + | + | ++ | 82 | 18 | 0 | |
| Vestibular nucleus | − | − | + | 64 | 36 | 0 | + | + | + | 64 | 36 | 0 | + | + | + | 69 | 31 | 0 | |
| Inferior olivary nucleus | +++ | +++ | ++ | 33 | 67 | 0 | +++ | +++ | +++++ | 44 | 50 | 6 | +++ | +++ | +++++ | 16 | 79 | 5 | |
| Anterior horn | ++ | ++ | +++ | 41 | 59 | 0 | +++ | +++ | +++++ | 35 | 53 | 12 | +++ | +++ | +++++ | 41 | 46 | 13 | |
| Clarke's nucleus | + | + | + | 71 | 29 | 0 | + | + | + | 100 | 0 | 0 | + | + | + | 100 | 0 | 0 | |
| Anterior roots | + | − | + | 100 | 0 | 0 | + | − | + | 100 | 0 | 0 | + | − | + | 100 | 0 | 0 | |
| Posterior roots | + | − | + | 100 | 0 | 0 | + | − | + | 100 | 0 | 0 | + | − | + | 100 | 0 | 0 | |
| Cerebellar cortex (Purkinje layer) | +++ | +++ | ++ | 100 | 0 | 0 | +++ | +++ | ++ | 100 | 0 | 0 | +++ | +++ | ++ | 100 | 0 | 0 | |
| Cerebellar cortex (granular layer) | +++ | +++ | ++ | 100 | 0 | 0 | +++ | +++ | ++ | 100 | 0 | 0 | +++ | +++ | ++ | 100 | 0 | 0 | |
| Cerebellar cortex (molecular layer) | +++ | +++ | ++ | 100 | 0 | 0 | +++ | +++ | ++ | 100 | 0 | 0 | +++ | +++ | ++ | 100 | 0 | 0 | |
| Cerebellar cortex (golgi cell) | + | + | +++ | 25 | 75 | 0 | + | + | + | 78 | 22 | 0 | + | + | ++ | 40 | 60 | 0 | |
| Dentate nucleus | − | − | + | 68 | 32 | 0 | − | − | ++ | 94 | 0 | 6 | − | − | +++ | 75 | 25 | 0 | |
1C2 = 1C2‐immunoreactive frequency; CNS = cytoplasmic and nuclear staining; CS = granular cytoplasmic staining; G = gliosis; NL = neuronal loss; NS = nuclear with inclusions staining.
NL, G: “−” = <10% (none); “+” = 10–30% (mild); “++” = 30–60% (moderate); “+++” = >60% (severe).
1C2: “−” = <1%; “+” = 1–20%; “++” = 20–40%; “+++” = 40–60%; “++++” = 60–80%; “+++++” = >80%.
Figure 3.
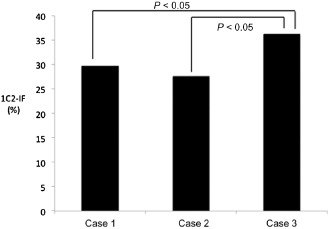
1 C2 ‐immunoreactive frequency (1 C2‐IF ) in three patients with SCA 2. The 1C2‐IF of cases 1 and 2 was very similar, and that of case 3 was higher.
Figure 4.
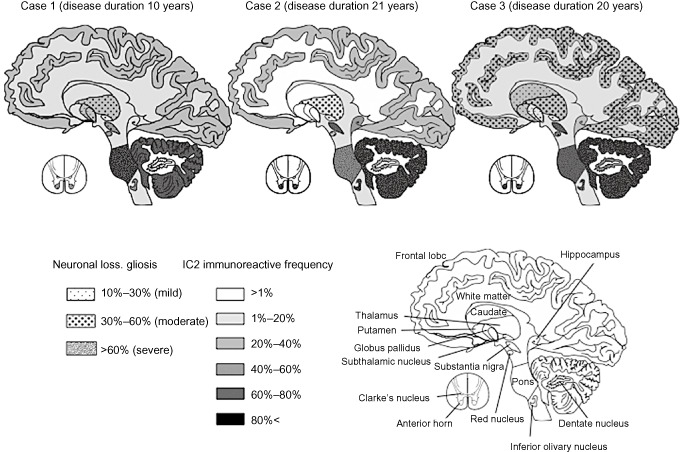
Mapping of the severity and extent of neuronal loss, gliosis and 1 C 2‐immunoreactive frequency (1 C2‐IF ) in three patients with SCA 2. The severity and extent of neuronal loss and gliosis increased almost in parallel with the 1C2‐IF.
Although NIIs were generally infrequent (1%–5%) and were mainly observed in severely affected neurons, such as those in the inferior olive, substantia nigra, and particularly in the pontine nuclei and anterior horn (10%–30%), they were sometimes found in the cerebral cortex where neuronal loss and gliosis were mild or even undetectable. Conversely, in the remaining CNS regions, such as the cerebellar cortex, including the Purkinje, granular and molecular layers, severe neuronal death, gliosis and 1C2‐positive cytoplasmic granular structures were observed, but NIIs were not found at all. Thus, neuronal loss and NII formation were not necessarily concomitant. Figures 5A–C shows regional differences in respective frequencies of the three 1C2–IR‐labeling patterns in the three SCA2 cases, which are summarized in Figure 6.
Figure 5.
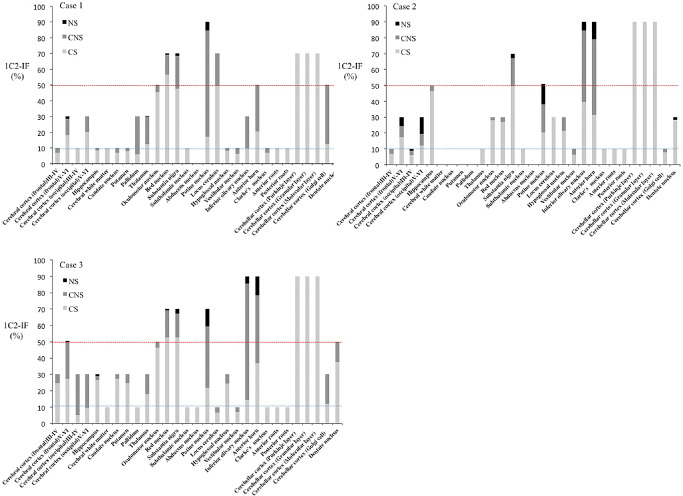
Regional frequencies of three 1 C2–IR ‐labeling patterns in three SCA 2 cases. A. In case 1, regions having 50% (red dotted line) or more 1C2‐immunoreactive frequency (1C2‐IF) included the oculomotor nucleus, red nucleus, substantia nigra, pontine nuclei, locus ceruleus, anterior horn, Purkinje layer and Golgi complex cells. Regions with 1C2‐IF of less than 10% (blue dotted line) were numerous, and nuclear staining with NIs was rarely observed. B. In case 2, regions having 50% or more 1C2‐IF included the hippocampus, substantia nigra, pontine nuclei, inferior olivary nucleus, anterior horn, Purkinje cells and the differences by region were remarkable. C. In case 3, regions having 50% or more 1C2‐IF included the cerebral cortex, oculomotor nuclei, red nucleus, substantia nigra, pontine nuclei, inferior olivary nucleus, anterior horn, Purkinje layer, and dentate nuclei, and the total 1C2‐IF for all patterns was high in each region. CNS = cytoplasmic and nuclear staining; CS = granular cytoplasmic staining; NS = nuclear with inclusions staining.
Figure 6.
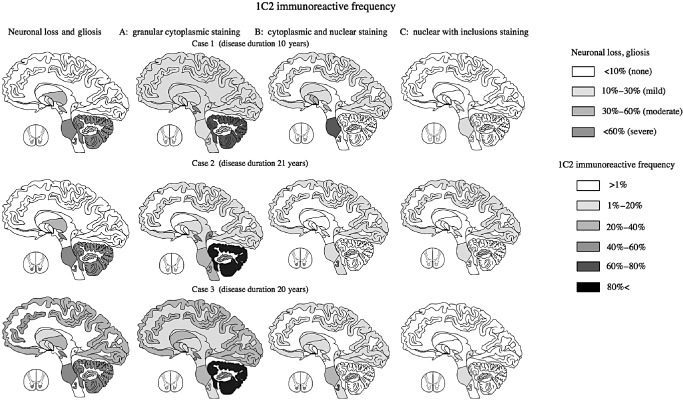
Distribution according to neuronal loss, gliosis, and 1 C 2‐immunoreactive frequency (1 C2‐IF ) of three labeling patterns in three patients with spinocerebellar ataxia type 2 ( SCA 2). The first pattern (cytoplasmic granular staining) was seen in almost all diffuse lesions in all three SCA2 cases. The second pattern was seen mainly in degenerative lesions (those with neuronal loss and gliosis) except for in the cerebellum. The third pattern was found in severely and mildly degenerative lesions.
Discussion
The clinical and neuropathological findings for the three cases of SCA2 analyzed in this study were similar to those described by others 3, 15, 19. The 1C2‐imunoreactive regions were distributed widely in the CNS of this patient, as seen in the previous autopsy cases of SCA2 patients 9, 12, 16. As reported by Pang and colleagues 16 and Ishida et al 9, when analyzed by 1C2‐IR, neuropathological changes were much more extensively observed, that is, not only in the pontine nuclei, substantia nigra, inferior olivary nucleus, thalamus, anterior horn, cranial nerve nuclei and cerebellar cortex, but also in the cerebral cortex, hippocampus, and dentate nuclei, where conventional microscopic evaluation fails to identify degenerative changes.
The main aim of this study was to map the overall 1C2‐IF and the severity and extent of polyglutamine‐related cytopathology in SCA2 brains, to investigate the regional distribution and cellular localization of 1C2 in CNS tissue from SCA2 patients. According to Figure 3, it remains to be clarified whether this small difference in CAG repeat number may explain the overall extent of 1C2‐IF.
The 1C2‐IR regions covered all areas with degeneration and also areas not showing degenerative effects, such as the cerebral cortex, hippocampus and dentate nuclei.
Next, we classified the 1C2–IR‐labeling patterns into three groups based on the frequency of affected neurons (Figure 2). The first pattern was cytoplasmic granular staining (Figure 2A), the second pattern was cytoplasmic and nuclear staining (Figures 2B,C), and the third pattern was nuclear staining with NIIs (Figure 2D). The first pattern (cytoplasmic granular staining) was seen in almost all CNS regions in SCA2 irrespective of different disease durations. Especially in mildly or unaffected neurons such as those in the cerebral cortex, white matter, hippocampus, dentate nuclei and cranial nerve nuclei with an 1C2‐IF of less than about 10%, this was the only pattern observed (Figure 5). Thus, this cytoplasmic deposition of 1C2 may represent the early stage of cellular pathological changes in SCA2.
The second pattern (cytoplasmic and nuclear staining) was seen in regions with a 1C2‐IF of more than about 10% (Figure 5). In particular, this pattern was mainly seen in degenerative lesions (those with neuronal loss and gliosis) such as those in the pontine nuclei, substantia nigra, inferior olivary nucleus, thalamus, anterior horn and locus ceruleus, but not in the cerebellar cortex. Therefore, this pattern may reflect the active stage of cellular pathological changes in SCA2 with the exception of the cerebellar cortex.
The third pattern (nuclear staining with NIIs) was found in regions with a 1C2‐IF of more than about 50% and was rarely observed in case 1, which had the shortest disease duration. Although this pattern was found in severely affected lesions, such as those in the pontine nuclei, inferior olive, substantia nigra and anterior horn (but not in the cerebellar cortex), it was occasionally found in the cerebral cortex, where neuronal loss and gliosis remained mild or undetectable. Whether this pattern leads to cell death or protects neurons is controversial 2, 18. Nonetheless, this pattern may reflect the final stage of cellular pathological changes in SCA2.
Our observations of subcellular 1C2 immmunoreactive patterns are similar to the features seen in cultured cells and in a transgenic mouse model. PC12 cells transiently transfected with full‐length expanded ataxin‐2 display occasional cytoplasmic inclusions (1%–2%) that are typically diffuse or punctate. On the other hand, truncated expanded ataxin‐2 was detected in both the nucleus and cytoplasm, and formed inclusions in both compartments 20. In transgenic mice carrying expanded ataxin‐2, the number of Purkinje cells with inclusions and the size of the inclusions increased with age, whereas diffuse cytoplasmic staining became nearly undetectable at advanced ages 6. This gradual translocation of 1C2‐positive deposits from the cytoplasm to the nucleus was clarified in human SCA2 brains for the first time by our quantitative approach based on cytopathological typing, and this translocation was associated with increasing severity of neurodegeneration and increased overall 1C2‐IR.
However, as shown in Figure 5, NIIs were generally infrequent, and most surprisingly, 1C2 accumulation in the cerebellar cortex exhibiting the most severe neurodegeneration was restricted to cytoplasm as the granular staining pattern. Previous reports also demonstrate that Purkinje cells rarely develop NIIs in SCA2 8 and in brains affected by other polyglutamine diseases 11, suggesting that there may exist a specific cellular environment preventing nuclear translocation of expanded polyglutamine in Purkinje cells. Along with the observation that early cytoplasmic granular staining was detectable prior to neuronal loss and gliosis, we suppose that expanded polyglutamine exerts neurotoxicity mainly in the cytoplasm in SCA2. Nuclear translocation of expanded polyglutamine is associated with disease progression, but may not be necessary for the SCA2 pathogenesis. Alternatively, nuclear pathology is important for developing neurotoxicity, and the cerebellar cortex is the exceptional region in which neurodegeneration is mediated by other mechanisms in SCA2. Our immmunoreactive typing method is superior to simple 1C2 mapping for elucidation of the underlying mechanism that governs severity, extent, and neuropathological stage of affected regions, and also to elucidate the subcellular location of neurotoxicity in SCA2 brains. Additional SCA2 brains are necessary to establish region‐dependent progression of SCA2‐specific pathology in human brains for more accurate staging so that the cellular and molecular mechanisms underlying the neuronal loss and gliosis seen in SCA2 are clarified.
Acknowledgments
This work was supported by a grant–in Aid for Scientific Research (C) (23591279) from the Japan Society for Promotion of the Sciences. We would like to thank Ms. K. Yamaoka, who provided technical support for pathological examinations.
References
- 1. Armstrong J, Bonaventura I, Rojo A, González G, Corral J, Nadal N et al (2005) Spinocerebellar ataxia type 2 (SCA2) with white matter involvement. Neurosci Lett 381:247–251. [DOI] [PubMed] [Google Scholar]
- 2. Arrasate M, Mitra S, Schweitzer ES, Segal MR, Finkbeiner S (2004) Inclusion body formation reduces levels of mutant Huntington and the risk of neuronal death. Nature 431:805–810. [DOI] [PubMed] [Google Scholar]
- 3. Dürr A, Smadja D, Cancel G, Lezin A, Stevanin G, Mikol J et al (1995) Autosomal dominant cerebellar ataxia type I in Martinique (French West Indies). Clinical and neuropathological analysis of 53 patients from three unrelated SCA2 families. Brain 118:1573–1581. [DOI] [PubMed] [Google Scholar]
- 4. Fujigasaki H, Uchihara T, Koyano S, Iwabuchi K, Yagishita S, Makifuchi T et al (2000) Ataxin‐3 is translocated into the nucleus for the formation of intranuclear inclusions in normal and Machado‐Joseph disease brains. Exp Neurol 165:248–256. [DOI] [PubMed] [Google Scholar]
- 5. Gierga K, Bürk K, Bauer M, Orozco Diaz G, Auburger G, Schultz C et al (2005) Involvement of the cranial nerves and their nuclei in spinocerebellar ataxia type 2 (SCA2). Acta Neuropathol 109:617–631. [DOI] [PubMed] [Google Scholar]
- 6. Hansen ST, Meera P, Otis TS, Pulst SM (2013) Changes in Purkinje cell firing and gene expression precede behavioral pathology in a mouse model of SCA2. Hum Mol Genet 22:271–283. [DOI] [PMC free article] [PubMed] [Google Scholar]
- 7. He XH, Lin F, Qin ZH (2010) Current understanding on the pathogenesis of polyglutamine diseases. Neurosci Bull 26:247–256. [DOI] [PMC free article] [PubMed] [Google Scholar]
- 8. Huynh DP, Figueroa K, Hoang N, Pulst SM (2000) Nuclear localization or inclusion body formation of ataxin‐2 are not necessary for SCA2 pathogenesis in mouse or human. Nat Genet 26:44–50. [DOI] [PubMed] [Google Scholar]
- 9. Ishida C, Komai K, Yonezawa K, Sakajiri K, Nitta E, Kawashima A, Yamada M (2011) An autopsy case of an aged patient with spinocerebellar ataxia type 2. Neuropathology 31:510–518. [DOI] [PubMed] [Google Scholar]
- 10. Iwabuchi K, Tsuchiya K, Uchihara T, Yagishita S (1999) Autosomal dominant spinocerebellar degenerations. Clinical, pathological, and genetic correlations. Rev Neurol (Paris) 155:255–270. [PubMed] [Google Scholar]
- 11. Koyano S, Iwabuchi K, Yagishita S, Kuroiwa Y, Uchihara T (2002) Paradoxical absence of nuclear inclusion in cerebellar Purkinje cells of hereditary ataxias linked to CAG expansion. J Neurol Neurosurg Psychiatry 73:450–452. [DOI] [PMC free article] [PubMed] [Google Scholar]
- 12. Koyano S, Uchihara T, Fujigasaki H, Nakamura A, Yagishita S, Iwabuchi K (1999) Neuronal intranuclear inclusions in spinocerebellar ataxia type 2: triple‐labeling immunofluorescent study. Neurosci Lett 273:117–120. [DOI] [PubMed] [Google Scholar]
- 13. Lastres‐Becker I, Rüb U, Auburger G (2008) Spinocerebellar ataxia 2 (SCA2). Cerebellum 7:115–124. [DOI] [PubMed] [Google Scholar]
- 14. Malandrini A, Galli L, Villanova M, Palmeri S, Parrotta E, DeFalco D et al (1998) CAG repeat expansion in an Italian family with spinocerebellar ataxia type 2 (SCA2): a clinical and genetic study. Eur Neurol 40:164–168. [DOI] [PubMed] [Google Scholar]
- 15. Orozco G, Estrada R, Perry TL, Araña J, Fernandez R, Gonzalez‐Quevedo A et al (1989) Dominantly inherited olivopontocerebellar atrophy from eastern Cuba. Clinical, neuropathological, and biochemical findings. J Neurol Sci 93:37–50. [DOI] [PubMed] [Google Scholar]
- 16. Pang JT, Giunti P, Chamberlain S, An SF, Vitaliani R, Scaravilli T et al (2002) Neuronal intranuclear inclusions in SCA2: a genetic, morphological and immunohistochemical study of two cases. Brain 125:656–663. [DOI] [PubMed] [Google Scholar]
- 17. Paulson HL, Perez MK, Trottier Y, Trojanowski JQ, Subramony SH, Das SS et al (1997) Intranuclear inclusions of expanded polyglutamine protein in spinocerebellar ataxia type 3. Neuron 19:333–344. [DOI] [PubMed] [Google Scholar]
- 18. Pril R, Fischer DF, Maat‐Schieman ML, Hobo B, de Vos RA, Brunt ER et al (2004) Accumulation of aberrant ubiquitin induces aggregate formation and cell death in polyglutamine diseases. Hum Mol Genet 13:1803–1813. [DOI] [PubMed] [Google Scholar]
- 19. Rüb U, Del Turco D, Del Tredici K, de Vos RA, Brunt ER, Reifenberger G et al (2003) Thalamic involvement in a spinocerebellar ataxia type2 (SCA2) and a spinocerebellar ataxia type 3 (SCA3) patient, and its clinical relevance. Brain 126:2257–2272. [DOI] [PubMed] [Google Scholar]
- 20. Tarlac V, Turnbull V, Stefani D, Kelly L, Walsh R, Storey E (2007) Inclusion formation by ataxins −1, −2, −3, and −7. Int J Neurosci 117:1289–1314. [DOI] [PubMed] [Google Scholar]
- 21. Velázquez‐Pérez L, Rodríguez‐Labrada R, García‐Rodríguez JC, Almaguer‐Mederos LE, Cruz‐Mariño T, Laffita‐Mesa JM (2011) A comprehensive review of spinocerebellar ataxia type 2 in Cuba. Cerebellum 10:184–198. [DOI] [PubMed] [Google Scholar]
- 22. Ying SH, Choi SI, Lee M, Perlman SL, Baloh RW, Toga AW, Zee DS (2005) Relative atrophy of the flocculus and ocular motor dysfunction in SCA2 and SCA6. Ann N Y Acad Sci 1039:430–435. [DOI] [PubMed] [Google Scholar]


