

Abstract
Intraoperative diagnosis plays an important role in accurate sampling of brain tumors, limiting the number of biopsies required and improving the distinction between brain and tumor. The goal of this study was to evaluate dye‐enhanced multimodal confocal imaging for discriminating gliomas from nonglial brain tumors and from normal brain tissue for diagnostic use. We investigated a total of 37 samples including glioma (13), meningioma (7), metastatic tumors (9) and normal brain removed for nontumoral indications (8). Tissue was stained in 0.05 mg/mL aqueous solution of methylene blue (MB) for 2–5 minutes and multimodal confocal images were acquired using a custom‐built microscope. After imaging, tissue was formalin fixed and paraffin embedded for standard neuropathologic evaluation. Thirteen pathologists provided diagnoses based on the multimodal confocal images. The investigated tumor types exhibited distinctive and complimentary characteristics in both the reflectance and fluorescence responses. Images showed distinct morphological features similar to standard histology. Pathologists were able to distinguish gliomas from normal brain tissue and nonglial brain tumors, and to render diagnoses from the images in a manner comparable to haematoxylin and eosin (H&E) slides. These results confirm the feasibility of multimodal confocal imaging for intravital intraoperative diagnosis.
Keywords: brain tumors, fluorescence, multimodal confocal imaging, reflectance
Introduction
Intraoperative diagnosis represents an important part of neuropathological and neurosurgical practice, providing preliminary diagnosis and guiding the extent of resection during surgery. Oncological neurosurgery and intraoperative diagnosis face unique challenges for both neuropathologists and neurosurgeons. In the case of stereotactic biopsy, for example, prognostic value is intimately related to the choice of the most appropriate biopsy site and the accuracy of targeting that site. Magnetic resonance imaging (MRI)‐guided intraoperative neuronavigation is considered a standard technique for stereotactic biopsy. However, the choice of the most appropriate diagnostic biopsy site may be difficult in heterogeneously‐ or non‐enhancing lesions. Furthermore, the accuracy of targeting may be compromised by brain shift as the result of patient positioning, loss of cerebrospinal fluid and gravity. Last, freezing for preparation of rapid sections induces significant artifact to the brain tissue, which may obscure morphological features. For all these reasons, multiple passes and biopsies are often required to obtain diagnostic material, thus increasing time consumption and the risk of morbidity.
Intraoperative distinction between brain and tumor is also essential in the case of craniotomy for resection. Whereas certain lesions such as extra‐axial tumors can be macroscopically distinguished from the brain with relative ease, other tumors, particularly infiltrative gliomas, are often difficult to distinguish from surrounding normal brain. Overcoming this challenge is particularly important because of the fact that gross total resection is one of the most important prognostic criteria and has been shown to extend survival in both high‐grade and low‐grade gliomas 23. Preservation of neighboring eloquent brain requires careful inspection of the margin to remove pathological tissue while leaving functional brain intact.
To overcome these obstacles, it has been previously shown that use of fluorescent dyes can improve perioperative recognition of the tumor by the neurosurgeon 26, 29. Fluorescence‐guided resection of glioblastoma, for example, increases extent of resection and overall survival. However, thus far these methods have been limited to macroscopic imaging in high‐grade gliomas. We have recently shown that use of a biological Food and Drug Administration (FDA)‐approved dye, methylene blue (MB), can greatly enhance morphological detail and facilitate detection of invasive skin tumors 1, 20.
Our previous work demonstrated the technical feasibility of dye‐enhanced confocal multimodal imaging for highlighting morphological features of normal brain and brain tumors 30. In this study, we investigated the use of the dye‐enhanced multimodal confocal microscopy for the evaluation and diagnosis of primary and metastatic central nervous system (CNS) tumors by pathologists and compared imaging diagnosis with histological evaluation. The purpose of this pilot study was to confirm that ex vivo imaging of human brain tumors using MB provides morphological features with quality similar to haematoxylin and eosin (H&E) sections and provides sufficient information for diagnosis by pathologists. Our findings suggest that adaptation of this method for use in the operating room has the potential to enhance the ability of pathologists to contribute to guiding neurosurgery.
Materials and Methods
Sample acquisition and preparation
Institutional review boards of the Massachusetts General Hospital (MGH) and the University of Massachusetts at Lowell (UML) approved the protocol before initiation of the study. Samples were collected from resections performed by the Neurosurgery Service, MGH, Boston, MA. Samples were delivered fresh to UML on ice within 1–12 h from the resection. Time variation did not interfere with the quality of imaging and there were no significant changes in optical properties of brain tissue as shown before 31. Samples ranged in size from 0.2 × 0.2 × 0.2 to 4 × 4 × 4 cm. At UML, all specimens were stained in 0.05 mg/mL solution of commercially available, pharmaceutical‐grade MB (1% injection, USP, American Regent Laboratories, Shirley, NY, USA), which was diluted in phosphate buffered saline (Mediatech Inc., Manassas, VA, USA). MB was applied to the tissue surface for 2–5 minutes depending on the size of the specimen. Then samples were mounted in the sample holder and imaged.
Imaging
Multimodal confocal images were acquired according to the same technical setup and using the same microscope as described in Wirth et al. 30. In brief, fluorescence and reflectance of MB were excited at 642 nm. Fluorescence emission was registered between 670 and 710 nm. We employed two water immersion objective lenses, including 40×/NA1.15 and 60×/NA1.2 (Olympus, Melville, NJ, USA), which provided a field of view of 370 and 250 μm, respectively. The system yielded lateral resolution better than 0.9 μm and axial resolution of 3–5 μm.
Histology
After imaging, tissues were fixed in 10% formalin (Ricca Chemical Company, Arlington, TX, USA), processed, embedded in paraffin and cut for H&E histopathology. For embedding and cutting, the samples were oriented to allow point‐by‐point correlation between histology and obtained images. Diagnosis was confirmed by a trained neuropathologist (MS) following World Health Organization (WHO) criteria 18.
Testing
Thirteen pathologists, 9 with anatomic pathology (AP) training only and 4 with neuropathology (NP) training from MGH, all without previous exposure to confocal imaging technique, evaluated feasibility of dye‐enhanced multimodal confocal microscopy for diagnosis. A teaching and testing module was created by the pathologist of the study (MS). The teaching module included a brief technical overview and examples of diagnostic features and lesions. The testing module included 10 selected cases, none of them used for the teaching module. The testing module included examples of normal brain, glial and nonglial primary CNS neoplasms, and metastatic brain tumors. Answers were compared with diagnosis obtained from H&E section. The assessment of each case consisted of answering the following questions: Is the tissue normal brain or abnormal; if abnormal, is it a glial or nonglial neoplasm; if glial, is it a low‐grade or a high‐grade glioma; if nonglial, is it meningioma or metastatic carcinoma? This was designed to simulate an intraoperative frozen section evaluation process and test sensitivity and specificity for each decision level.
Statistics
Diagnosis made by pathologists was compared with respect to sensitivity, specificity, negative predictive value and positive predictive value, using histology as a gold standard. To compare the diagnostic performance of AP and NP, we used generalized estimating equation (GEE) model for binomial regression: modeling the probability of true positive diagnosis in a subset of patients with a positive diagnosis by histology and by pathologist, for the testing of, respectively, sensitivity and positive predictive value and modeling the probability of true negative diagnosis in a subset of patients with a negative diagnosis by histology and by pathologist, for the testing of, respectively, specificity and negative predictive value. Dependent data were accounted for by identifying clusters as patients and the two‐sided Wald test was used to test the effect of NP vs. AP.
Results
Patient samples
In total, we imaged 37 samples. Samples included eight temporal lobe specimens resected during hippocampal surgeries for nontumor indication and showed no abnormalities by imaging or histology. Glial samples included four glioblastomas, six WHO Grade III gliomas (including anaplastic astrocytoma, anaplastic oligodendroglioma and anaplastic oligoastrocytoma) and three WHO Grade II gliomas (diffuse astrocytoma, oligodendroglioma and oligoastrocytoma). Nine metastasis samples included renal cell carcinoma, esophageal carcinoma, lung and breast adenocarcinoma, and leiomyosarcoma. Although our sample selection was biased toward large lesions with sufficient tissue for research imaging, and therefore does not include demyelinating disease or other mimickers of glioma, overall it represents a wide range of primary and metastatic lesions and normal brain for comparison. Samples are summarized in Table 1.
Table 1.
Specimen characteristics. Abbreviation: WHO = World Health Organization
| Specimen (n) | Final diagnosis |
|---|---|
| Nontumoral indication 8 | Normal brain 8 |
| Meningioma 7 | Meningioma, WHO Grade I 4 |
| Atypical meningioma, WHO Grade II 3 | |
| Metastasis 9 | Renal cell carcinoma 1 |
| Esophageal adenocarcinoma 3 | |
| Lung adenocarcinoma 2 | |
| Breast adenocarcinoma 1 | |
| Leiomyosarcoma 2 | |
| Glioma 13 | WHO Grade II |
| Diffuse astrocytoma 1 | |
| Oligodendroglioma 1 | |
| Oligoastrocytoma 1 | |
| WHO Grade III | |
| Anaplastic astrocytoma 3 | |
| Anaplastic oligodendroglioma 1 | |
| Anaplastic oligoastrocytoma 1 | |
| WHO Grade IV | |
| Glioblastoma 4 |
Multimodal confocal imaging allows visualization of normal brain morphology
Imaging of normal brain tissue allowed for distinguishing cortex and white matter in all eight (100%) cases by combination of fluorescence and reflectance images (Figure 1). Cortical architecture as well as individual neurons, with recognizable dendrites and axons, could easily be visualized by fluorescence. Reflectance images of the cortex showed delicate granular or lattice‐like background with even uninterrupted structure. Although glial cells of the white matter can be visualized by fluorescence, cellularity is lower and the dielectric properties of myelin largely prevent uptake of MB, therefore axons are not highlighted in the fluorescence images. Bright but dense, cotton‐like appearance of the white matter in reflectance images is the result of high index of refraction of lipid‐rich myelin.
Figure 1.
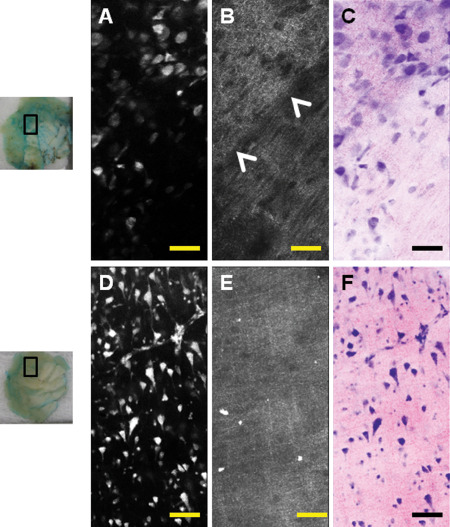
Examples of normal brain visualized by dye‐enhanced multimodal confocal microscopy. Images are taken from pieces of normal brain tissue (left column, insets represent where images were taken). Shapes of neurons as well as cortical architecture can be readily observed by fluorescence (A,D). Corresponding reflectance images (B,E) show a well‐defined margin between gray and white matter (B, arrowheads). Gray matter has a finely granular appearance on reflectance (B, top and E) while white matter is denser (B, bottom). Virtual haematoxylin and eosin (H&E) image can be created from information obtained by fluorescence and reflectance. Images can be pseudocolored to resemble H&E. (C,F) Scale bar represents 100 μm.
In summary, normal brain visualized by dye‐enhanced multimodal confocal microscopy shows all architectural features of normal brain. Cortex shows regularly spaced neurons organized in layers with delicate lacy background of neuronal processes on reflectance. White matter shows lower cellularity on fluorescence with thicker “cotton‐like” appearance as the result of myelin in reflectance.
Imaging of gliomas
Imaging of glial neoplasms showed disruption of the normal brain architecture with atypical cells infiltrating brain tissue (Figure 2). Fluorescence highlights increased cellularity and nuclear atypia, while reflectance images highlighted fibrillarity of astrocytic neoplasms (Figures 2 and 3). In low‐grade gliomas, one can observe only mildly increased cellularity, accompanied by fibrillarity and empty cystic spaces (Figure 2). Confocal imaging allowed assessment of nuclear features and degree of anaplasia. High‐grade features of gliomas include vascular proliferation and necrosis. Abnormal vascular structures including glomeruloid vascular proliferation, vessels co‐opted by tumor cells or vessels with treatment effect can be identified (Figures 2, 3, 4). Necrosis in gliomas is detected by mirror images of reflectance highlighting necrosis and macrophage content and fluorescence showing high number of tumor nuclei in pseudopallisading areas surrounding the necrotic fields (Figure 4). In contrast to normal brain, there is loss of normal architecture, more profound with increasing histological grade. Infiltrative nature of the neoplasm as well as fibrillarity is helpful in distinguishing glial neoplasms from nonglial neoplasms such as meningioma and metastasis. In summary, glial neoplasms show irregular fibrillary background with disruption of the normal brain and infiltration and recognizable necrosis and vascular proliferation.
Figure 2.
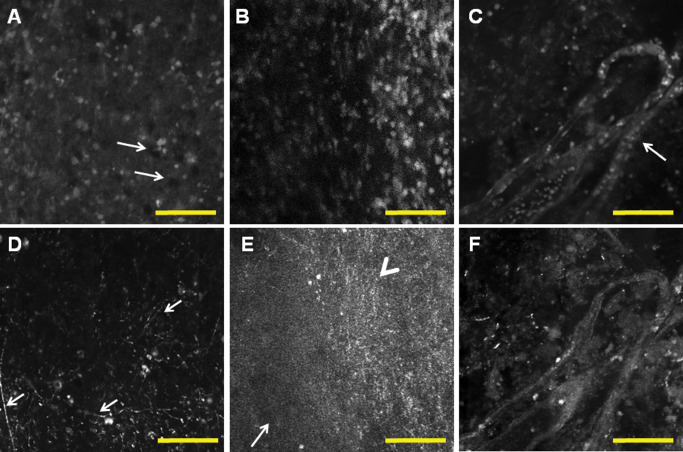
Examples of glial neoplasms. Fluorescence (A,B,C) and corresponding reflectance (D,E,F) images show increased cellularity and disruption of the normal brain architecture and irregular fibrillary pattern. Low‐grade glioma (A,D) shows mild increase in cellularity and small cystic spaces (A, arrows); there is irregular fibrillary background with prominent processes suggesting astrocytic neoplasm (D). In high‐grade gliomas, cellularity is significantly increased (B) with a corresponding change in reflectance imaging, with infiltration from the center of the tumor (E, arrowhead) to the periphery (E, arrow). Microvascular glomeruloid proliferation is a hallmark of glioblastoma and can be observed in fluorescence as well as in reflectance images, surrounded by an irregular mass of tumor nuclei (C,F). Scale bar represents 100 μm.
Figure 3.
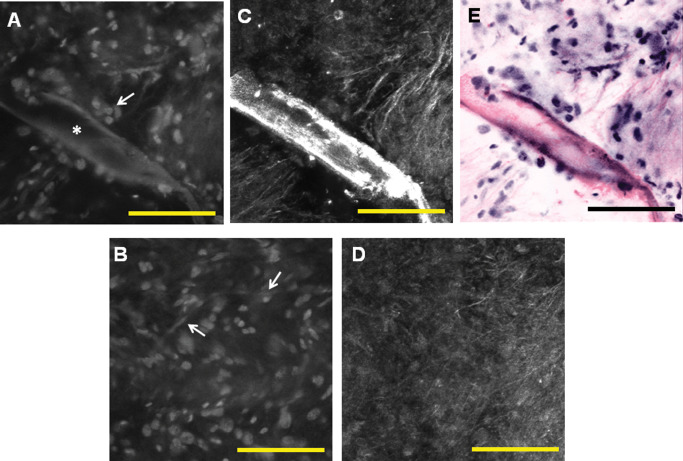
High‐power view enables imaging at the cellular level and evaluation of nuclear morphology. Fluorescence images (A,B) show increased cell density and nuclear atypia. Glioma cells infiltrate (A, arrow) along the large blood vessel (A, star). Delicate chicken‐wire vessels of oligodendroglioma can be visualized as well (B, arrows). Corresponding reflectance images show coarse fibrillarity (C,D). Pseudocoloring can be applied at high power as well to create a virtual haematoxylin and eosin (H&E) image (E). Scale bar represents 100 μm.
Figure 4.
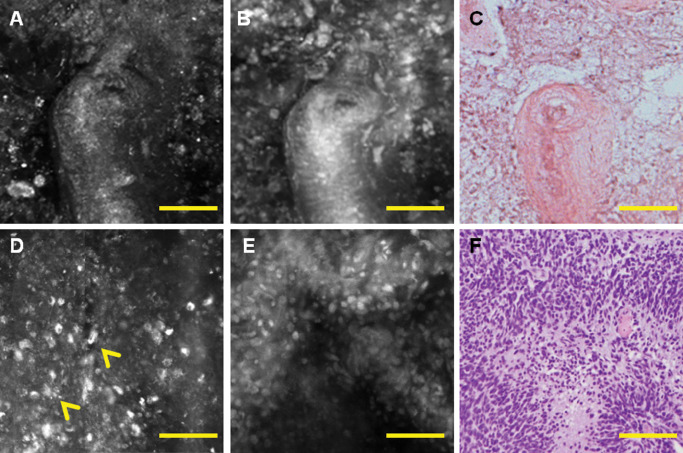
Correlation of histology and multimodal confocal microscopy shows radiation damage with hyalinized blood vessel and necrosis on reflectance (A) and fluorescence images (B) similar to the corresponding haematoxylin and eosin (H&E) (C). Pseudopallisading necrosis, another hallmark feature of glioblastoma (GBM), can be visualized as mirror images of bright necrosis by reflectance (D), dense accumulation of tumor nuclei on fluorescence (E), similar to the corresponding H&E area (F). Scale bar represents 100 μm.
Imaging of nonglial neoplasms
Compared with normal brain and glial neoplasms, nonglial primary and metastatic brain tumors lack underlying delicate or coarse fibrillarity in reflectance. Fluorescence highlights cellular bodies arranged in glands of adenocarcinoma or whorls of meningioma (Figures 5 and 6). Interestingly, in meningiomas, reflectance highlights the external, more fibrillary part of the whorls as well as scattered calcifications (Figure 6).
Figure 5.
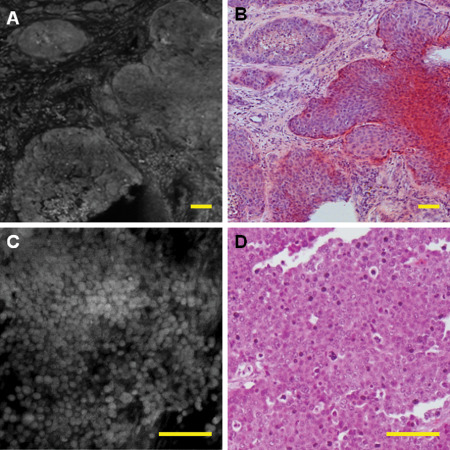
Metastatic tumors are usually highly cellular on fluorescence and can recapitulate the architecture of their primary tumor, such as adenocarcinoma [A, fluorescence; B, corresponding haematoxylin and eosin (H&E)]. However, some metastatic tumors similar to H&E show only poorly differentiated neoplasm, which needs further workup (C,D). This was an example of metastatic poorly differentiated breast carcinoma. Scale bar represents 100 μm.
Figure 6.
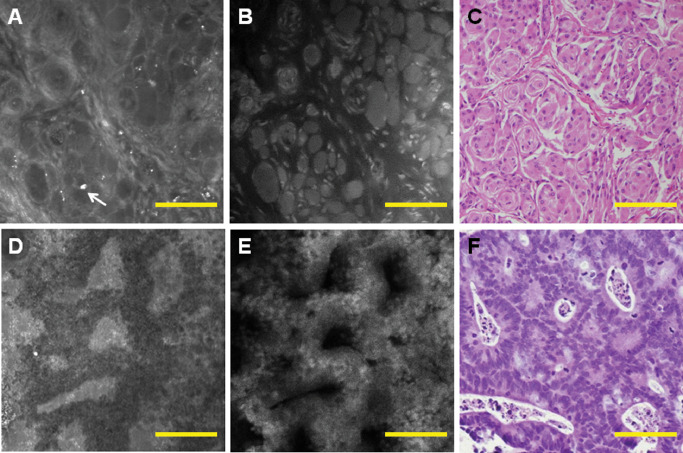
In nonglial brain tumors, fluorescence and reflectance can complement each other. An example of meningioma shows that the outside region of the whorls is highlighted by reflectance (A), while cell bodies are highlighted by fluorescence (B), and both images closely resemble corresponding haematoxylin and eosin (H&E) (C). Dystrophic calcifications, which are commonly found in meningiomas, are highlighted by reflectance (A, arrow). Adenocarcinoma glands can be visualized well by reflectance (D) and fluorescence (E) and reveal a morphology similar to H&E (F). Scale bar represents 100 μm.
Although comparison to H&E shows good correlation with histology, meningiomas and metastasis can show highly variable morphological features (as influenced by grade and tumor type), which might require close correlation with clinical and imaging modalities similar to cases that are challenging on frozen section. Furthermore, undifferentiated metastatic tumors and lymphomas might only show features of high‐grade malignant neoplasm such as high cellularity without recognizable architecture, requiring the pathology to defer an exact diagnosis to paraffin sections and subsequent additional evaluation (Figure 5). In summary, nonglial primary and metastatic tumors show features comparable to H&E preparation.
Assessment of diagnostic accuracy by dye‐enhanced multimodal confocal imaging
To assess the quality of obtained morphological images and the potential of dye‐enhanced multimodal confocal imaging, we tested whether diagnosis could be rendered by general pathologists or pathologists trained in NP. As pathologists are without previous exposure to the confocal imaging, we provided distinct training and test sets of images. Sensitivity and specificity for distinguishing between normal brain vs. abnormal brain were 95% and 100%, respectively, and 83% and 90%, respectively, for distinguishing between glial vs. nonglial neoplasms. Interestingly, for delivering the correct final diagnosis, sensitivity and specificity were only 63% and 46% for all pathologists tested. However, performance of neuropathologists was significantly better with sensitivity of 88% and specificity of 100% (P‐value of 0.0264 and <0.0001 respectively), highlighting the importance of subspecialty training in learning new diagnostic modalities. In summary, both AP‐ and NP‐trained pathologists were able to distinguish normal brain and major groups of brain tumors with high sensitivity and specificity. Neuropathologists performed significantly better with classification of tumors and grading, which was comparable to diagnosis obtained from H&E stained sections (standard of care). Results are summarized in Table 2.
Table 2.
Assessment of diagnostic potential of dye‐enhanced multimodal confocal imaging. Abbreviations: NP = neuropathology; NPV = negative predictive value; PPV = positive predictive value
| Comparisons | Sensitivity (%) | Specificity (%) | PPV (%) | NPV (%) |
|---|---|---|---|---|
| Normal vs. abnormal brain tissue | 95 | 100 | 100 | 98 |
| Glial vs. nonglial tumors | 83 | 90 | 91 | 80 |
| Grade and type of the tumor: all pathologists | 63 | 46 | 76 | 32 |
| NP trained* | 88 | 100 | 100 | 86 |
| *P‐value | 0.0264 | <0.0001 | <0.0001 | 0.0016 |
Multimodal confocal imaging is compared with haematoxylin and eosin (H&E) diagnosis as a standard of care.
NP is significantly better in grading and subclassifying tumors.
Discussion
We performed this study to evaluate the quality of morphological images obtained with dye‐enhanced multimodal confocal imaging for potential use in perioperative diagnostics. We have previously shown that dye‐enhanced imaging is able to visualize morphology of brain and brain lesions 30. Our results show that these images provide sufficient morphological detail to deliver diagnoses comparable to H&E. Combining optical information obtained from fluorescence and reflectance images can be further used for pseudocoloring (Figures 1 and 3). With MB, nucleus staining mimics the staining pattern of hematoxylin; the gray scale of the fluorescence image can be readily converted into purple color of varying intensity. The gradient of purple is created by assigning the brightest fluorescence gray scale pixels, deepest purple color, and the darkest gray scale fluorescence pixels, white color. Similarly, reflectance images mimic the staining pattern of eosin. Therefore, gray scale reflectance images can be converted to pink‐scale images, with the deepest pink color corresponding to brightest gray scale reflectance pixels and white color corresponding to darkest gray scale reflectance pixels. Once the color scales are appropriately applied, the two colored images are fused to produce pseudocolored virtual H&E image. This pseudocoloring would allow neuropathologists to evaluate a virtual H&E, without freezing, cutting and staining the tissue. Intraoperative confocal imaging offers multiple advantages compared with standard H&E performed on frozen sections and can be used for clinical decisions both by neuropathologists as well as neurosurgeons. It allows for immediate live assessment of morphology and rendering of the diagnosis. Evaluation of the resection cavity and brain tumor margins by confocal imaging may greatly improve the rate of gross total resection, particularly of glial neoplasms, which is one of the most important prognostic factors 23. Perioperative confocal imaging can decrease the number of nondiagnostic samples, need for perioperative computed tomography (CT) or MRI imaging, operative time and perioperative morbidity as the result of multiple sampling, as well as operative costs as the result of increased biopsy accuracy. Others have shown that confocal imaging probes are sufficiently advanced for intraoperative use during brain surgery 5, 24. Advances in confocal microscopy can be combined with recent advantages in telepathology 11 and allow remote and immediate access to NP consultation. In the case of tumors located in areas such as the brain stem, where the morbidity risk of biopsy is high, optical imaging methods might potentially serve as a surrogate for actual biopsy. Confocal microscopy alone was shown to be useful for diagnosing a variety of tumors and organs such as skin 1, gastrointestinal tract 14, 21, urinary bladder 16, as well as in the brain 5, 24. The need for better visualization of brain tumors, particularly low‐grade gliomas and gliomas in infiltrating normal white matter, led to the implementation of perioperative imaging agents such as 5‐aminolevulinic acid (ALA). ALA is a well‐tolerated pro‐drug that leads to accumulation of fluorescent protoporphyrin IX inside glioma cells after oral ingestion 12, 25 and enables improved resection of malignant gliomas 26. Current data also suggest that focal accumulation of ALA predicts anaplastic progression in tumors with absent contrast enhancement 29. While ALA is a useful tool for visualizing tumor cells, it relies on accumulation within tumor cells and therefore has relatively lower sensitivity in diffusely infiltrating tumors within normal white matter. Similar to ALA, MB has been successfully applied for enhancing contrast of different cancers including nonmelanoma skin cancers 32, 33, tumors of bladder 8, 9, 13, pancreas 7 and Barrett's esophagus metaplasia 3, 4. It has also been successfully used for tracking melanoma metastases in lymph nodes 17 and identification of breast cancer metastasis 28. There have been reports in the literature indicating preferential accumulation of MB in cancer cells as a result of its affinity to mitochondria, which are abundant in cancerous tissue 19. However, as compared with ALA, MB has an advantage of being a histological stain mimicking the staining pattern of hematoxylin 1. Therefore, pathologists should be able to interpret the fluorescence images of MB stained brain in the same way that they read histology, without extensive retraining. Moreover, absorption and fluorescence peaks of MB do not overlap with major absorption bands of hemoglobin, which lie in the blue and yellow spectral range. Therefore, it can be imaged in both reflectance and fluorescence modes, as has been done in this study, thus providing additional information on brain architecture and spectral response. It should be noted that MB in high doses (5 mg/kg) may precipitate serotonin toxicity particularly when combined with selective serotonin reuptake inhibitors 10. However, the concentration of MB used in our study (0.05 mg/mL) is 200 times lower than standard concentrations (10 mg/mL) that are routinely used in clinical practice for a variety of indications including hypotension 6, ifosfamide‐induced encephalopathy 27, poisoning antidote 2 and parathyroid surgery 22. Animal studies that will further investigate this matter are under way.
In a broader sense, the advances in imaging will likely change the field of pathology 15 similar to recent development of molecular techniques. The future will likely challenge pathology with new imaging modalities combined with targeted molecular probes. Our study indicates that pathologists with extensive morphological training are prepared to take advantage of novel imaging modalities and integrate them into clinical practice. While all pathologists were able to distinguish between abnormal and normal brain and glial and nonglial neoplasms, NP training was significantly more beneficial for delivering correct diagnosis about tumor grade and subtype.
In summary, we show that dye‐enhanced multimodal confocal imaging provides high‐resolution assessment of brain morphology. It allows distinguishing between different types of primary and metastatic brain tumors with morphological features comparable to H&E. This method can potentially provide accurate and rapid intraoperative diagnosis of brain tumors with significant impact on the surgery and patients' life quality.
Author Contributions
MS, DW, SS, WC, MPF and ANY designed the study; MS, DW, SS, CSK, SKB, MA and ANY performed the experiments and analyzed the data. All authors were involved in writing the paper and had final approval of the submitted and published versions.
Conflict of Interest
Authors have no conflicts of interest to disclose.
Acknowledgments
The authors would like to thank the following MGH pathologists for their willingness to evaluate the method for its diagnostic use: S. Chiang, M. Lawlor, C.J. Davidson, T. Stein, A.H. Lain, A.G. McDonald, D. Mordes, D. Gimbel, H. Xiao, M. Lew, V. Nardi, V. Klepeis and D.F. Boyer.
Irina Tabatadze's help with processing histopathology slides is gratefully acknowledged.
Grant support: MGH Cancer Center grant and UMASS Lowell seed grant.
References
- 1. Al‐Arashi MY, Salomatina E, Yaroslavsky AN (2007) Multimodal confocal microscopy for diagnosing nonmelanoma skin cancers. Lasers Surg Med 39:696–705. [DOI] [PubMed] [Google Scholar]
- 2. Betten DP, Vohra RB, Cook MD, Matteucci MJ, Clark RF (2006) Antidote use in the critically ill poisoned patient. J Intensive Care Med 21:255–277. [DOI] [PubMed] [Google Scholar]
- 3. Canto MI, Setrakian S, Petras RE, Blades E, Chak A, Sivak MV Jr (1996) Methylene blue selectively stains intestinal metaplasia in Barrett's esophagus. Gastrointest Endosc 44:1–7. [DOI] [PubMed] [Google Scholar]
- 4. Eisen GM, Montgomery EA, Azumi N, Hartmann DP, Bhargava P, Lippman M, Benjamin SB (1999) Qualitative mapping of Barrett's metaplasia: a prerequisite for intervention trials. Gastrointest Endosc 50:814–818. [DOI] [PubMed] [Google Scholar]
- 5. Eschbacher J, Martirosyan NL, Nakaji P, Sanai N, Preul MC, Smith KA et al (2012) In vivo intraoperative confocal microscopy for real‐time histopathological imaging of brain tumors. J Neurosurg 116:854–860. [DOI] [PubMed] [Google Scholar]
- 6. Evora PR, Simon MR (2007) Role of nitric oxide production in anaphylaxis and its relevance for the treatment of anaphylactic hypotension with methylene blue. Ann Allergy Asthma Immunol 99:306–313. [DOI] [PubMed] [Google Scholar]
- 7. Fedorak IJ, Ko TC, Gordon D, Flisak M, Prinz RA (1993) Localization of islet cell tumors of the pancreas: a review of current techniques. Surgery 113:242–249. [PubMed] [Google Scholar]
- 8. Fukui I, Yokokawa M, Mitani G, Ohwada F, Wakui M, Washizuka M et al (1983) In vivo staining test with methylene blue for bladder cancer. J Urol 130:252–255. [DOI] [PubMed] [Google Scholar]
- 9. Gill WB, Huffman JL, Lyon ES, Bagley DH, Schoenberg HW, Straus FH 2nd (1984) Selective surface staining of bladder tumors by intravesical methylene blue with enhanced endoscopic identification. Cancer 53:2724–2727. [DOI] [PubMed] [Google Scholar]
- 10. Gillman PK (2006) Methylene blue implicated in potentially fatal serotonin toxicity. Anaesthesia 61:1013–1014. [DOI] [PubMed] [Google Scholar]
- 11. Horbinski C, Hamilton RL (2009) Application of telepathology for neuropathologic intraoperative consultations. Brain Pathol 19:317–322. [DOI] [PMC free article] [PubMed] [Google Scholar]
- 12. Ishihara R, Katayama Y, Watanabe T, Yoshino A, Fukushima T, Sakatani K (2007) Quantitative spectroscopic analysis of 5‐aminolevulinic acid‐induced protoporphyrin IX fluorescence intensity in diffusely infiltrating astrocytomas. Neurol Med Chir (Tokyo) 47:53–57; discussion 7. [DOI] [PubMed] [Google Scholar]
- 13. Kaisary AV (1986) Assessment of radiotherapy in invasive bladder carcinoma using in vivo methylene blue staining technique. Urology 28:100–102. [DOI] [PubMed] [Google Scholar]
- 14. Kiesslich R, Goetz M, Vieth M, Galle PR, Neurath MF (2005) Confocal laser endomicroscopy. Gastrointest Endosc Clin N Am 15:715–731. [DOI] [PubMed] [Google Scholar]
- 15. Koenig F, Knittel J, Stepp H (2001) Diagnosing cancer in vivo. Science (New York, NY) 292:1401–1403. [DOI] [PubMed] [Google Scholar]
- 16. Koenig F, Knittel J, Schnieder L, George M, Lein M, Schnorr D (2003) Confocal laser scanning microscopy of urinary bladder after intravesical instillation of a fluorescent dye. Urology 62:158–161. [DOI] [PubMed] [Google Scholar]
- 17. Link EM, Carpenter RN (1992) 211At‐methylene blue for targeted radiotherapy of human melanoma xenografts: treatment of cutaneous tumors and lymph node metastases. Cancer Res 52:4385–4390. [PubMed] [Google Scholar]
- 18. Louis DN (2006) Molecular pathology of malignant gliomas. Annu Rev Pathol 1:97–117. [DOI] [PubMed] [Google Scholar]
- 19. Oseroff AR, Ohuoha D, Ara G, McAuliffe D, Foley J, Cincotta L (1986) Intramitochondrial dyes allow selective in vitro photolysis of carcinoma cells. Proc Natl Acad Sci U S A 83:9729–9733. [DOI] [PMC free article] [PubMed] [Google Scholar]
- 20. Park J, Mroz P, Hamblin MR, Yaroslavsky AN (2010) Dye‐enhanced multimodal confocal microscopy for noninvasive detection of skin cancers in mouse models. J Biomed Opt 15:0260231–0260235. [DOI] [PMC free article] [PubMed] [Google Scholar]
- 21. Polglase AL, McLaren WJ, Skinner SA, Kiesslich R, Neurath MF, Delaney PM (2005) A fluorescence confocal endomicroscope for in vivo microscopy of the upper‐ and the lower‐GI tract. Gastrointest Endosc 62:686–695. [DOI] [PubMed] [Google Scholar]
- 22. Pollack G, Pollack A, Delfiner J, Fernandez J (2009) Parathyroid surgery and methylene blue: a review with guidelines for safe intraoperative use. Laryngoscope 119:1941–1946. [DOI] [PubMed] [Google Scholar]
- 23. Sanai N, Berger MS (2008) Glioma extent of resection and its impact on patient outcome. Neurosurgery 62:753–764; discussion 264–266. [DOI] [PubMed] [Google Scholar]
- 24. Sanai N, Eschbacher J, Hattendorf G, Coons SW, Preul MC, Smith KA et al (2011) Intraoperative confocal microscopy for brain tumors: a feasibility analysis in humans. Neurosurgery 68:282–290. [DOI] [PubMed] [Google Scholar]
- 25. Stepp H, Beck T, Pongratz T, Meinel T, Kreth FW, Tonn J, Stummer W (2007) ALA and malignant glioma: fluorescence‐guided resection and photodynamic treatment. J Environ Pathol Toxicol Oncol 26:157–164. [DOI] [PubMed] [Google Scholar]
- 26. Stummer W, Pichlmeier U, Meinel T, Wiestler OD, Zanella F, Reulen HJ (2006) Fluorescence‐guided surgery with 5‐aminolevulinic acid for resection of malignant glioma: a randomised controlled multicentre phase III trial. Lancet Oncol 7:392–401. [DOI] [PubMed] [Google Scholar]
- 27. Turner AR, Duong CD, Good DJ (2003) Methylene blue for the treatment and prophylaxis of ifosfamide‐induced encephalopathy. Clin Oncol (R Coll Radiol) 15:435–439. [DOI] [PubMed] [Google Scholar]
- 28. Varghese P, Abdel‐Rahman AT, Akberali S, Mostafa A, Gattuso JM, Carpenter R (2008) Methylene blue dye—a safe and effective alternative for sentinel lymph node localization. Breast J 14:61–67. [DOI] [PubMed] [Google Scholar]
- 29. Widhalm G, Wolfsberger S, Minchev G, Woehrer A, Krssak M, Czech T et al (2010) 5‐Aminolevulinic acid is a promising marker for detection of anaplastic foci in diffusely infiltrating gliomas with nonsignificant contrast enhancement. Cancer 116:1545–1552. [DOI] [PubMed] [Google Scholar]
- 30. Wirth D, Snuderl M, Sheth S, Kwon CS, Frosch MP, Curry W, Yaroslavsky AN (2012) Identifying brain neoplasms using dye‐enhanced multimodal confocal imaging. J Biomed Opt 17:0260121–0260127. [DOI] [PubMed] [Google Scholar]
- 31. Yaroslavsky AN, Schulze PC, Yaroslavsky IV, Schober R, Ulrich F, Schwarzmaier HJ (2002) Optical properties of selected native and coagulated human brain tissues in vitro in the visible and near infrared spectral range. Phys Med Biol 47:2059–2073. [DOI] [PubMed] [Google Scholar]
- 32. Yaroslavsky AN, Neel V, Anderson RR (2003) Demarcation of nonmelanoma skin cancer margins in thick excisions using multispectral polarized light imaging. J Invest Dermatol 121:259–266. [DOI] [PubMed] [Google Scholar]
- 33. Yaroslavsky AN, Neel V, Anderson RR (2004) Fluorescence polarization imaging for delineating nonmelanoma skin cancers. Opt Lett 29:2010–2012. [DOI] [PubMed] [Google Scholar]