

Abstract
Perinatal brain injury including white matter damage (WMD) is highly related to sensory, motor or cognitive impairments in humans born prematurely. Our aim was to examine the neuroanatomical, functional and behavioral changes in adult rats that experienced prenatal ischemia (PI), thereby inducing WMD. PI was induced by unilateral uterine artery ligation at E17 in pregnant rats. We assessed performances in gait, cognitive abilities and topographical organization of maps, and neuronal and glial density in primary motor and somatosensory cortices, the hippocampus and prefrontal cortex, as well as axonal degeneration and astrogliosis in white matter tracts. We found WMD in corpus callosum and brainstem, and associated with the hippocampus and somatosensory cortex, but not the motor cortex after PI. PI rats exhibited mild locomotor impairments associated with minor signs of spasticity. Motor map organization and neuronal density were normal in PI rats, contrasting with major somatosensory map disorganization, reduced neuronal density, and a marked reduction of inhibitory interneurons. PI rats exhibited spontaneous hyperactivity in open‐field test and short‐term memory deficits associated with abnormal neuronal density in related brain areas. Thus, this model reproduces in adult PI rats the main deficits observed in infants with a perinatal history of hypoxia‐ischemia and WMD.
Keywords: cerebral palsy, hippocampus, hypoxia–ischemia, locomotion, motor cortex, open‐field, periventricular leukomalacia, prefrontal cortex, prematurity, somatosensory cortex, spasticity
INTRODUCTION
Brain damage resulting from perinatal cerebral hypoxia–ischemia (HI) is a major cause of mortality and chronic disability, including motor, behavioral and cognitive disturbances in children (61). Incidence of HI is about 2‰–4‰ in full‐term infants, while it approaches 60% in premature and very low‐birth‐weight infants (60). Periventricular white matter damage (WMD) appears to be one of the most common forms of brain injury induced by perinatal HI and is a leading cause of cerebral palsy (CP) in survivors of premature birth (37). Because of considerable progress in the perinatal management of high‐risk preterm neonates, major focal destructive lesions are now less common, and the two predominant neuropathological lesions are diffuse WMD (characterized by glial injury with microglial activation, diffuse reactive astrogliosis and ultimately hypomyelination) and gray matter injury, along with axonal degeneration 34, 61. Diffuse WMD observed in the most immature preterm infants is often associated with several behavioral and cognitive impairments 11, 22, 37 and subtle sensorimomotor disabilities including deficits in tactile discrimination and proprioception 7, 64, 65, 66, but with no major motor deficits 29, 32.
Reliable animal models that reproduce the diversity of symptoms resulting from brain damage in very preterm babies are needed to delineate the underlying cellular mechanisms and to investigate potential neuroprotective agents. Myers was the first to develop an animal model combining umbilical cord clamping with obstruction of respiration in term monkey fetuses to produce injury in the thalamus, brain stem and cerebral cortex (42). Rodents, rabbits, piglets and sheep have largely replaced primates in more recent works on perinatal HI. The Rice–Vannucci model has been widely used in postnatal rat pups to study the pathogenesis of HI injury in the developing brain (60). HI at postnatal day 7 (P7) in rats mainly induces neuronal and glial necrosis, as well as astrogliosis, generally observed in the cerebral cortex, subcortical and periventricular white matter, basal ganglia and hippocampus (60). In addition to brain damage, these animals often exhibit various deficits in sensorimotor, behavioral and cognitive functions that vary considerably according to HI parameters. At P7, the rat's brain is histologically comparable to that of a 32‐ to 34‐week‐gestation human fetus. Thus, to mimic brain damage observed in the most immature human preterm infants, that is, 23–32 gestational weeks (34), Back and Rivkees identified an earlier period around P2 in rats, in which the cerebral white matter contains vulnerable pre‐oligodendrocytes (3). These authors confirmed that WMD was maximal at P2 in rats, and then declined between P7 and P14 with the onset of oligodendrocyte maturation and myelination (3). From oligodendrocyte progenitor appearance around embryonic day 22 (E22) in rabbits (16), Tan and colleagues developed an elegant rabbit model of human CP, based on uterine ischemia at E21‐22 (12). Rabbit pups subjected to prenatal ischemia (PI) displayed drastic WMD that correlated with muscle hypertonia and motor deficits observed during swimming 12, 13, 17.
Similarly, we have recently explored a model of PI in rats, based on intrauterine artery ligation at embryonic day 17 (E17) (63), leading to growth restriction at birth and to WMD, and increased microglia at birth in the internal capsule and cingulum, and then to hypomyelination that lasted into adulthood (45). As we previously showed that these abnormalities replicated the main features of WMD (hypomyelination) in preterm infants, we hypothesized that white and gray matter changes related to PI would extend into adulthood and thus would affect several functions, as observed in adult patients who previously experienced prematurity or perinatal HI. We investigated here for the first time the presence of multiple deficits, such as further evidence of WMD (ie, degenerating axons and astrogliosis) in the cortex and brain stem, the presence of apoptotic neurons or decreased neuronal density in the cortex and hippocampus, and neuroanatomical disturbances in various brain areas. This study is an attempt to relate cellular and neuroanatomical changes induced by a PI that extend in adulthood with functional and behavioral deficits in adult rats, such as posture and locomotion on treadmill, organizational features of maps in both primary somatosensory and motor cortices, and behavioral and cognitive impairments. Replication of the main neuroanatomical and neurobehavioral human deficits in an animal model of WMD induced by PI may offer new opportunities to further explore neuroprotective strategies to prevent or limit immature brain damage.
MATERIALS AND METHODS
Experimental design
All experiments and animal use were carried out in accordance with the guidelines issued by the National Institutes of Health (NIH) (NIH Publication #80‐23) and with the European Community (EC) Council Directive (2007/526/EEC). Pregnant Sprague‐Dawley rats (Charles River, L'Arbesle, France) underwent unilateral ligation of the uterine artery, which supplies one uterine horn on E17, under deep anesthesia (350‐mg/kg chloral hydrate i.p.). Uterine artery ligation was made at E17 before the fetuses located at the cervical level, reducing placental blood flow and thereby inducing PI in the pups located downstream the ligation, and possibly hypoxia followed by a reperfusion phase at delivery (63), and a growth restriction detectable at birth. We used the gradient of growth restriction to differentiate pups after delivery as follows. Pups whose birth weight was below 5.50 g [4.81 ± 0.08 g, mean ± standard error of the mean (SEM); Supporting Information Table S1] were classified in the PI group [see Olivier et al (45) for more details]. From the same litter, rats with birth weight ranging from 5.50 and 5.87 g were attributed to moderate growth restriction (46), while pups weighting more than 5.87 g 45, 46 putatively came from the contralateral uterine horn. Then, all rats with birth weight over 5.50 g were not used in the present study. Offspring of sham‐operated rats (ie, laparotomy with uterine artery ligation simulation) had a mean birth weight of 6.99 ± 0.13 g (mean ± SEM; Supporting Information Table S1). No difference in body temperature was found at rest between dams from the PI and sham groups. More than 90% of the dams subjected to surgical procedure (either ligation or sham operation) survived. Dams subjected to uterine ligation had 30%–40% smaller litter size than did the sham‐operated dams. In PI rat pups at P0, no cystic lesions were detected in the cortical plate. In contrast, the cingulum showed transient diffuse lesions with a moth‐eaten appearance in PI animals at P0 compared to shams. However, such distinct cortical damage was no longer detectable by P7 in PI animals (45). A previous study from our lab showed that by adulthood, hypomyelination of the white matter was present in adult brains of PI rats, but that there was an absence of cystic lesions (45).
We used 44 PI and 42 sham rats of either sex. The same rats were used for all behavioral and cognitive tests (PI, n = 20; sham, n = 18), which started on P40 and were conducted at 1‐week intervals. The rats that performed gait tests (PI, n = 8; sham, n = 9) at P65 were also used for hind limb muscle anatomy studies from P70 to P90. In addition, cortical maps were derived in other animals (PI, n = 16; sham, n = 15). In each group, six to eight rats were used for stereological brain histology and immunohistochemistry.
After weaning on P30, rats of the same sex were housed by three in standard plastic cages (26.5 × 42.5 × 18.0 cm) with sawdust on the floor. The cages were kept in a temperature‐ and moisture‐controlled room with 12‐h light–dark cycles (7:00 am to 7:00 pm) with food and water ad libitum. Gait assessment and behavioral tests were performed at the beginning of the light phase.
Gait and posture on treadmill
Premature children or patients with a perinatal history of HI develop later motor disabilities ranging from minor to major 1, 29, 37, 57. To investigate motor deficits, the performances in gait and posture were assessed while adult PI rats walked on treadmill.
All rats were habituated to stay on the treadmill belt within the treadmill apparatus (Figure 3A; Columbus Instruments, Simplex II, Columbus, OH, USA). The following day, each rat walked on the belt at a low treadmill speed (0.10 m/s). Preliminary observations and trials with adult rats in the treadmill apparatus revealed that very slow, hesitant movements and exploratory behaviors were generated at speeds lower than 0.14 m/s, while rapid twitching and startle responses were observed with speeds higher than 0.35 m/s. Fluent, high‐frequency stepping, optimal walking cadence without apparent fatigue, gallop or refusal to walk was observed using a treadmill speed of 0.23 m/s, regardless of the group.
Figure 3.
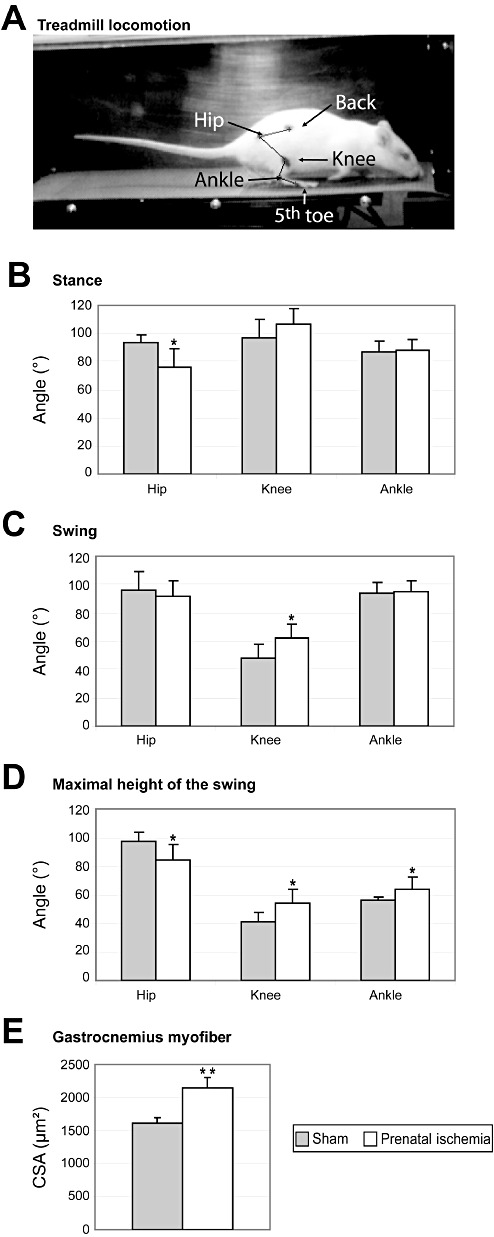
Effects of prenatal ischemia (PI) on posture, locomotor performance, and hind limb muscle area. A. Location of the dots on the skin used to acquire the 3‐D kinematics of the right hind limb joints during locomotion on a treadmill at a speed of 0.26 m/s in a sham rat on P65 at the beginning of the stance phase. B. At the beginning of stance, only the hip angle was smaller in PI rats than in sham rats, indicating overflexion of the hip. C. At the beginning of the swing phase, only the knee angle was larger in PI than in sham rats, indicating knee hyperextension. D. The angles of all joints were significantly different between PI and sham rats indicating both hip overflexion and knee and ankle overextension when the foot was at the highest point of the swing. E. Cross‐sectional areas of the gastrocnemius myofiber were larger in PI rats than in sham rats, indicating hypertrophy. The data are mean ± standard deviation. CSA = cross‐sectional area. *P < 0.05; **P < 0.002.
On P65, hind limb motion was acquired in 3‐D during treadmill locomotion at a treadmill speed of 0.23 m/s. In our conditions, only a very few rats needed to be encouraged by gentle electrical shocks to run on the treadmill (an electrical grid was located at the back part of the treadmill apparatus). Black, waterproof, permanent markers were used to place dots on the shaved skin of the back (iliac crest), hip (greater trochanter), knee, ankle (lateral malleolus), and fifth toe (metatarsophalangeal joint; Figure 3A). Treadmill sequences were kept of short duration to avoid fatigue (30 s to 1.5 minutes), and video acquisitions lasted 10–15 s. The 3‐D kinematic data of the right hind limb dots were collected using two high‐resolution CCD cameras at a sampling rate of 250 Hz (SimiMotion, Unterschleissheim, Germany).
Offline videotracking (SimiMotion) allowed us to reconstruct the 3‐D displacements of the leg. We identified the beginning of the stance (Figure 3A) and swing phases during the stride and the maximal height of the swing. At the beginning of the stance phase, the foot just started to contact the belt at the end of the swing phase, whereas at the beginning of the swing phase, the heel was raised and the foot was nearly off the ground (foot off the ground on the next frame). The gait phases and 3‐D kinematics were determined on the basis of the fifth toe positions in x‐ and z‐axes to compute several parameters including length, amplitude, duration, speed and angles in each phase, using MATLAB (Mathworks, Natick, MA, USA). Measures of step length and speeds were normalized according to the tibial bone length in each rat.
Electrophysiological procedures used for mapping
In addition to motor deficits, patients with CP also exhibit associated somatosensory impairments, such as disabilities in tactile discrimination (64), and kinesthesia and joint‐position sense (65). Tactile discrimination abilities have been shown to correlate with the organizational features of the somatosensory cortical representation in humans (66) and in rats (69). In the same line, the functional organization of the cortical representation of movements is a signature of the voluntary motor output 10, 15. To evaluate motor and somatosensory deficits in rats with WMD, we determined the topographical organization and neuronal properties in the primary motor (M1) and somatosensory (S1) cortices using either microelectrode electrical stimulation or recordings, respectively.
The hind limb maps in M1 and S1 areas were derived in the left hemisphere, corresponding to the right contralateral hind limb. The investigators were unaware of the experimental conditions of the animal throughout the electrophysiological session. The interobserver reproducibility of receptive field (RF) delineation, movement assignment and map elaboration was checked frequently.
Standard intracortical microstimulation techniques were used to derive detailed maps of M1 movement representation (58). Animals were anesthetized with ketamine hydrochloride (70 mg/kg i.p.) and xylazine (5 mg/kg i.p.). Supplementary doses of ketamine (20 mg/kg i.p.) and acepromazine (0.02 mg/kg i.p.) were delivered as needed to maintain a deep and constant level of anesthesia. After craniotomy in the M1 hind limb area, an enlarged image of the exposed brain surface was used to guide and to record the location of electrode penetrations. Microelectrodes (100 KΩ, FHC, Bowdoin, ME, USA) were advanced into layer V at a depth of about 1700 µm. Electrodes were spaced 100–200 µm apart at the cortical surface according to vasculature. Microstimulations consisted of 40‐ms trains of 200‐µs biphasic cathodal pulses delivered at 333 Hz by an electrically isolated constant‐current stimulator (A‐M Systems, Sequim, WA, USA). Pulse trains were delivered at about 1 Hz (58). At each electrode, stimulation was initiated at the lowest intensity (5 µA) and was increased gradually until lower limb movement was evoked. Movements of the toes, ankle, knee, hip and other joints were detected visually. If no movement was elicited at 60 µA, the site was defined as unresponsive. We used Deneba Canvas software (Victoria, BC, Canada) to reconstruct maps of the forelimb representation by drawing boundaries encompassing cortical sites whose stimulation elicited movements of the same joint (hip, knee, ankle, toe and multi‐joint complex movements; Figure 4A).
Figure 4.
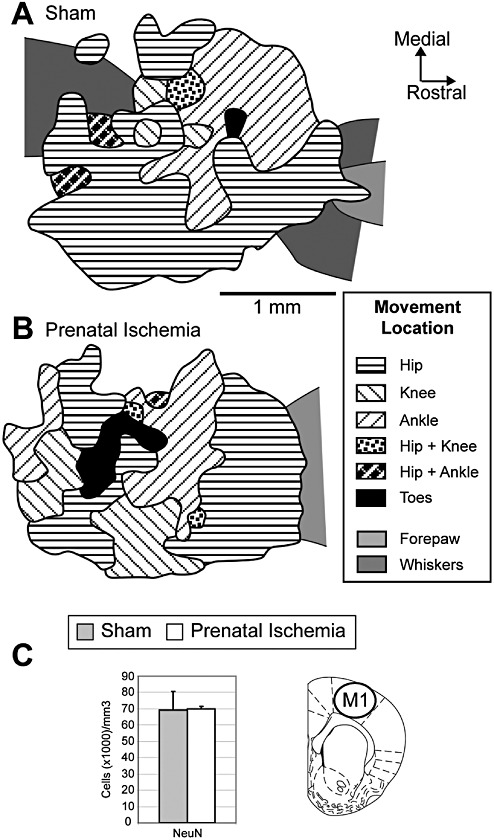
Lack of effects of prenatal ischemia (PI) on the anatomical and functional organization of the primary motor cortex (M1). A. Typical map representing the movements of hind limb joints in the M1 cortex established in a sham rat using intracortical microstimulation techniques. Note the absence of a precise topography of hind limb movement representation. B. Representative map of hind limb movements in a PI rat. The topographical organization and map features did not differ significantly between the two groups. C. Stereological densities of total neurons in M1. NeuN+ immunoreactive cell density did not differ significantly between the two groups. The location of cell counts in M1 is indicated on the coronal sections (49). Mean ± standard error.
The somatosensory mapping procedure has been described elsewhere 9, 10. Briefly, each animal was anesthetized with sodium pentobarbital (50 mg/kg, i.p.), of which supplemental doses (5 mg/kg, i.p.) were injected as needed to maintain a deep level of anesthesia. Rats were kept in stable physiological conditions throughout the mapping session. A craniotomy was made over the S1 cortex corresponding to the hind limb representation. An enlarged image of the exposed brain surface was used to guide and to record the location of electrode penetrations. Multiunit recordings were made using tungsten microelectrodes (1 Mohm at 1 KHz, WPI, Sarasota, FL, USA) in the upper layer IV (650–700 µm) of the S1 cortex. Electrodes were spaced 50–100 µm apart according to surface blood vessels. The multiunit signal was preamplified, filtered (bandpass, 0.5–5 KHz), displayed on an oscilloscope and delivered to an audio monitor. The RF corresponded to the cutaneous area whose barely visible indentation elicited clear bursts of S1 neuronal activity. Low‐threshold cutaneous RFs were detected based on small skin indentations or gentle hair movements. High‐threshold responses elicited by taps on the skin, stroking of hairs, and manipulations of muscles and joints were classified as non‐cutaneous responses. Unresponsive cortical sites exhibited spontaneous discharges only. The ridges of glabrous skin of the toes and plantar surfaces were used as reliable landmarks to delineate RFs. The RF areas were transferred to the forepaw digital image then were measured offline using MAP software. Deneba Canvas software was used to elaborate maps of the forelimb representation by drawing boundaries encompassing cortical sites whose RFs were restricted to a common forepaw subdivision (eg, toe, plantar pad). When RFs were located on distinct and separate skin subdivisions, borders were drawn midway between adjacent recording sites. When a single RF included different but adjoining skin subdivisions of the hind limb, a boundary line was drawn that crossed the cortical sites. Map borders were placed midway between responsive and unresponsive sites (see Figure 5A,B).
Figure 5.
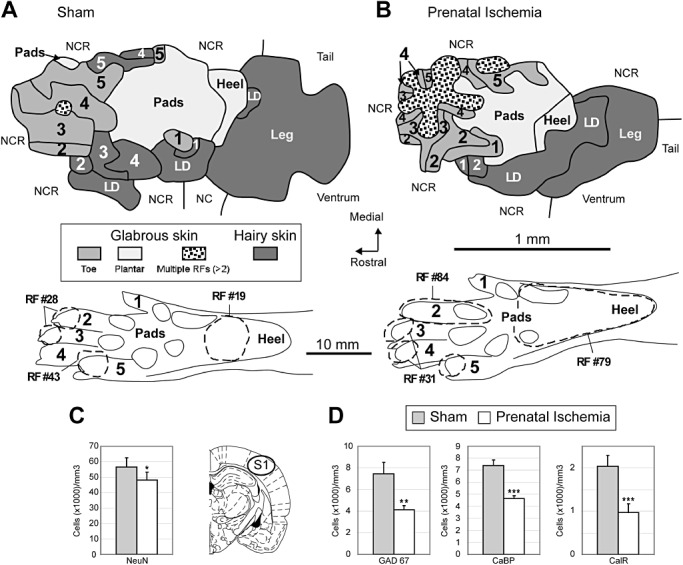
Impact of prenatal ischemia (PI) on the anatomical and functional organization of the primary somatosensory cortex (S1). A. Representative map and glabrous receptive fields (RFs) showing single and multiple RFs encompassing mainly one (RF #19 and #43) or two subdivisions (RF #28) of the glabrous hind paw in a sham rat. Cutaneous hind paw maps were obtained using single‐electrode multiunit recordings in the S1 upper layer IV. B. Typical map and RFs in a PI rat. Note the enlarged glabrous RFs encompassing several hind paw subdivisions (RF #79) and the emergence of multiple RFs located on at least three hind paw subdivisions (RF #31), which disrupted the continuity of the S1 representation of contiguous skin surfaces of toes and produced a patchy map. C. Plots of total neuron numerical density in the S1 cortex. PI rats had lower neuron density than sham rats. The location of cell counts in S1 is indicated on the coronal sections (49). D. Stereological densities of GABAergic interneurons immunodetected using GAD67, calbindin and calretinin in the S1 cortex. PI induced marked reductions in the densities of GAD67+, CaBP+ and CalR+ immunoreactive cells compared to sham rats. For immunocytochemical analyses, all data are reported as mean ± standard error. LD = large dorsum; NCR = non‐cutaneous responses; NR = unresponsive cortical site. *P < 0.05; **P < 0.01; ***P < 0.001.
For the cortical map data, Deneba Canvas software was used to calculate the areal extent of each region of the S1 and M1 cortical maps. Cortical zones were described by their absolute areas (square millimeter) for each rat. Average values were computed for each group of rats. The absolute sizes of glabrous and hairy RFs, measured in square millimeter, were normalized for the ventral and dorsal forepaw skin surfaces, respectively, and were expressed as percentages. The relative RF areas measured in each rat were averaged, and the mean RF sizes in each group were computed. The mean RF size per rat was computed after discarding the large RFs located on the dorsal surface of the forepaw 9, 10, 58.
Behavioral tests
Studies on children with perinatal HI history who subsequently exhibited neurological disorders showed learning disabilities, inattention, hyperactivity, impairments in visual‐spatial object recognition and “object working memory,” and impairments in executive function and other cognitive functions 1, 5, 11, 22, 61, 68. To look for hyperactivity in our PI rats, we used spontaneous exploration in open field. To investigate the different components of recollection and familiarity (ie, encoding of new information into memory and retrieval of previously encoded information), we performed object‐recognition memory tasks based on the spontaneous tendency of rodents to explore new stimuli. Recognition memory tasks differentially used sensory information about object identity (ie, “what” features) and object location (ie, “where” features). These tasks separately involved the parahippocampal areas including the entorhinal and perirhinal cortices, hippocampus and the prefrontal cortex, which underlie the “what” and “where” pathways 19, 56.
Open‐field activity
The apparatus consisted of a circular open field of gray Plexiglas (1000 mm diameter × 400 mm high) with the floor marked off into 190 × 190 mm squares and minimal lighting of the room. At the beginning of the session, the rat was placed in the center of the field. Then, the numbers of square visited, rearings and groomings were counted for 10 minutes 24, 47.
Object‐recognition task
The apparatus consisted of an open box (1000 × 1000 × 300 mm high) made of wood. A video camera above the field was connected to a video recorder and to a monitor. To minimize stress, the room was lit as dimly as possible while allowing us to clearly discern the rats and objects. During cognition tasks, exploration of an object was defined as sniffing the object or as contacting the object with the nose, forepaws or whiskers. Each rat was given two habituation sessions in the empty arena. Then, during a familiarization session, each rat was allowed 5 minutes to explore the two objects located in the central part of the arena. The rat was then returned to its cage for a 1‐minute retention interval, during which the experimenter removed both objects and replaced one by an identical copy of it, called the “familiar” object and the other by a “new” object. Then, the rat was brought back into the apparatus for a 3‐minute testing session (47).
Object‐location task
The apparatus was the same as in the object‐recognition test. Rats were exposed to three objects for three familiarization sessions lasting 3 minutes each with an intersession interval of 1 minute. The three objects were placed along a diagonal line in the central part of the arena. During the 1‐minute retention interval, the objects were removed and replaced by identical copies, one of which was placed at the previously used location in the arena and the other two at different locations, so that the initial diagonal arrangement was converted to a triangular arrangement (47).
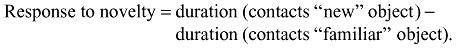
For every familiarization or testing session, the time spent to explore each object was recorded for each rat (47). For the object‐recognition task,
 |
For the object‐location task,
 |
To prevent spatial bias, the locations of the objects in the field differed from rat to rat, and the floor and walls of the arenas were cleaned with diluted alcohol after each session. The objects to be discriminated were made of glass, plastic or metal, and had no natural significance for the rats and had never been associated with a reinforcer.
Tissue collection, immunochemistry and stereology
Associated with various neurological disabilities in patients with CP or survivors of premature birth are diffuse lesions of the white and gray matter 34, 37, 61. In a rat model of WMD, previous studies showed that PI induced microglial activation, astrogliosis and hypomyelination in various brain areas during maturation and early adulthood 45, 53. To assess the extent of WMD into adulthood, we performed immunostaining for beta‐amyloid precursor protein (APP; a marker of axonal damage), myelin basic protein (MBP; a myelination marker) in several cortical areas related to sensorimotor and cognitive functions, and cortical and brainstem tracts of adult rats that experienced PI, and stained with Fluoro‐Jade® (a marker of neuronal cell and axonal degeneration; Millipore, Billerica, MA, USA). Persistent astrogliosis after post‐PI was assessed in various cortical areas using glial fibrillary acidic protein (GFAP; a marker of astrogliosis) immunostaining, while the presence of microglial activation was evaluated using ED1 (a marker of macrophages) and CD11b (a marker of macrophages and microglia) immunostaining. Cell death (apoptosis) was determined with cleaved caspase 3 (a marker of apoptotic cell death) and Fluoro‐Jade. As gray matter damage has been highly related to WMD and to functional deficits in patients that were suspected to have experienced perinatal HI, we counted the numerical density of neurons (NeuN+ cells) as well as GABAergic interneurons co‐expressing GAD67 and some of the principal calcium‐binding proteins (calbindin and calretinin) in the sensorimotor and prefrontal cortices. In fact, GABAergic interneurons are known to be more active than excitatory neurons, to regulate neuronal differentiation, maturation and migration during development (52), and to alter representational features in the sensorimotor cortex 18, 33 or cognitive functions in the prefrontal cortex (30).
The brains were examined on P60 in three separate experiments. After chloral hydrate anesthesia, each animal received a transcardial infusion of 4% paraformaldehyde in phosphate buffer (0.12 M, pH 7.4). The brains were harvested, postfixed in the same fixative for 3 h, cryoprotected in sucrose 30% and frozen in liquid nitrogen‐cooled isopentane. For the stereological analysis, serial free‐floating 40‐µm coronal sections were obtained from each encephalon and were subsequently processed for immunocytochemical analysis. Immunolabeling with the primary antibodies directed against NeuN, GAD67, calbindin D28kd and calretinin was visualized using the streptavidin–biotin–peroxidase method, as previously described (48). Numerical densities of the total neuronal population (NeuN‐labeled cells) and of populations labeled by the three markers for GABAergic neurons (GAD67, calbindin D28kd and calretinin) were estimated using the optical dissector method (see Supporting Information Materials and Methods for further details) (48).
For APP, GFAP, ED1, CD11b, caspase 3 and MBP immunohistochemistry, 15‐µm coronal sections from the cortex to the brain stem were mounted on slides and were probed with specific primary antibodies to each protein (see Supporting Information Materials and Methods). GFAP, ED1, CD11b and caspase 3 immunohistochemistry was visualized using a secondary antibody conjugated to Cy3, and the numerical density of each was counted, as previously described (20). APP immunohistochemistry visualized using the diaminobenzidine (DAB) method was quantified using a percent area fraction of thresholded immunostaining method (see Supporting Information Materials and Methods for further details). The corpus callosum thickness and the optical density of MBP‐immunoreactive fibers were measured in the genu of the corpus callosum and cingulum, respectively, in coronal sections (+2.16 to −0.36 mm from the bregma). At least four sections each from six animals per group were examined. The optical density was measured at 100× magnification using a computerized image‐analysis system (ImageJ, NIH, MA; http://rsb.info.nih.gov/ij/) that read the optical density as gray levels. Nonspecific background densities were measured at each brain level in a region devoid of MBP immunostaining and were subtracted from values for the cingulum. Alternate sections were also stained with Fluoro‐Jade using previously described methods (14). The heights of the genu of the corpus callosum, and S1, M1 and entorhinal cortices were also measured in hematoxylin and eosin (H&E)‐stained sections using the Auto‐Width tool of the Bioquant Image Analysis program (BIOQUANT Image Analysis Corporation, Nashville, TN, USA), in which the inner and outer boundaries of structures were traced, and then mean layer thicknesses were automatically generated.
After the transcardial perfusion with fixative, the hind limbs were collected from 16 rats per group and were postfixed by immersion for 3 days. A calliper (Mitutoyo Vernier Pointed Jaw Caliper model 536‐121; accurate to 0.05 mm; Mitutoyo, Aurora, IL, USA) was used to measure the length and width of the gastrocnemius muscle at its widest point. A flexible suture, which was then measured with the calliper, was used to determine the gastrocnemius circumference at its widest point. The gastrocnemius muscle was then collected, sectioned, mounted onto coated slides (Fisher Plus, Thermo Fisher Scientific, Pittsburgh, PA, USA) and stained with H&E as described previously (59). Cross‐sectional areas (square micrometer) of individual myofibers at mid‐muscle mass were measured, in a blinded fashion, using an image‐analysis system (Bioquant Osteo II; Bioquant Image Analysis). A mean of 146 myofibers were measured per muscle in three different nonadjacent sections (mean of 48 myofibers measured per site) using 400× magnification, bilaterally, as described previously (20).
Statistics
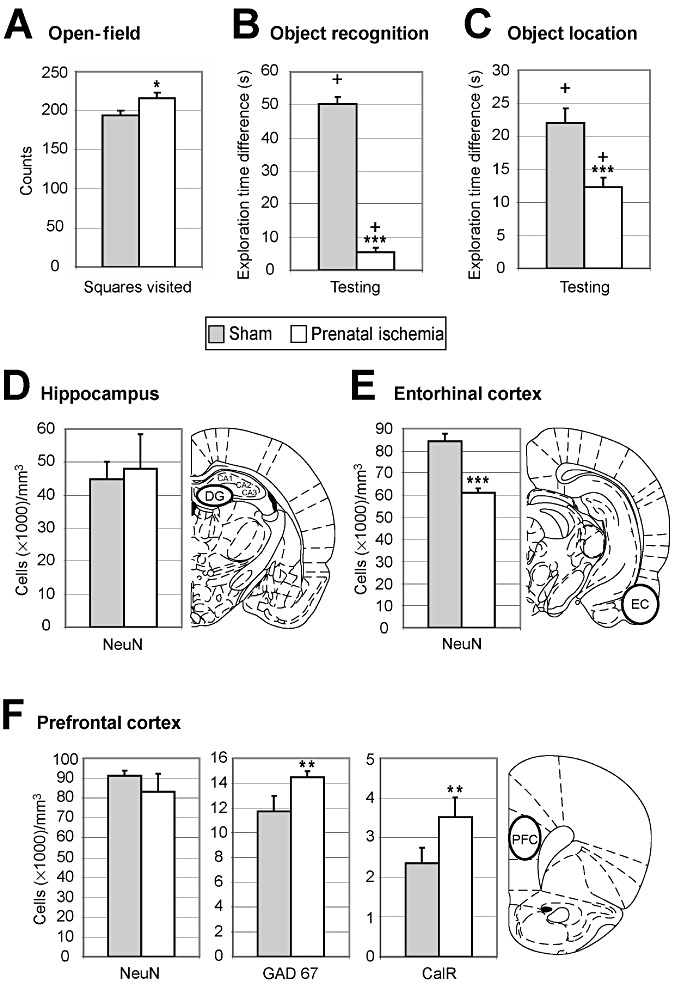
To assess responses to novelty or spatial change in each group, the response‐to‐novelty times and the response‐to‐spatial‐change times were compared to the times that could be obtained by chance alone (difference of zero indicating similar exploration of objects) using one‐tailed t‐test with a mean equal to zero (47).
The one‐ and two‐tailed t‐tests, chi‐square test and Mann–Whitney U‐test were performed using either GraphPad Prism (GraphPad Software, La Jolla, CA, USA) or R (The R Foundation for Statistical Computing, Institute for Statistics and Mathematics, Wien, Austria). For locomotion, hind limb anatomy, cell counts and cortical maps, all data were described as mean ± standard deviation (SD). For weights, behavioral tests and immunocytochemical analyses, all data were described as mean ± standard error.
RESULTS
Physical development
The body weight of rats from the two groups was evaluated at different time points. The averaged weight of PI rats of either sex was lower than that of sham rats at P0 (P < 0.0001) and P28 (P = 0.03; Supporting Information Table S1). Indeed, the attribution of pups to the PI group was based on such a difference in weight at birth. At P0, the weights of both PI males and females were less than their sham male and female counterparts, whereas the weights did not differ significantly between the two groups when considering gender at P28 (Supporting Information Table S1). At P90‐110, the weight did not differ between the two groups overall (P = 0.32), although males weighed significantly more than females in both the sham and PI groups (Supporting Information Table S1). In addition, the tibial bone length measured during gait on treadmill at P65 did not differ between the two groups (sham: 3.36 ± 0.48 cm, mean ± SD; PI: 3.22 ± 0.40 cm; P = 0.47).
WMD induced by PI
In addition to myelination deficits (Supporting Information Figure S1 showing reduced white matter of adult PI rats compared to sham rats) previously reported (45), white matter changes in adult PI rats were also associated with axonal degeneration evidenced by increased APP staining and beading (Figure 1) and Fluoro‐Jade staining (Supporting Information Figure S2). We observed the absence of cystic lesions, as shown in Supporting Information Figures S1–S4. In PI rats, we found evidence of APP+ axonal degeneration in the white matter of the cingular (P = 0.0024) and somatosensory (P = 0.04) cortices, internal capsule at the level of the thalamus (P = 0.005) and the pontocerebellar tract, but not in the corticospinal tract in the brain stem (Figure 1). Also in PI rats, Fluoro‐Jade staining was present in axons in the cingular white matter and corpus callosum, and in white matter tracts underlying the somatosensory cortex (Supporting Information Figure S2B,D), but not in these same regions in sham rats (Supporting Information Figure S2A,C). The height of the corpus callosum genu was less in PI rats than in shams (sham: 600.4 ± 57.51 µm, mean ± SEM; PI: 388.4 ± 13.46 µm; P < 0.0001). In addition, more GFAP+ astrocytes, indicative of astrogliosis, were counted in the white matter of the cingular (P = 0.004) and somatosensory (P = 0.001) cortices of PI rats in adulthood than in sham rats (Figure 2). In contrast, there were no differences in CD11b+ or ED1+ labeling observed in these same white matter regions in either group (data not shown). There was also an absence of CD11b+ and ED1+ cells in the internal capsule of either group.
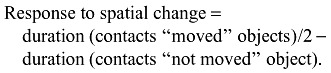
Figure 1.
Amyloid precursor plaque (APP ) immunohistochemistry (indicative of axonal degeneration) in brain and brainstem coronal sections showing increased percent area fraction of APP staining in white matter of prenatal ischemia (PI) rats (B,D,F,H) compared to sham (A,C,E,G) rats. Panels A and B show the cingular cortex white matter (CG WM) and the corpus callosum (CC). Panels C and D show the internal capsule (IC) at the level of the thalamus. Arrows in D indicate injured axons traversing the internal capsule. E,F. Corticospinal tract axons (CST) and pontocerebellar tract (PCT) axons in the brain stem at mid‐pons level showing many injured axons in PCT. Inset in F shows enlargement of a region of the PCT and CST. APP immunopositive beading is present in the PCT. G,H. Primary somatosensory (S1) cortex and white matter below S1 (S1 WM). Inset in G shows higher power of increased APP staining and beading of the S1 WM region, indicative of axonal injury. I. Plots in several brain areas. M1 = primary motor cortex; M1 WM = white matter below M1. *P < 0.05; **P < 0.01 compared to matching sham region. Scale bar = 50 µm.
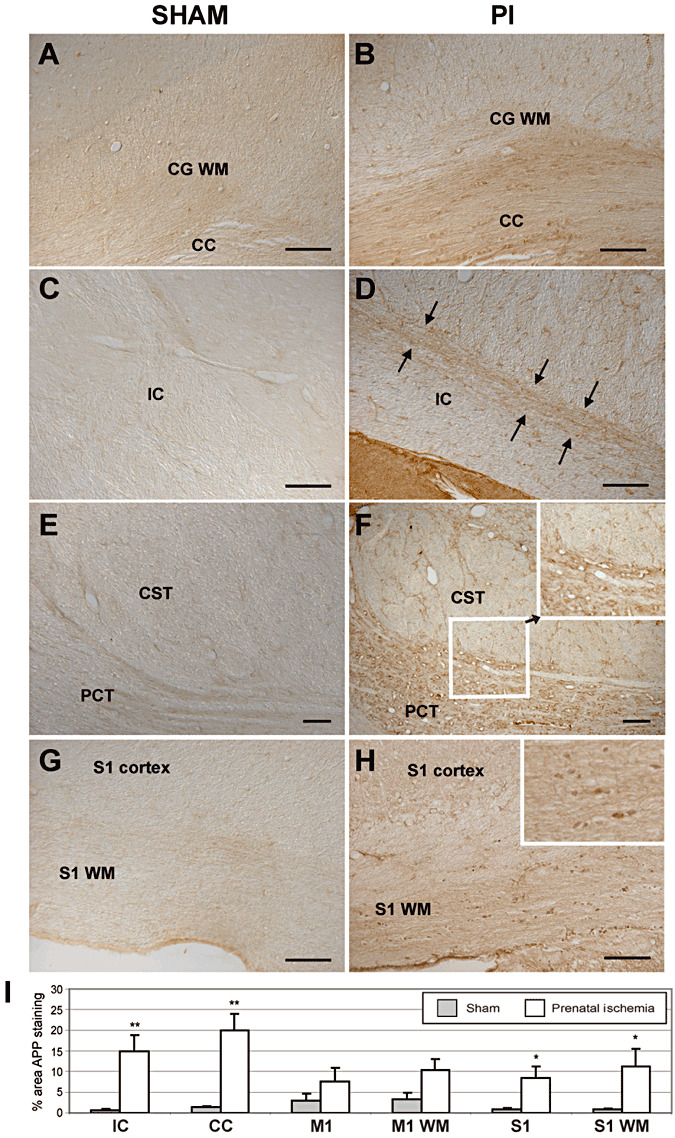
Figure 2.
Glial fibrillary acidic protein (GFAP) immunohistochemistry in brain coronal sections showing increased astrocyte gliosis in prenatal ischemia (PI) rats (B,D,F) compared to sham (A,D,E) rats. Panels A and B show the cingular cortex white matter (CG WM). C,D. Primary somatosensory (S1) cortex and white matter below S1 (S1 WM). H. adjacent hippocampus. Panels E and F show astrogliosis in the dentate gyrus (DG) region of the hippocampus. G. Plots in several brain areas. CA1 = ammonic field 1 of the hippocampus = micrograph not shown; CG WM = cingular cortex white matter; EC = entorhinal cortex; M1 WM = white matter below the primary motor cortex. *P < 0.05; **P < 0.01 compared to matching sham region. Scale bar = 50 µm.
Gait and posture
On P65 at a treadmill speed of 0.23 m/s, PI rats displayed a similar cadence (2.3 ± 0.2 steps/s) as did sham rats [2.3 ± 0.3 steps/s; P: not significant (n.s.)], but shorter normalized swing length (2.6 ± 0.2) relative to tibial size than sham rats (3.0 ± 0.4; P < 0.02). PI rats also exhibited lower normalized foot speeds during swing on both the x‐axis (PI: 20.56 ± 0.87; sham: 26.67 ± 4.02; P < 0.001) and the z‐axis (PI: 13.34 ± 2.03; sham: 17.87 ± 1.45; P < 0.05). At the beginning of the stance, the hip angle was smaller in PI than in sham rats (P < 0.01), but the angles of the knee and ankle were not significantly different (Figure 3B). At the beginning of the swing, only the knee angle was significantly larger in the PI rats than in the sham rats (P < 0.02; Figure 3C). At the maximal height of the swing, PI rats had a smaller hip angle (P < 0.02) but larger angles of the knee (P < 0.02) and ankle (P < 0.04) than sham rats (Figure 3D). PI rats exhibited a slight overflexion of the hip compensated by a slight overextension of both the knees and the ankles during posture and gait, especially at the maximal swing amplitude before the foot was projected forward.
Hind limb muscle anatomy
The width, length and circumference of the gastrocnemius muscle did not differ between the two groups. However, cross‐sectional areas of gastrocnemius myofibers were significantly greater in PI rats than in sham rats (P < 0.002; Figure 3E), indicating muscle hypertrophy in the PI group. The hypertrophic changes were at the myofiber level, however, as the gastrocnemius width and circumference were not significantly different between the two groups. In addition, we found a qualitative increase in resistance to the velocity‐dependent passive motion of the leg in PI rats (data not shown),
Motor cortical maps and neuroanatomy
In sham controls, the M1 hind limb area was delimited either by no responses or by whisker, jaw or neck movements along the caudal, medial and lateral borders and by forelimb movements along the rostral border. The representation of hind limb joint movements did not show a clear topographic distribution (Figure 4A), as previously described (58).
No significant between‐group differences were found for the total area of the M1 hind limb map, cortical area devoted to each joint (Table 1; Figure 4A,B), overall threshold (ie, minimal amount of current needed to evoke a movement) of neuronal M1 responses or threshold for most of the hind limb joints. The only exception is the toes had a lower threshold in the PI group than in the sham group (P < 0.01; Table 1). Outside the motor hind limb map, the average threshold required to evoke whisker and forepaw movements did not differ between the groups (Table 1), indicating that PI specifically altered the M1 toe threshold.
Table 1.
Cortical areas occupied by hind limb movements in sham and prenatal ischemia (PI) rats and mean current thresholds (µA) evoking movements. The data are mean ± standard deviation.
| Movement | Sham | PI |
|---|---|---|
| Total map area (mm2) | 3.91 ± 0.48 | 3.77 ± 1.07 |
| Hip (mm2) | 2.93 ± 0.44 | 2.72 ± 1.02 |
| Knee (mm2) | 0.17 ± 0.16 | 0.23 ± 0.33 |
| Ankle (mm2) | 0.50 ± 0.40 | 0.60 ± 0.65 |
| Toes (mm2) | 0.11 ± 0.14 | 0.10 ± 0.17 |
| Multi‐joint (mm2) | 0.21 ± 022 | 0.12 ± 0.19 |
| Overall map threshold (µA) | 43.5 ± 3.3 | 42.9 ± 3.8 |
| Hip threshold (µA) | 43.2 ± 3.8 | 43.3 ± 4.1 |
| Knee threshold (µA) | 44.5 ± 3.5 | 43.1 ± 16.8 |
| Ankle threshold (µA) | 44.5 ± 3.4 | 46.2 ± 6.8 |
| Toe threshold (µA) | 56.8 ± 3.5 | 42.2 ± 10.2* |
| Multi‐joint threshold (µA) | 42.5 ± 7.2 | 41.2 ± 8.7 |
| Forepaw/whisker threshold (µA) | 41.1 ± 5.4 | 43.5 ± 3.6 |
Significantly different from sham rats, P < 0.01.
The numerical density of total NeuN+ neuron populations in M1 showed no significant differences between the groups (Figure 4C). Similarly, no significant between‐group difference was found for GAD67+ neurons (data not shown). In addition, we found no significant changes in APP staining in M1, the white matter below M1 or the corticospinal tract in the brain stem (Figure 1F,I), nor in GFAP+ cell counts in M1 (Figure 2G) between PI and sham rats. Nor did we see cystic lesions (Supporting Information Figures S1 and S4), significant increases in caspase 3 + cells in M1 (Supporting Information Figure S3C,D), or Fluoro‐Jade staining in M1 or white matter tracks below M1 (data not shown) in PI rats, compared to sham rats. No differences in CD11b+ or ED1+ cells counts in M1 were observed between the two groups (data not shown). Furthermore, the height of M1 was equivalent in PI and sham rats (sham: 1676 ± 73.34 µm, mean ± SEM; PI: 1565 ± 92.26 µm; P = 0.41).
Neuroanatomy and functional maps in the somatosensory cortex
Despite idiosyncratic differences, the S1 representation of the hind limb skin surfaces in shams exhibited common somatotopic features, as previously described (9). From rostral to caudal, cortical sites progressed from the toes to the plantar pads of the sole, heel and leg. From lateral to medial in the rostral portion of the hind paw map, the toes were topographically represented from toe 1 (1) to toe 5 (5) (Figure 5A). The overall S1 hind paw map area was 1.6 times smaller in PI rats than in sham rats (P < 0.0001), and the cortical area devoted to the glabrous skin surfaces, but not the hairy surfaces, was also smaller in the PI group (Table 2, Figure 5B). The proportion of cortical sites with at least three multiple, disjunctive RFs were considerably larger in the PI rats than in the sham rats (16.8% vs. 3.7%; P < 0.0001, respectively). In addition, the PI rats had significantly more cortical sites exhibiting RFs located on both glabrous and hairy surfaces compared to the sham rats (6.1% vs. 2.7%; P < 0.02).
Table 2.
Raw and relative cortical areas occupied by hind paw skin regions and relative receptive field (RF) size in sham and prenatal ischemia (PI) rats. The data are mean ± standard deviation. The area with more than two RFs corresponds to cortical sites responding to stimulation of at least three multiple disjunctive skin forepaw subdivisions (toe or pad; see Figure 3).
| Sham | PI | |
|---|---|---|
| Total area (mm2) | 1.29 ± 0.16 | 0.830 ± 0.17*** |
| Glabrous skin (mm2) | 0.93 ± 0.14 | 0.56 ± 0.17*** |
| Hairy skin (mm2) | 0.36 ± 0.10 | 0.28 ± 0.10 |
| Area with >2 RF (mm2) | 0.02 ± 0.02 | 0.13 ± 0.08** |
| RFs without large dorsum (%) | 5.2 ± 0.7 | 8.2 ± 1.9** |
| RFs on glabrous skin (%) | 8.4 ± 1.4 | 12.3 ± 1.7*** |
| RFs on hairy skin (%) | 38.6 ± 10.7 | 56.9 ± 16.8 |
P < 0.002 (significantly different from sham rats);
P < 0.0001 (significantly different from sham rats).
As a large number of RFs encompassed both glabrous and hairy surfaces of the hind paw, the RF area was normalized for the sum of the ventral and dorsal foot skin surfaces. The mean size of all RFs (without the large dorsal foot RFs) was 1.6 times larger in PI than in sham rats (P < 0.001; Table 2; Figure 5). The RFs located on the glabrous foot were much larger in PI than in sham rats (P < 0.0001), whereas the hairy RF size was not significantly different (Table 2). The larger RFs resulted in greater overlap between glabrous RFs and in a coarser‐grained representation of these skin surfaces in the PI group (Figure 5). Because of the larger and overlapping RFs, together with numerous multiple RFs on both sides of the foot, the cortical sites with more than two multiple RFs were clustered in specific cortical sectors [black dots on white background; see Coq et al (9) for more details] of the S1 foot maps (Figure 5A,B). This particular area devoted to cortical sites with more than two RFs was much larger in PI than in sham rats (P < 0.002; Table 2). Whereas the overall foot somatotopy was preserved, the enlargement of the latter cortical area within the S1 maps led to disruptions in the continuity of contiguous glabrous surfaces, producing a patchy representation.
These functional changes were related to neuroanatomical features in adult rats. PI rats had a lower total neuron (NeuN+) density in S1 compared to shams (P < 0.05; Figure 5C; Supporting Information Figure S4B vs. S4A). Moreover, the stereological densities of GABAergic interneurons labeled with GAD67, calbindin and calretinin were markedly diminished in PI rats (P < 0.01 to P < 0.001; Figure 5D). These findings suggest a mild impact of PI on overall neuronal density but a higher impact on GABAergic interneurons in the form of a marked reduction in GABAergic inhibition in S1 (33). In addition, PI produced both axonal degeneration in the S1 cortex and the white matter below S1, as shown with APP staining (Figure 1G–I), and increased GFAP+ cell counts in S1 and the related white matter (Figure 2D,G). No cystic lesions were observed in the S1 of PI rats (Supporting Information Figures S2 and S4). Also, like M1, there were no differences in CD11b or ED1 staining observed in S1 or associated white matter between the two groups (data not shown). However, the height of the S1 cortex was less in PI rats than in shams (sham: 1767 ± 54.33 µm, mean ± SEM; PI: 1553 ± 57.17 µm; P = 0.02). There was also a clear increase in Fluoro‐Jade stained cells in the S1 cortex and related white matter (Supporting Information Figure S2), Fluoro‐Jade stained axons in the cingular white matter and corpus callosum (Supporting Information Figure S2), and in caspase 3 + cells (Supporting Information Figure S3).
Open‐field exploration
PI rats visited significantly more squares in the open‐field test than the sham rats (P < 0.02; Figure 6A), which clearly indicates signs of spontaneous exploratory and motor hyperactivity 4, 54. The numbers of rearings (PI: 43.2 ± 2.7; sham: 49.8 ± 2.8; P: n.s.) and groomings (PI: 5.5 ± 0.5; sham: 4.6 ± 0.5; P: n.s.) did not differ between groups.
Figure 6.
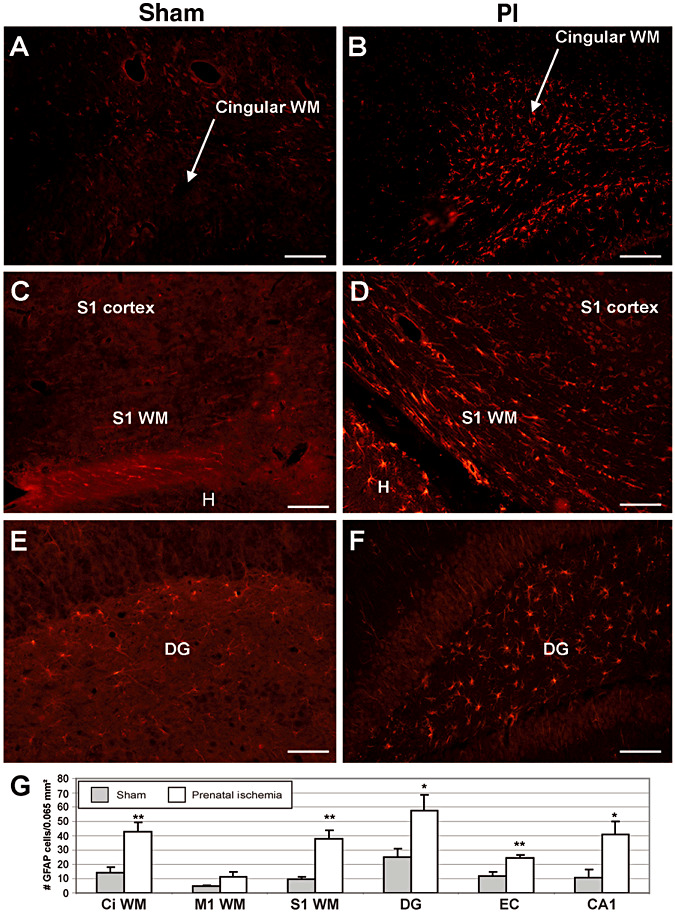
Effects of prenatal ischemia (PI) on performance on several cognitive tasks. A. Levels of spontaneous locomotor activity measured by the numbers of square crossings, rearings and groomings in an open‐field arena. PI rats exhibited spontaneous locomotor hyperactivity. B. Short‐term performance on an object‐recognition task. Sham rats spent considerably more time exploring the “new” object” than the “familiar” object after a 1‐minute delay, whereas little difference was found between these two times in the PI rats, suggesting deficits in novelty detection after PI. C. Short‐term performance on an object‐location task. After a 1‐minute delay, sham rats spent more time exploring objects in new locations than the object left in the same place, whereas the difference between the two times was smaller in the PI rats. PI induced deficits in the short‐term recognition of changes in object location. D. Numerical neuron density in the dentate gyrus of the hippocampus. Neuronal counts in the dentate gyrus did not differ between the two groups. E. Neuronal density in the entorhinal cortex. NeuN+ immunoreactive cell counts in the entorhinal cortex were much lower in the PI rats than in the sham rats. F. Stereological neuron densities in the prefrontal cortex. NeuN+ immunoreactive cell density did not differ between sham and PI rats, whereas the density of GAD67+ and CalR+ immunoreactive interneurons was increased in PI rats. In panels D–F, the location of stereological counts is shown on the corresponding coronal section (49). A–F. Mean ± standard error. *P < 0.05; **P < 0.01; ***P < 0.001. + indicates a significant response to novelty (B) or spatial change (C) above the chance level (equal to zero); DG = dentate gyrus; EC = entorhinal cortex; PFC = prefrontal cortex.
Short‐term performances in object‐recognition memory
For the object‐recognition task (ie, “what” features; see Materials and Methods), the time spent exploring both objects did not differ significantly between groups during the 5‐minute familiarization session (PI: 70.50 ± 4.84 s; sham: 80.21 ± 1.86 s; P: n.s.), as expected (47). After 1 minute of retention in the same task, both rat groups spent significantly more time exploring the “new” object compared to the value expected by chance during the 3‐minute testing session (chance level = 0; PI, P = 0.03; sham, P < 0.0001, one‐tailed t‐test; Figure 6B). However, the difference in time spent exploring the “new” object vs. the “familiar” one was much smaller in the PI group than in the sham group (P < 0.0001 two‐tailed t‐test; Figure 6B).
In the object‐location task (ie, “where” features; see Materials and Methods), the time spent to explore the three objects arranged along a diagonal line during familiarization did not differ significantly between groups [F(1,36) = 0.13; P: n.s.] and decreased gradually over the three familiarization sessions [F(2,72) = 45.15; P < 0.0001], as expected (47). During testing after 1 minute of retention, both groups spent significantly more time exploring the “moved” objects compared with the value expected by chance (PI and sham, P < 0.0001, one‐tailed t‐test; Figure 6C). However, the difference in time spent exploring the “moved” vs. “not moved” objects was significantly smaller in the PI group (P < 0.001, two‐tailed t‐test; Figure 6C).
In the prefrontal cortex, no significant difference in NeuN+ cell density was found between PI and sham rats (Figure 6F; Supporting Information Figure S4C,D). Numerical neuron density in the dentate gyrus of the hippocampus did not differ between groups (P: n.s.; Figure 6D), whereas the number of neurons in the entorhinal cortex was smaller in the PI than the sham rats (P < 0.0001; Figure 6E). Interestingly, densities of GAD67+ and calretinin+ neurons in the prefrontal cortex were higher in the PI rats compared with the sham rats (P < 0.01; Figure 6F). Moreover, PI produced an intense astrogliosis in the dentate gyrus, entorhinal cortex and CA1 of the hippocampal complex (Figure 2E–G), a small increase in caspase 3+ cells in the hippocampus (Supporting Information Figure S3G,H), but no increase in ED1+ or CD11b+ cells (data not shown) in PI rats, compared to sham controls.
DISCUSSION
This is the first article to study simultaneously locomotor, sensorimotor and cognitive dysfunctions and related neuroanatomical changes in adult rats, which exhibited WMD induced by PI. We showed that PI induced (1) non‐cystic white matter injury detected by axonal degeneration [decreased MBP (45) but increased APP and Fluoro‐Jade labeled axons] in the corpus callosum genu, internal capsule and white matter below S1, but not in M1, as well as decreased height of the genu of the corpus callosum; (2) persistent astrogliosis, but not microglial or macrophage reactivity, in white matter below the cingular cortex and S1, and in S1 and entorhinal cortices and the hippocampal complex, but not in M1 nor in the white matter below M1; (3) mild locomotion impairments associated with mild gastrocnemius muscle hypertrophy; (4) signs of spontaneous hyperactivity in open‐field testing and short‐term deficits in object‐recognition memory, concomitant with (5) decreased neuronal counts in S1 and entorhinal cortices, but not in the hippocampal dentate gyrus, as well as decreased height of S1 and increased presence of caspase 3 stained apoptotic neurons in S1, but not M1; and (6) decreased GABAergic interneurons in S1 but increased GABAergic interneurons in the prefrontal cortex. Lastly, (7) we also found severe alterations in neuronal properties, and functional and neuroanatomical organization of the somatosensory cortex, whereas no significant changes were found in the motor cortex.
A rodent model of WMD
We found in previous and present studies that PI induced growth retardation at birth up to 1 and 2 months of age 45, 46, which did not persist later in adulthood. Indeed, PI and sham rats exhibited comparable weights at P90‐110, while typical intersex differences in weight were present at that age.
Subplate and periventricular WMD is now considered the predominant pathological condition observed in infants born very prematurely 2, 34, 40, 41, 57, 61. Although focal necrosis (periventricular leukomalacia) was previously thought to be the main neuropathological lesion in preterm infants, it has become well documented that diffuse, noncystic WMD is the most common feature of white matter injury 26, 27, 34, 57, 61. Moreover, diffuse WMD correlates closely with a significant decrease in the cortical volume of gray matter 2, 32, 34, which, when combined, may explain the various sensory, motor and cognitive deficits often encountered in children with history of perinatal HI 2, 27, 61. The presence of axonal retraction bulbs and swelling, and the accumulation of APP in axons in this study are features of axonal damage. Their presence is considered by some to be the hallmark of diffuse axonal injury 6, 28. Using anti‐APP, we observed white matter degenerative changes in the corpus callosum genu, internal capsule, white matter below S1 and pontocerebellar tract, but not in the white matter below M1, nor in the corticospinal tract. Fluoro‐Jade is an anionic fluorescent dye that preferentially stains the cell bodies, dendrites, axons and axon terminals of degenerating neurons (14). Its presence in the white matter tracts below S1 and cingular cortices, and in the genu of the corpus callosum provides further evidence of axonal degeneration in these regions. These degenerative axonal changes were concomitant with the decreased height of the genu of the corpus callosum (further supportive of loss of axons in the corpus callosum) as well as increased GFAP+ cells, indicative of the persistent astrogliosis, in these same white matter regions. While most of the studies examining the effects of hypoxia or ischemia on brain tissues are acute studies (≤7 days), very few have continued to examine changes for 14–28 days post‐hypoxia/ischemia exposure (28). These authors observed the continued presence of axonal degeneration, astrogliosis and neuronal degeneration for the length of experimental investigation, albeit these changes are less overt than that seen at earlier points (28). In contrast, microglial cell reactivity typically subsided earlier as they are typically part of an earlier neuroinflammatory phase than astrocytes (44), or if present, do not always recognize APP+ axons as “foreign”(43). As global hypoxia and local ischemia have been shown to impair the bioenergetic state, ion homeostatis and eletrophysiological status of the brain (23), a sustained alteration in axonal transport mechanisms may be leading to sustained axonal injury and swelling with continued gliosis in our model, similar to that seen by Hellewell and colleagues (28) in a traumatic brain injury model with hypoxia. The continued axonal damage may be driving the astrogliosis, and the reactive astrocytes may be driving the axonal damage in a vicious cycle, as they are known to release inflammatory mediators that contribute to secondary injury 43, 44. Thus, our animal model based on PI appears relevant as it reproduces the most frequent pathological features observed in human diffuse WMD, including deficient myelination and astrogliosis during maturation and adulthood in present and previous studies 45, 46.
Impact of PI on motor function and cortex
The links between WMD and motor disabilities ranging from minor to major are now well established 29, 32, 37, 62. Indeed, diffuse damage or dysfunction of the subplate and its efferent motor connections in the periventricular white matter has recently been shown to correlate closely with reduced movement complexity and variability during early development in preterm infants and in children with CP 27, 57. Our PI rats showed in adulthood mild gait deficits on treadmill, characterized by shorter strides, lower swing speeds and slight but significant hip overflexion while the knee and ankle were overextended, especially during hind limb protraction. Studies of perinatal HI have produced contradictory results. Some authors report mild to marked gait abnormalities in HI rats, such as shorter stride length (53), a shorter time to falling from rotarod in some instances (24) but not in others (4), impaired rod and beam walking (41), and delayed motor abilities (39). In rabbits, the severity of the motor disabilities and muscle hypertonia correlated with WMD induced by prenatal HI 12, 13, 17. Previous studies in adult rats after neonatal asphyxia showed mild hypertonia and signs of spasticity in the hind limbs associated with slightly altered walking patterns, whereas no changes were detected in M1 map features 9, 58. In our study, increased APP staining in the pontocerebellar tract, a tract that, when lesioned, is associated with limb ataxias (55), enhanced resistance to velocity‐dependent passive motion of the leg, persistent hind limb changes in adult rats with myofiber hypertrophy in the gastrocnemius and mild gait impairments. These changes combined are suggestive of spasticity in PI rats.
Postnatal HI resulted in degraded evoked potentials in M1 cortex at P10 but no further degradation by P21, suggesting plasticity processes occurring later after HI (50). In our study, brain plasticity may have occurred in the M1 cortex after PI, partially explaining the lack of M1 reorganization. PI produced no significant alterations of both organization of the motor hind limb maps and M1 neuronal properties. In addition, no neuroanatomical changes were found in M1 (ie, no significant differences in neuronal counts, axonal degeneration and astrogliosis), and no sign of axonal degeneration was detected in the corticospinal tract, the main efferent tract of M1. In contrast, rabbits with prenatal HI exhibited drastic WMD and astrogliosis in M1 that was correlated with muscle hypertonia and motor deficits during swimming 13, 17. In the same line, reduced layer V pyramidal and GABAergic cell counts were recently found in cortical areas of premature children with WMD, as well as astrogliosis (2). Our findings suggest that central motor command [ie, M1; see Drew et al (15)] may remain intact after PI in adult rats, while fine‐gait kinematics was altered. Several factors including mild muscular spasticity (58), abnormal activity of spinal central pattern generators (27) or aberrant motor efferent projections (25), such as the pontocerebellar tract (damaged in the present study), may have contributed to the mild locomotor dysfunctions we observed after PI.
PI induces alterations in the somatosensory cortex
In addition to their motor problems, children with CP commonly exhibit tactile discrimination impairments that are strongly related to dexterity disabilities, as well as proprioceptive deficits 64, 65 in relation to reduced activation of multiple somatosensory cortical areas (66). In our study, PI induced severe functional alterations in S1, including increased numbers and enlargement of multiple RFs, as well as degraded topography of the hind limb somatosensory maps and altered S1 neuronal properties. Such a S1 map degradation in rats has been shown to correlate with deficits in tactile discrimination abilities (69). In addition, we found degenerating cells (indicated by the presence of caspase 3 and Fluoro‐Jade stained neurons) and astrogliosis in S1, as well as indicators of WMD in the white matter associated with S1 (increased APP+ and Fluoro‐Jade stained axons, along with astrogliosis). Caspase 3 immunostained neurons have also been seen after ischemia (38). The presence of each of these markers that are linked to cell degeneration in S1 and its associated white matter is indicative of a persistent neurodegenerative process in the adults rats of this study, despite the length of time since the initial ischemic insult. The pontocerebellar tract of the brain stem, a tract that carries both motor and sensorimotor cortical inputs to the cerebellum (51), was also affected in the PI rats. As the M1 cortices did not show WMD, the most probable reason for axonal degeneration in the pontocerebellar tract was related to axonal damage present in S1 and its underlying white matter tracts. As somatosensory input, including input from S1, to lateral tactile regions of the cerebellum is crucial for optimizing fine regulation of voluntary movement (41), the WMD damage in the pontocerebellar tract likely contributed to some of the observed locomotor deficits.
We also found reduced numerical density of total neurons in S1, especially inhibitory interneurons, and increased GFAP+ stained cells in this same region. These results are in accordance with the neuronal loss and glial scars observed in layers II, III and IV of the rat parietal cortex after postnatal HI (50). Here we refined these findings by demonstrating that GABAergic interneuron numbers were drastically reduced, suggesting decreased inhibition within S1 (33). Reduction of cortical GABAergic inhibition may account for the RF enlargement, as previously demonstrated (18), S1 map organizational disruption 7, 9, and subsequent tactile and kinesthetic deficits in patients with CP 64, 65. Indeed, in patients exhibiting periventricular leukomalacia, WMD seemed highly related to neuronal loss, including pyramidal (2) and inhibitory interneurons (62), in multiple layers of sensory cortical areas. Early HI‐induced damage to the cortical subplate has been shown to disrupt inhibitory interneuron survival and migration, maturation of layer IV inhibitory synapses and formation of thalamocortical synapses from E16 to E21 in rats 35, 40, 41 and in preterm infants 2, 61, thus altering cortical organization, plasticity and coordination between S1 and M1 7, 61, 66. In children with CP born preterm, Hoon et al (29) showed that somatosensory and motor deficits correlated with damage to the thalamocortical pathway (ie, posterior thalamic radiation) but not with damage to the corticospinal tract 29, 62, which remained intact after early PI (E17) in our study. Disruption of messages from S1 to M1 might lead to abnormal somatosensory feedback for motor coordination and to motor dysfunctions 7, 9, 66, as found during locomotion in our study.
Spontaneous hyperactivity and short‐term recognition memory deficits related to PI
Cognitive deficits without major motor impairments are the dominant neurodevelopmental sequelae in premature infants and are commonly related to diffuse noncystic WMD 1, 22, 37, 61, 68. On the other hand, premature birth appears strongly correlated to learning and working memory disabilities, attention deficit/hyperactivity disorder (ADHD) (ie, inattention, hyperactivity and impulsivity), deficits in visual‐spatial memory recognition and executive function impairments such as attentional selection, resistance to interference, behavioral inhibition, planning and decision making 1, 5, 11, 22, 61, 68. These cognitive tasks imply the integrity of structures like the hippocampal complex, entorhinal and prefrontal cortices (19).
In the present study, PI rats visited more squares than sham rats in open‐field testing, indicating spontaneous exploratory and motor hyperactivity 4, 54. PI rats also exhibited short‐term deficits in both their reaction to novelty in an object‐recognition task and their detection of spatial changes in an object‐location task. Thus, we describe here an animal model of perinatal brain injury leading to clear signs of hyperactivity and short‐term impairments in object‐recognition memory during adulthood. Several studies have reported early hyperactivity in open field when rats were pups or juveniles, while later in adulthood, spontaneous activity reached control levels following prenatal (8) or postnatal HI 4, 21. In contrast, PI was found to reduce spontaneous locomotion in open‐field assays (53), while neonatal HI did not alter locomotion in open field (41). Postnatal hypoxia was found to induce hyperactivity only in juvenile males (54). These studies differ with our observed hyperactivity during adulthood. Such a discrepancy may result from the type and timing of insults used in previous studies. Also, the poor levels of performances on short‐term object‐recognition tasks in PI rats once in adulthood seem related to both working memory impairments and attentional deficits (19). In addition to behavioral impairments, we found no neuronal changes in the dentate gyrus of the hippocampal complex, whereas neuronal density was decreased in the entorhinal cortex. We also observed astrogliosis in the dentate gyrus and CA1 of the hippocampus and in the entorhinal cortex of adult PI rats. Astrogliosis and myelin deficits have been found to correlate with impairments in spatial cognition in rats with neonatal HI (31); such findings are in accordance with our results. In our study, the working memory deficits also appeared concomitantly to an increased density of GABAergic neurons in the prefrontal cortex. Neonatal damage to the prefrontal cortex has been shown to induce hyperactivity (36) and short‐term memory deficits in object‐recognition tasks in adult rats (56). In addition, inactivation of the rat prefrontal cortex using muscimol infusion (ie, a GABAergic agonist) has been shown to lead to cognitive impairments (30). In our study, increased numbers of GABAergic interneurons may have resulted in enhanced neuronal inhibition within the prefrontal cortex and then mimicked either an inactivation or a lesion of this cortical area, essential for executive functions, memory and learning processes in rodents (19). In addition, early cortical subplate ablation results in enhanced cortical inhibitory activity and dysfunction of homeostatic regulation of cortical excitation/inhibition (35). In humans, the prefrontal cortex seems involved in ADHD symptoms and contributes to executive functions, such as spatial and nonspatial working memory (67). The combination between spontaneous hyperactivity in open field and working memory/attention deficits described here appears relevant as these disorders are often present in young adults with WMD and histories of perinatal HI or prematurity 1, 5, 22, 61, 68.
In summary, we demonstrated that PI was associated with both WMD and subsequent neuronal changes in various brain areas. In adult rats, these changes induce a combination of functional deficits that is also observed in humans after premature birth or in humans who develop CP and that includes subtle gait abnormalities, sensory and cognitive impairments, and hyperactivity disorder. Thus, our results give new insights into the neuronal mechanisms underlying the relationship between PI, brain injury, including white and gray matter damage, and subsequent functional impairments. Our animal model based on PI may be valuable for exploring new strategies for the prevention of damage in immature brain.
Supporting information
Figure S1. Quantitative analysis of corpus callosum thickness measured on coronal sections showing a decreased thickness in prenatal ischemia (PI) compared to sham adult rats (A). Quantitative analysis of myelin basic protein optical density measured in cingular white matter on coronal sections showing decreased myelin content in PI compared to sham adult rats (B,C). All data are reported as mean ± standard error. *P < 0.05; **P < 0.01 using Mann–Whitney U‐test.
Figure S2. Fluoro‐Jade staining (indicative of axonal degeneration) in brain coronal sections showing increased staining in white matter (WM) regions in prenatal ischemia rats (B,D,F) compared to sham (A,C,E) rats. Panels A and B show the cingular cortex white matter and the corpus callosum. Panels C and D show the hippocampus CA1 region, primary somatosensory cortex (S1) and underlying WM. Fluoro‐Jade stained neurons are also visible in the hippocampus and S1 cortex. Panels E,F. Entorhinal cortex and nearby WM of the external capsule (not labeled). Similar results were observed in n = 5/group. Scale bar = 50 µm.
Figure S3. Caspase 3 immunohistochemistry in brain coronal sections showing increased caspase 3 immunostaining, indicative of apoptosing cells, S1 and hippocampal regions but not M1, in prenatal ischemia (PI) rats (B,D,F,H) compared to sham (A,C,E,G) rats. Panels A and B show the primary somatosensory (S1) cortex. Inset in B shows higher power of a neuron from S1 that is immunopositive for caspase 3. Panels C,D. Primary motor (M1) cortices showing no caspase 3 staining in either panel. Panels E and F showing white matter regions below primary somatosensory cortex (S1). Panels G and H show the CA1 region of the hippocampus and show scattered cells with increased caspase 3 staining in the CA1 region of a PI rat (panel H) but not in a sham rat (panel G). Similar results were observed in n = 5/group. Scale bar = 50 µm.
Figure S4. NeuN immunohistochemistry in brain coronal section in S1 cortex (A,B) and prefrontal cortex (C,D) in sham and PI adult rats. Insets depict high magnification (×100) of cortical layer V neurons.
Table S1. Weight in grams of sham and prenatal ischemia (PI) rats at different postnatal days. The weight was averaged by group and by sex. The weight of PI rats was lower at P0 and P28 than in sham rats, while not at P90‐110. At P90‐110, the weight difference was only related to sex. The data are mean ± standard error of the mean.
Supporting info item
Supporting info item
Supporting info item
Supporting info item
Supporting info item
Supporting info item
ACKNOWLEDGMENTS
We are grateful to Dr C. Assaiante, Dr M. Darnaudéry, and Dr V. Paban for helpful comments and discussion. This work was supported by the Ministère de l'Enseignement Supérieur et de la Recherche, Centre National de la Recherche Scientifique (CNRS), Institut National de la Santé Et de la Recherche Médicale (Inserm), NIH, Agence Nationale pour la Recherche (ANR‐06‐Neuro‐040‐03), La Fondation NRJ—Institut de France, Région Provence‐Alpes‐Côte‐d'Azur, Mairie de Paris, La Fondation Motrice, Paris 7 University, the Cerebral Palsy Institute and PremUP foundation.
REFERENCES
- 1. Aarnoudse‐Moens CSH, Weisglas‐Kuperus N, van Goudoever JB, Oosterlaan J (2009) Meta‐analysis of neurobehavioral outcomes in very preterm and/or very low birth weight children. Pediatrics 124:717–728. [DOI] [PubMed] [Google Scholar]
- 2. Andiman SE, Haynes RL, Trachtenberg FL, Billiards SS, Folkerth RD, Volpe JJ, Kinney HC (2010) The cerebral cortex overlying periventricular leukomalacia: analysis of pyramidal neurons. Brain Pathol 20:803–814. [DOI] [PMC free article] [PubMed] [Google Scholar]
- 3. Back SA, Rivkees SA (2004) Emerging concepts in periventricular white matter injury. Semin Perinatol 28:405–414. [DOI] [PubMed] [Google Scholar]
- 4. Balduini W, De Angelis V, Mazzoni E, Cimino M (2000) Long‐lasting behavioral alterations following a hypoxic/ischemic brain injury in neonatal rats. Brain Res 859:318–325. [DOI] [PubMed] [Google Scholar]
- 5. Bhutta AT, Cleves MA, Casey PH, Cradock MM, Anand KJS (2002) Cognitive and behavioral outcomes of school‐aged children who were born preterm: a meta‐analysis. JAMA 288:728–737. [DOI] [PubMed] [Google Scholar]
- 6. Büki A, Povlishock JT (2006) All roads lead to disconnection?—Traumatic axonal injury revisited. Acta Neurochir (Wien) 148:181–193. [DOI] [PubMed] [Google Scholar]
- 7. Burton H, Dixit S, Litkowski P, et Wingert JR (2009) Functional connectivity for somatosensory and motor cortex in spastic diplegia. Somatosens Mot Res 26:90–104. [DOI] [PMC free article] [PubMed] [Google Scholar]
- 8. Cai Z, Xiao F, Lee B, Paul IA, Rhodes PG (1999) Prenatal hypoxia‐ischemia alters expression and activity of nitric oxide synthase in the young rat brain and causes learning deficits. Brain Res Bull 49:359–365. [DOI] [PubMed] [Google Scholar]
- 9. Coq JO, Strata F, Russier M, Safadi FF, Merzenich MM, Byl NN, Barbe MF (2008) Impact of neonatal asphyxia and hind limb immobilization on musculoskeletal tissues and S1 map organization: implications for cerebral palsy. Exp Neurol 210:95–108. [DOI] [PubMed] [Google Scholar]
- 10. Coq JO, Barr AE, Strata F, Russier M, Kietrys DM, Merzenich MM et al (2009) Peripheral and central changes combine to induce motor behavioral deficits in a moderate repetition task. Exp Neurol 220:234–245. [DOI] [PMC free article] [PubMed] [Google Scholar]
- 11. Delobel‐Ayoub M, Arnaud C, White‐Koning M, Casper C, Pierrat V, Garel M, Burguet A (2009) Behavioral problems and cognitive performance at 5 years of age after very preterm birth: the EPIPAGE Study. Pediatrics 123:1485–1492. [DOI] [PubMed] [Google Scholar]
- 12. Derrick M, Luo NL, Bregman JC, Jilling T, Ji X, Fisher K, Gladson CL (2004) Preterm fetal hypoxia‐ischemia causes hypertonia and motor deficits in the neonatal rabbit: a model for human cerebral palsy? J Neurosci 24:24–34. [DOI] [PMC free article] [PubMed] [Google Scholar]
- 13. Derrick M, Drobyshevsky A, Ji X, Chen L, Yang Y, Ji H et al (2009) Hypoxia‐ischemia causes persistent movement deficits in a perinatal rabbit model of cerebral palsy: assessed by a new swim test. Int J Dev Neurosci 27:549–557. [DOI] [PMC free article] [PubMed] [Google Scholar]
- 14. Dragatsis I, Levine MS, Zeitlin S (2000) Inactivation of Hdh in the brain and testis results in progressive neurodegeneration and sterility in mice. Nat Genet 26:300–306. [DOI] [PubMed] [Google Scholar]
- 15. Drew T, Kalaska J, Krouchev N (2008) Muscle synergies during locomotion in the cat: a model for motor cortex control. J Physiol (Lond) 586:1239–1245. [DOI] [PMC free article] [PubMed] [Google Scholar]
- 16. Drobyshevsky A, Song S, Gamkrelidze G, Wyrwicz AM, Derrick M, Meng F, Li L (2005) Developmental changes in diffusion anisotropy coincide with immature oligodendrocyte progression and maturation of compound action potential. J Neurosci 25:5988–5997. [DOI] [PMC free article] [PubMed] [Google Scholar]
- 17. Drobyshevsky A, Derrick M, Wyrwicz AM, Ji X, Englof I, Ullman LM et al (2007) White matter injury correlates with hypertonia in an animal model of cerebral palsy. J Cereb Blood Flow Metab 27:270–281. [DOI] [PubMed] [Google Scholar]
- 18. Dykes RW, Landry P, Metherate R, Hicks TP (1984) Functional role of GABA in cat primary somatosensory cortex: shaping receptive fields of cortical neurons. J Neurophysiol 52:1066–1093. [DOI] [PubMed] [Google Scholar]
- 19. Eichenbaum H, Yonelinas AP, Ranganath C (2007) The medial temporal lobe and recognition memory. Annu Rev Neurosci 30:123–152. [DOI] [PMC free article] [PubMed] [Google Scholar]
- 20. Elliott MB, Jallo JJ, Barbe MF, Tuma RF (2009) Hypertonic saline attenuates tissue loss and astrocyte hypertrophy in a model of traumatic brain injury. Brain Res 1305:183–191. [DOI] [PubMed] [Google Scholar]
- 21. Fan L, Lin S, Pang Y, Lei M, Zhang F, Rhodes PG, Cai Z (2005) Hypoxia‐ischemia induced neurological dysfunction and brain injury in the neonatal rat. Behav Brain Res 165:80–90. [DOI] [PubMed] [Google Scholar]
- 22. Fazzi E, Bova S, Giovenzana A, Signorini S, Uggetti C, Bianchi P (2009) Cognitive visual dysfunctions in preterm children with periventricular leukomalacia. Dev Med Child Neurol 51:974–981. [DOI] [PubMed] [Google Scholar]
- 23. Geeraerts T, Ract C, Tardieu M, Fourcade O, Mazoit J, Benhamou D et al (2006) Changes in cerebral energy metabolites induced by impact‐acceleration brain trauma and hypoxic‐hypotensive injury in rats. J Neurotrauma 23:1059–1071. [DOI] [PubMed] [Google Scholar]
- 24. Girard S, Kadhim H, Beaudet N, Sarret P, Sébire G (2009) Developmental motor deficits induced by combined fetal exposure to lipopolysaccharide and early neonatal hypoxia/ischemia: A novel animal model for cerebral palsy in very premature infants. Neuroscience 158:673–682. [DOI] [PubMed] [Google Scholar]
- 25. Gramsbergen A (2007) Neural compensation after early lesions: a clinical view of animal experiments. Neurosci Biobehav Rev 31:1088–1094. [DOI] [PubMed] [Google Scholar]
- 26. Hadders‐Algra M (2007) Putative neural substrate of normal and abnormal general movements. Neurosci Biobehav Rev 31:1181–1190. [DOI] [PubMed] [Google Scholar]
- 27. Hadders‐Algra M (2008) Reduced variability in motor behaviour: an indicator of impaired cerebral connectivity? Early Hum Dev 84:787–789. [DOI] [PubMed] [Google Scholar]
- 28. Hellewell SC, Yan EB, Agyapomaa DA, Bye N, Morganti‐Kossmann MC (2010) Post‐traumatic hypoxia exacerbates brain tissue damage: analysis of axonal injury and glial responses. J Neurotrauma 27:1997–2010. [DOI] [PubMed] [Google Scholar]
- 29. Hoon AH, Stashinko EE, Nagae LM, Lin DDM, Keller J, Bastian A et al (2009) Sensory and motor deficits in children with cerebral palsy born preterm correlate with diffusion tensor imaging abnormalities in thalamocortical pathways. Dev Med Child Neurol 51:697–704. [DOI] [PMC free article] [PubMed] [Google Scholar]
- 30. Horst NK, Laubach M (2009) The role of rat dorsomedial prefrontal cortex in spatial working memory. Neuroscience 164:444–456. [DOI] [PMC free article] [PubMed] [Google Scholar]
- 31. Huang Z, Liu J, Cheung P, Chen C (2009) Long‐term cognitive impairment and myelination deficiency in a rat model of perinatal hypoxic‐ischemic brain injury. Brain Res 1301:100–109. [DOI] [PubMed] [Google Scholar]
- 32. Inder TE, Huppi PS, Warfield S, Kikinis R, Zientara GP, Barnes PD et al (1999) Periventricular white matter injury in the premature infant is followed by reduced cerebral cortical gray matter volume at term. Ann Neurol 46:755–760. [DOI] [PubMed] [Google Scholar]
- 33. Jiao Y, Zhang C, Yanagawa Y, Sun Q (2006) Major effects of sensory experiences on the neocortical inhibitory circuits. J Neurosci 26:8691–8701. [DOI] [PMC free article] [PubMed] [Google Scholar]
- 34. Kaindl AM, Favrais G, Gressens P (2009) Molecular mechanisms involved in injury to the preterm brain. J Child Neurol 24:1112–1118. [DOI] [PMC free article] [PubMed] [Google Scholar]
- 35. Kanold PO, Luhmann HJ (2010) The subplate and early cortical circuits. Annu Rev Neurosci 33:23–48. [DOI] [PubMed] [Google Scholar]
- 36. Lacroix L, White I, Feldon J (2002) Effect of excitotoxic lesions of rat medial prefrontal cortex on spatial memory. Behav Brain Res 133:69–81. [DOI] [PubMed] [Google Scholar]
- 37. Larroque B, Ancel P, Marret S, Marchand L, André M, Arnaud C, Pierrat V (2008) Neurodevelopmental disabilities and special care of 5‐year‐old children born before 33 weeks of gestation (the EPIPAGE study): a longitudinal cohort study. Lancet 371:813–820. [DOI] [PubMed] [Google Scholar]
- 38. Love S, Barber R, Srinivasan A, Wilcock GK (2000) Activation of caspase‐3 in permanent and transient brain ischaemia in man. Neuroreport 11:2495–2499. [DOI] [PubMed] [Google Scholar]
- 39. Lubics A, Reglődi D, Tamás A, Kiss P, Szalai M, Szalontay L, Lengvári I (2005) Neurological reflexes and early motor behavior in rats subjected to neonatal hypoxic–ischemic injury. Behav Brain Res 157:157–165. [DOI] [PubMed] [Google Scholar]
- 40. McQuillen PS, Ferriero DM (2005) Perinatal subplate neuron injury: implications for cortical development and plasticity. Brain Pathol 15:250–260. [DOI] [PMC free article] [PubMed] [Google Scholar]
- 41. McQuillen PS, Sheldon RA, Shatz CJ, Ferriero DM (2003) Selective vulnerability of subplate neurons after early neonatal hypoxia‐ischemia. J Neurosci 23:3308–3315. [DOI] [PMC free article] [PubMed] [Google Scholar]
- 42. Myers RE (1972) Two patterns of perinatal brain damage and their conditions of occurrence. Am J Obstet Gynecol 112:246–276. [DOI] [PubMed] [Google Scholar]
- 43. Oehmichen M, Theuerkauf I, Meissner C (1999) Is traumatic axonal injury (AI) associated with an early microglial activation? Application of a double‐labeling technique for simultaneous detection of microglia and AI. Acta Neuropathol 97:491–494. [DOI] [PubMed] [Google Scholar]
- 44. Oehmichen M, Meissner C, von Wurmb‐Schwark N, Schwark T (2003) Methodical approach to brain hypoxia/ischemia as a fundamental problem in forensic neuropathology. Leg Med (Tokyo) 5:190–201. [DOI] [PubMed] [Google Scholar]
- 45. Olivier P, Baud O, Evrard P, Gressens P, Verney C (2005) Prenatal ischemia and white matter damage in rats. J Neuropathol Exp Neurol 64:998–1006. [DOI] [PubMed] [Google Scholar]
- 46. Olivier P, Baud O, Bouslama M, Evrard P, Gressens P, Verney C (2007) Moderate growth restriction: deleterious and protective effects on white matter damage. Neurobiol Dis 26:253–263. [DOI] [PubMed] [Google Scholar]
- 47. Paban V, Chambon C, Jaffard M, Alescio‐Lautier B (2005) Behavioral effects of basal forebrain cholinergic lesions in young adult and aging rats. Behav Neurosci 119:933–945. [DOI] [PubMed] [Google Scholar]
- 48. Pansiot J, Loron G, Olivier P, Fontaine R, Charriaut‐Marlangue C, Mercier J et al (2010) Neuroprotective effect of inhaled nitric oxide on excitotoxic‐induced brain damage in neonatal rat. PLoS ONE 5:e10916. [DOI] [PMC free article] [PubMed] [Google Scholar]
- 49. Paxinos G, Watson C (1997) The Rat Brain in Stereotaxic Coordinates. Academic Press: Waltham, MA. [Google Scholar]
- 50. Quairiaux C, Sizonenko SV, Mégevand P, Michel CM, Kiss JZ (2010) Functional deficit and recovery of developing sensorimotor networks following neonatal hypoxic‐ischemic injury in the rat. Cereb Cortex 20:2080–2091. [DOI] [PubMed] [Google Scholar]
- 51. Restuccia D, Della G, Valeriani M, Leggio M, et Molinari M (2007) Cerebellar damage impairs detection of somatosensory input changes. A somatosensory mismatch‐negativity study. Brain 130:276–287. [DOI] [PubMed] [Google Scholar]
- 52. Robinson S (2005) Systemic prenatal insults disrupt telencephalon development: implications for potential interventions. Epilepsy Behav 7:345–363. [DOI] [PMC free article] [PubMed] [Google Scholar]
- 53. Robinson S, Petelenz K, Li Q, Cohen ML, DeChant A, Tabrizi N et al (2005) Developmental changes induced by graded prenatal systemic hypoxic–ischemic insults in rats. Neurobiol Dis 18:568–581. [DOI] [PubMed] [Google Scholar]
- 54. Row BW, Kheirandish L, Neville JJ, Gozal D (2002) Impaired spatial learning and hyperactivity in developing rats exposed to intermittent hypoxia. Pediatr Res 52:449–453. [DOI] [PubMed] [Google Scholar]
- 55. Schmahmann JD, Rosene DL, Pandya DN (2004) Ataxia after pontine stroke: insights from pontocerebellar fibers in monkey. Ann Neurol 55:585–589. [DOI] [PubMed] [Google Scholar]
- 56. Schneider M, Koch M (2007) The effect of chronic peripubertal cannabinoid treatment on deficient object recognition memory in rats after neonatal mPFC lesion. Eur Neuropsychopharmacol 17:180–186. [DOI] [PubMed] [Google Scholar]
- 57. Spittle AJ, Boyd RN, Inder TE, Doyle LW (2009) Predicting motor development in very preterm infants at 12 months' corrected age: the role of qualitative magnetic resonance imaging and general movements assessments. Pediatrics 123:512–517. [DOI] [PubMed] [Google Scholar]
- 58. Strata F, Coq JO, Byl N, Merzenich MM (2004) Effects of sensorimotor restriction and anoxia on gait and motor cortex organization: implications for a rodent model of cerebral palsy. Neuroscience 129:141–156. [DOI] [PubMed] [Google Scholar]
- 59. Suh SW, Aoyama K, Matsumori Y, Liu J, Swanson RA (2005) Pyruvate administered after severe hypoglycemia reduces neuronal death and cognitive impairment. Diabetes 54:1452–1458. [DOI] [PubMed] [Google Scholar]
- 60. Vannucci RC, Vannucci SJ (2005) Perinatal hypoxic‐ischemic brain damage: evolution of an animal model. Dev Neurosci 27:81–86. [DOI] [PubMed] [Google Scholar]
- 61. Volpe JJ (2009) Brain injury in premature infants: a complex amalgam of destructive and developmental disturbances. Lancet Neurol 8:110–124. [DOI] [PMC free article] [PubMed] [Google Scholar]
- 62. Vry J, Linder‐Lucht M, Berweck S, Bonati U, Hodapp M, Uhl M et al (2008) Altered cortical inhibitory function in children with spastic diplegia: a TMS study. Exp Brain Res 186:611–618. [DOI] [PubMed] [Google Scholar]
- 63. Wigglesworth JS (1964) Experimental growth retardation in the foetal rat. J Pathol Bacteriol 88:1–13. [PubMed] [Google Scholar]
- 64. Wingert JR, Burton H, Sinclair RJ, Brunstrom JE, Damiano DL (2008) Tactile sensory abilities in cerebral palsy: deficits in roughness and object discrimination. Dev Med Child Neurol 50:832–838. [DOI] [PMC free article] [PubMed] [Google Scholar]
- 65. Wingert JR, Burton H, Sinclair RJ, Brunstrom JE, Damiano DL (2009) Joint‐position sense and kinesthesia in cerebral palsy. Arch Phys Med Rehabil 90:447–453. [DOI] [PMC free article] [PubMed] [Google Scholar]
- 66. Wingert JR, Sinclair RJ, Dixit S, Damiano DL, Burton H (2010) Somatosensory‐evoked cortical activity in spastic diplegic cerebral palsy. Hum Brain Mapp 31:1772–1785. [DOI] [PMC free article] [PubMed] [Google Scholar]
- 67. Winstanley CA, Eagle DM, Robbins TW (2006) Behavioral models of impulsivity in relation to ADHD: translation between clinical and preclinical studies. Clin Psychol Rev 26:379–395. [DOI] [PMC free article] [PubMed] [Google Scholar]
- 68. Woodward LJ, Edgin JO, Thompson D, Inder TE (2005) Object working memory deficits predicted by early brain injury and development in the preterm infant. Brain 128:2578–2587. [DOI] [PubMed] [Google Scholar]
- 69. Xerri C, Bourgeon S, Coq JO (2005) Perceptual context‐dependent remodeling of the forepaw map in the SI cortex of rats trained on tactile discrimination. Behav Brain Res 162:207–221. [DOI] [PubMed] [Google Scholar]
Associated Data
This section collects any data citations, data availability statements, or supplementary materials included in this article.
Supplementary Materials
Figure S1. Quantitative analysis of corpus callosum thickness measured on coronal sections showing a decreased thickness in prenatal ischemia (PI) compared to sham adult rats (A). Quantitative analysis of myelin basic protein optical density measured in cingular white matter on coronal sections showing decreased myelin content in PI compared to sham adult rats (B,C). All data are reported as mean ± standard error. *P < 0.05; **P < 0.01 using Mann–Whitney U‐test.
Figure S2. Fluoro‐Jade staining (indicative of axonal degeneration) in brain coronal sections showing increased staining in white matter (WM) regions in prenatal ischemia rats (B,D,F) compared to sham (A,C,E) rats. Panels A and B show the cingular cortex white matter and the corpus callosum. Panels C and D show the hippocampus CA1 region, primary somatosensory cortex (S1) and underlying WM. Fluoro‐Jade stained neurons are also visible in the hippocampus and S1 cortex. Panels E,F. Entorhinal cortex and nearby WM of the external capsule (not labeled). Similar results were observed in n = 5/group. Scale bar = 50 µm.
Figure S3. Caspase 3 immunohistochemistry in brain coronal sections showing increased caspase 3 immunostaining, indicative of apoptosing cells, S1 and hippocampal regions but not M1, in prenatal ischemia (PI) rats (B,D,F,H) compared to sham (A,C,E,G) rats. Panels A and B show the primary somatosensory (S1) cortex. Inset in B shows higher power of a neuron from S1 that is immunopositive for caspase 3. Panels C,D. Primary motor (M1) cortices showing no caspase 3 staining in either panel. Panels E and F showing white matter regions below primary somatosensory cortex (S1). Panels G and H show the CA1 region of the hippocampus and show scattered cells with increased caspase 3 staining in the CA1 region of a PI rat (panel H) but not in a sham rat (panel G). Similar results were observed in n = 5/group. Scale bar = 50 µm.
Figure S4. NeuN immunohistochemistry in brain coronal section in S1 cortex (A,B) and prefrontal cortex (C,D) in sham and PI adult rats. Insets depict high magnification (×100) of cortical layer V neurons.
Table S1. Weight in grams of sham and prenatal ischemia (PI) rats at different postnatal days. The weight was averaged by group and by sex. The weight of PI rats was lower at P0 and P28 than in sham rats, while not at P90‐110. At P90‐110, the weight difference was only related to sex. The data are mean ± standard error of the mean.
Supporting info item
Supporting info item
Supporting info item
Supporting info item
Supporting info item
Supporting info item