

Abstract
Down syndrome DS is a genetic pathology characterized by brain hypotrophy and severe cognitive impairment. Although defective neurogenesis is an important determinant of mental disability, a severe dendritic pathology appears to be an equally important factor. A previous study showed that fluoxetine, a selective serotonin reuptake inhibitor, fully restores neurogenesis in the Ts65Dn mouse model of DS. The goal of the current study was to establish whether fluoxetine also restores dendritic development. In mice aged 45 days, treated with fluoxetine in the postnatal period P3–P15, we examined the dendritic arbor of the granule cells of the dentate gyrus (DG). The granule cells of trisomic mice had a severely hypotrophic dendritic arbor, fewer spines and a reduced innervation than euploid mice. Treatment with fluoxetine fully restored all these defects. In Ts65Dn mice, we found reduced levels of serotonin that were restored by treatment. Results show that a pharmacotherapy with fluoxetine is able to rescue not only the number of granule neurons but also their “quality” in terms of correct maturation and connectivity. These findings strongly suggest that fluoxetine may be a drug of choice for the improvement of the major defects in the DS brain and, possibly, of mental retardation.
Keywords: antidepressants, dendritic development, Down syndrome, hippocampus, neuropathology, spine density
Introduction
Down syndrome (DS; trisomy 21) is a genetic pathology with a prevalence of approximately 1/1000 newborns. DS results in a constellation of phenotypes, most of which may be inconsistent in their occurrence. Mental retardation, however, remains the invariable hallmark and the most invalidating aspect of DS, with a heavy impact on public health 28.
Mental retardation has been related to the decreased brain size of DS individuals, a feature that is already apparent early on in development. Accumulating evidence in DS mouse models clearly shows severe neurogenesis impairment in the major brain neurogenic regions [see 6], suggesting that defective neurogenesis may be a key determinant of brain hypotrophy and mental retardation. Similar to the Ts65Dn mouse model of DS, human fetuses with DS exhibit proliferation impairment in the hippocampal dentate gyrus (DG) and cerebellum 15, 21, 22, which further validates the use of this model to study trisomy‐linked brain alterations.
Dendritic pathology is a possible substrate for mental retardation in different conditions. In DS, the pathogenesis of dendritic abnormalities is distinctive and appears to correlate with the cognitive profile. In children and adults with DS, there is a marked reduction in dendritic branching and spine density 7, 34. Similar to individuals with DS, mouse models of DS have less branched and less spinous dendrites 8, 10. Although defective neurogenesis is very likely a crucial determinant of mental retardation, dendritic abnormalities with consequent connectivity alterations are likely to be equally important actors.
DS is associated with a loss of serotonin (5‐HT) 26 and dysregulation of the 5‐HT1A receptor expression 5, 11. In view of the pivotal role played by 5‐HT in neurogenesis and dendritic maturation 12, 38, dysregulation of the 5‐HT system may be the critical determinant of both neurogenesis impairment and dendritic pathology in DS.
Based on evidence that antidepressants increase hippocampal neurogenesis 25 and that fluoxetine, a selective serotonin reuptake inhibitor, increases neurogenesis in adult Ts65Dn mice 14, we previously treated neonate Ts65Dn mice with fluoxetine 11. Our study provided novel evidence that a widely used antidepressant, administered during the early phases of brain development, is able to fully restore neurogenesis and cognitive behavior. Several studies have shown that fluoxetine has a positive effect on dendritic maturation and spine formation in the normal brain 23, 36, suggesting that this drug may be exploited to correct the dendritic pathology of the DS brain.
Based on all these premises, we took advantage of the characteristics offered by the Ts65Dn mouse model to establish whether treatment with fluoxetine during the early postnatal period, a time window critical for dendritic maturation, rescues dendritic pathology and connectivity. We focused on the effects of pharmacotherapy on dendritic development in the hippocampal DG, a region that plays a crucial role in declarative memory.
Materials and Methods
Colony
Female Ts65Dn mice carrying a partial trisomy of chromosome 16 29 were obtained from Jackson Laboratories (Bar Harbour, ME, USA) and maintained on the original genetic background by mating them with C57BL/6JEi x C3SnHeSnJ (B6EiC3) F1 males. Animals were karyotyped using real‐time quantitative PCR (RT‐qPCR) as previously described 24. Genotyping was validated with fluorescent in situ hybridization (FISH) 33. The day of birth was designed as postnatal day (P) zero. A total of 99 mice were used. The animals' health and comfort were controlled by the veterinary service. The animals had access to water and food ad libitum and lived in a room with a 12:12 h dark/light cycle. Experiments were performed in accordance with the Italian and European Community law for the use of experimental animals and were approved by Bologna University Bioethical Committee. In this study, all efforts were made to minimize animal suffering and to keep the number of animals used to a minimum.
Experimental protocol
Euploid (n = 26) and Ts65Dn (n = 25) mice received a daily subcutaneous injection (at 09:00–10:00 h) of fluoxetine (Sigma‐Aldrich, St. Louis, MO, USA) in 0.9% NaCl solution from P3 to P15 (dose: 5 mg/kg from P3 to P7; 10 mg/kg from P8 to P15). We chose a maximum 10 mg/kg dose because, as a result of the extremely short half‐life of fluoxetine in rodents compared with humans, a daily 10 mg/kg dose is thought to produce a brain concentration of a magnitude similar to that of 20–60 mg taken daily by humans 13, 17. Age‐matched euploid (n = 27) and Ts65Dn (n = 24) mice were injected with the vehicle (Figure 1A). Each treatment group had approximately the same composition of males and females. On P45, animals were deeply anesthetized with ether and killed. A first group of animals (n = 8 for each experimental condition) was transcardially perfused with ice‐cold phosphate‐buffered saline (PBS) followed by a 4% solution of paraformaldehyde in PBS. Brains were stored in the fixative for 24 h, cut along the midline and placed in a 20% sucrose in phosphate buffer solution for an additional 24 h. Hemispheres were frozen and stored at −80°C. The left and right hemispheres were cut with a freezing microtome in 30‐μm‐thick coronal sections that were serially collected in antifreeze solution containing sodium azide. Sections from the right hemisphere were used for doublecortin (DCX) immunohistochemistry and sections from the left hemisphere were used for synaptophysin (SYN) and vesicular glutamate transporter 1 (VGLUT1) immunohistochemistry and for Down syndrome cell adhesion molecule (DSCAM) immunohistochemistry. A second group of animals (n = 6–9 for each experimental condition) was not perfused, the brain was quickly removed, cut along the midline, rinsed in PBS and Golgi stained, as described below. A third group of animals (n = 10 for each experimental condition) was not perfused, the brain was quickly removed, the hippocampal region of each hemisphere was dissected and kept at −80°C. The hippocampus of one side was used for either Western blotting (n = 5 for each experimental condition) or RT‐qPCR analysis (n = 5 for each experimental condition) and the hippocampus of the other side was used for analysis of serotonin levels (n = 5 for each experimental condition). Two additional groups of untreated animals aged 2 days (four euploid and five Ts65Dn mice) and 15 days (6 euploid and 5 Ts65Dn mice) were used to examine the expression of the 5‐HT1A receptor in the hippocampal region.
Figure 1.
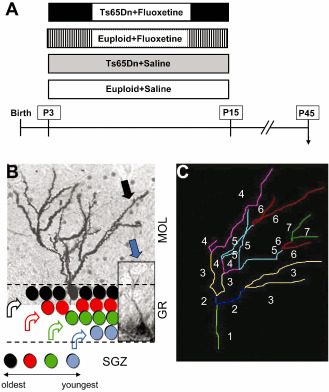
Experimental protocol. A. Starting from the age of 3 postnatal (P) days and up to P15, euploid and Ts65Dn mice received one daily injection of either saline or fluoxetine (see Materials and Methods). Animals were killed at P45, 1 month after cessation of treatment. B. New granule cells are generated from progenitor cells residing in the subgranular zone (SGZ). The oldest granule cells (black) occupy the outer portion of the granule cell layer (GR) and later born cells are added according to an outside‐inside pattern. The photomicrographs show a mature Golgi‐stained cell (black arrow) in the outermost portion of the GR and a young doublecortin (DCX)‐positive granule cell (blue arrow) in the innermost portion of the GR. The dendrites of the mature granule cells occupy the whole molecular layer (MOL) while those of the young granule cells reach only the innermost portion of this layer. C. Computerized reconstruction of granule cell dendrites. Dendrites were traced in a centrifugal direction. Numbers indicate the different dendritic orders (marked by the software with different colors).
Histological procedures
Golgi staining
Brains were Golgi stained using the FD Rapid Golgi StainTM Kit (FD NeuroTechnologies, Inc., Columbia, MD, USA). Brains were immersed in the impregnation solution containing mercuric chloride, potassium dichromate, and potassium chromate, and stored at room temperature in darkness for 3 weeks. Hemispheres were cut with a microtome in 90‐μm‐thick coronal sections that were mounted on gelatin‐coated slides and were air dried at room temperature in the dark for 1 day. After drying, sections were rinsed with distilled water and subsequently stained in a developing solution (FD Rapid Golgi Stain Kit).
DCX immunohistochemistry
One out of six free‐floating sections from the DG was processed for DCX immunohistochemistry. Sections were permeabilized with 0.1%Triton X‐100 in PBS for 30 minutes and subsequently endogenous peroxidase activity was inhibited using a methanol/H2O2 0.3% solution for 30 minutes. Sections were incubated overnight at 4°C with a primary antibody anti‐DCX (goat polyclonal, Santa Cruz Biotechnology, Santa Cruz, CA, USA) diluted 1:100. Sections were then incubated for 1 h at room temperature with a biotinylated anti‐goat IgG secondary antibody (dilution 1:200, Vector Laboratories Inc., Burlingame, CA, USA) and thereafter incubated for 1 h with VECTASTAIN® ABC kit (Vector Laboratories). Detection was performed using DAB kit (Vector Laboratories).
SYN, VGLUT1 and DSCAM immunohistochemistry
Free‐floating sections (n = 3–4 per animal) from the DG were submitted to double fluorescence immunohistochemistry for SYN and VGLUT1 or DSCAM immunohistochemistry. For SYN and VGLUT1 immunohistochemistry, sections were incubated for 48 h at 4°C with mouse monoclonal anti‐SYN (SY38) antibody (Millipore Bioscience Research Reagents, Merck Millipore, Billerica, MA, USA) and rabbit polyclonal anti‐VGLUT1 (Abcam, Cambridge, UK, Europe) antibody both diluted 1:1000. Sections were then incubated overnight at 4°C with a DyLight‐conjugated goat anti‐mouse IgG (Thermo Scientific, Rockford, IL, USA) and a RRX‐conjugated donkey anti‐rabbit IgG (Jackson Laboratory, Bar Harbor, ME, USA) both diluted 1:100. For DSCAM immunohistochemistry, sections were incubated overnight at 4°C with a primary antibody anti‐DSCAM (generous gift from Dr Maria Luz Montesinos) 2 diluted 1:50. Sections were then incubated for 1 h at room temperature with a CY3‐conjugated donkey anti‐rabbit (Jackson Laboratory) diluted 1:200.
Real‐time reverse transcriptase quantitative PCR (RT‐qPCR)
Total RNA was extracted from the hippocampus of the right hemisphere with TriReagent (Sigma‐Aldrich) according to the manufacturer's instructions. Complementary DNA (cDNA) synthesis was achieved with 1.0 μg of total RNA using the iScript cDNA synthesis kit (Bio‐Rad, Hercules, CA, USA) according to the manufacturer's instructions. The used primer sequences are as follows: (i) 5‐hydroxytryptamine (serotonin) receptor 1A (5‐HT1A) (NM_008308), forward 5′‐ACAGGGCGGTGGGGACTC‐3′ and reverse 5′‐CAAGCAGGCGGGGACATAGG‐3′; (ii) solute carrier family 6 (neurotransmitter transporter serotonin alias SERT) (NM_010484.2), forward 5′‐GATCCCTGCTCACACTGACATC‐3′ and reverse 5′‐ CCATAGAACCAAGACACGACGAC‐3′; and (iii) glyceraldehyde‐3‐phosphate dehydrogenase (GAPDH) (NM_008084.2), forward 5′‐GAACATCATCCCTGCATCCA‐3′ and reverse 5′‐CCAGTGAGCTTCCCGTTCA‐3′. Real‐time PCR was performed using a SYBR Premix Ex Taq kit (Takara, Shiga, Japan) according to the manufacturer's instructions in an iQ5 real‐time PCR detection system (Bio‐Rad). Fluorescence was determined at the last step of every cycle. Real‐time PCR assay was done under the following universal conditions: 2 minutes at 50°C, 10 minutes at 95°C, 50 cycles of denaturation at 95°C for 15 s, and annealing/extension at 60°C for 1 minute. Quantifications were normalized using endogenous control GAPDH. Relative quantification was performed using the ΔΔCt method.
High‐performance liquid chromatography (HPLC)
The left hippocampus was homogenized with ultrasonic cell disruptor in Acapulco buffer solution (methanol‐acetonitrile‐50 mM phosphate buffer, pH 2.8, 15:8:77, containing 200 mg/L of sodium dodecylsulphate). One volume of homogenate was diluted in 3 vol. of water and 50‐μL portions of clear supernatants were directly injected into a HPLC system, as previously described 19, 20. Protein levels in the sampled tissue were evaluated by Lowry method. The measured amounts of 5‐HT and 5‐hydroxyindoleacetic acid (HIAA) were expressed as pg/ng protein.
Western blotting
Total proteins from the hippocampal formation were obtained as previously described 35 and protein concentration was estimated by the Lowry method. Proteins (50 μg) were subjected to electrophoresis on a 4%–20% Mini‐PROTEAN® TGX™ Precast Gel (Bio‐Rad) and transferred to a Hybond ECL nitrocellulose membrane (Amersham Life Science, Arlington Heights, IL, USA). The following primary antibodies were used: anti‐SYN (1:1000, Millipore Bioscience Research Reagents); anti‐DSCAM (1:500, a gift from Dr Maria Luz Montesinos); and anti‐ GAPDH (1:5000, Sigma, St Louis, MO, USA) antibodies. Densitometric analysis of digitized images was performed with Scion Image software (Scion Corporation, Frederick, MD, USA), and intensity for each band was normalized to the intensity of the corresponding GAPDH band.
Measurements
Neuron sampling
Series of sections across the whole rostro‐caudal extent of the DG were used for reconstruction of DCX‐positive and Golgi‐stained neurons. DCX‐positive neurons were sampled in the inner part of the granule cell layer, close to the subgranular zone (see inset in Figures 1B and 4A–D). The Golgi method casually impregnates a few neurons among a given population and allows one to sample relatively isolated neurons. Golgi‐stained neurons were sampled from the outer part of the granule cell layer (Figure 1B). The total number of DCX‐positive sampled neurons was 29–52 per animal and the number of sampled Golgi‐stained neurons was 10–16 per animal. Only well‐impregnated neurons were chosen for the histological analysis. The drawings were made on coded slides so that the drawer was not aware of the animal's treatment.
Figure 4.
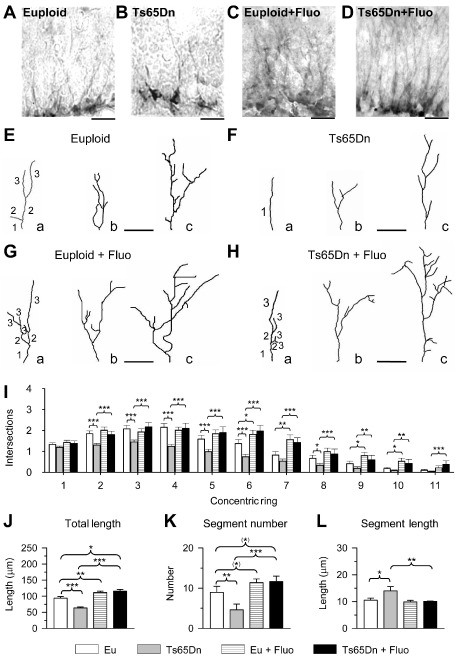
Effect of fluoxetine on the dendritic size of newborn granule cells. A–D. Photomicrographs of doublecortin (DCX) immunopositive granule cells in an animal from each of the following experimental groups: euploid (A), Ts65Dn (B), treated euploid (C) and treated Ts65Dn (D). E–H. Three examples (a–c) of the reconstructed dendritic tree of granule cells from animals of each of the following experimental groups: euploid (E), Ts65Dn (F), treated euploid (G) and treated Ts65Dn (H). Numbers indicate the different dendritic orders. Calibration in A–H: 20 μm. I–L. Mean number of dendritic intersections per ring (I; rings were 5 μm apart), mean total dendritic length (J), mean number of dendritic segments (K) and mean segment length (L) in untreated euploid and Ts65Dn mice, and euploid and Ts65Dn mice treated with fluoxetine. Values in I–L represent mean ± standard deviation (SD). (*) P < 0.06; *P < 0.05; **P < 0.01; ***P < 0.001 [Duncan's test after analysis of variance (anova)].
Measurement of the dendritic tree
The following systems were used: (i) light microscope (Leitz, Hexagon Metrology GmbH, Wetzlar, Germany, Europe) equipped with a motorized stage and focus control system; (ii) color digital video camera attached to the microscope; and (iii) Image Pro Plus (Media Cybernetics, Silver Spring, MD 20910, USA) with the StagePro module for controlling the motorized stage in the x, y and z directions, as primary software. Dendritic trees of DCX‐positive and Golgi‐stained granule cells of the DG were traced with a dedicated software, custom‐designed for dendritic reconstruction (Immagini Computer, Milan, Italy), interfaced with Image Pro Plus. The dendritic tree was traced live, at a final magnification of 500×, by focusing into the depth of the section. The operator starts with branches emerging from the cell soma and after having drawn the first parent branch goes on with all daughter branches of the next order in a centrifugal direction (Figure 1C). At the end of tracing, the program reconstructs the number and length of individual branches, the mean length of branches of each order, and total dendritic length. We additionally evaluated the number of dendritic intersections with concentric rings centered on the soma, according to Sholl's method 32. Rings were 10 μm apart for the oldest granule cells and 5 μm apart for the newborn granule cells.
Spine density
In Golgi‐stained sections, spines of granule cells were counted using a 100× oil immersion objective lens. Spine density values were obtained from dendritic segments in the inner and outer half of the molecular layer. For each neuron, three segments were analyzed in the outer and inner half of the molecular layer, respectively. For each animal, spines were counted in the same neuron population used for dendritic reconstruction. The length of each dendritic segment was determined by tracing the dendritic shaft and the number of spines was counted manually. The linear spine density was calculated by dividing the total number of spines by the length of the dendritic segment. Spine density was expressed as number of spines per 100‐μm dendrite.
Connectivity in the molecular layer of the DG
To study innervation of granule cell dendrites, intensity of SYN immunoreactivity (IR) in the molecular layer of the DG was determined by optical densitometry of immunohistochemically stained sections. Fluorescence images were captured using a Nikon Eclipse E600 microscope equipped with a Nikon Digital Camera DXM1200 ATI System (Nikon Instruments Inc., Melville, NY, USA). Densitometric analysis of SYN was carried out using the Nis‐Elements Software 3.21.03 (Nikon, Melville, NY, USA). A box of 490 μm2 was used and placed in the inner, middle and outer third of the molecular layer of the upper blade of the DG. Six measurements were taken for each region. For each image, the intensity threshold was estimated by analyzing the distribution of pixel intensities in the image areas that did not contain IR. This value was then subtracted to calculate IR of each sampled area.
Glutamatergic innervation of the molecular layer of the DG
Dual‐channel confocal microscopy was used to study co‐localization of SYN with VGLUT1. Sections were scanned with Nikon Ti‐E fluorescence microscope coupled with A1R confocal system (Nikon). The lasers were: Multi‐Ar (457/488/514) with exciting wavelengths for DyLight 488 and 561 diode‐pumped solid state laser (DPSS) with exciting wavelengths for RRX. The conditions for co‐localization analysis were: the objective was an oil immersion ×60 objective [numerical aperture (NA) 1.4]; laser power was kept low in order to avoid photobleaching; the zoom factor was 6; and software Nis‐Elements AR 3.2 was used and image size was 512 × 512 pixels. For each image, the intensity thresholds were estimated by analyzing the distribution of pixel intensities in the image areas that did not contain IR. This value, the background threshold, was then subtracted, and the green‐red co‐localization coefficient was calculated.
DSCAM levels in the molecular layer of the DG
Intensity of DSCAM IR in the molecular layer of the DG was determined by optical densitometry. Fluorescence images were captured using a Nikon Eclipse E600 microscope (see above). The optical density (OD) was evaluated in a box of 1600 μm2 randomly placed at six different sites in the molecular layer of the upper blade of the DG. The OD of the sampled regions was corrected by the background.
Statistical analysis
Results are presented as the mean ± standard deviation (SD) of the mean. Data from single animals were the unity of analysis. Statistical testing was performed with analysis of variance (anova) followed by post hoc comparisons with Duncan test. A probability level of P < 0.05 was considered to be statistically significant.
Results
Effect of fluoxetine on the dendritic tree of the oldest granule cell in euploid and Ts65Dn mice
Granule cells are derived from precursors in the subgranular zone of the DG that migrate from the place of birth to the overlying granule cell layer. In rats and mice, only 20% of the granule cells are born before birth and most of the remaining 80% are born in the first two postnatal weeks, with a peak at postnatal day 7 1, 3, 31. At variance with neurons forming the neocortex, granule cells migrate according to an “outside‐inside” pattern. Namely, the oldest neurons populate the outer part of the granule cell layer and the youngest populate the inner part (see Figure 1B). Dendritic maturation of the granule cells lasts approximately 50–60 days 30, 40. As we were interested in establishing the effect of fluoxetine on granule cells that underwent dendritic maturation during treatment (P3–P15) and accomplished it in the following 30 days (by P45), we examined Golgi‐stained granule neurons located in the outer portion of the granule cell layer (Figure 1B). We chose mature‐looking neurons to make sure that those which were oldest were sampled.
Figure 2A–H shows examples of granule cells in the four experimental groups. It can be noted that in Ts65Dn mice (Figure 2B,F) the dendritic tree of the granule cells was less developed than in euploid mice (Figure 2A,E). After treatment with fluoxetine, the dendritic pattern of Ts65Dn mice (Figure 2D,H) became similar to that of untreated euploid mice.
Figure 2.
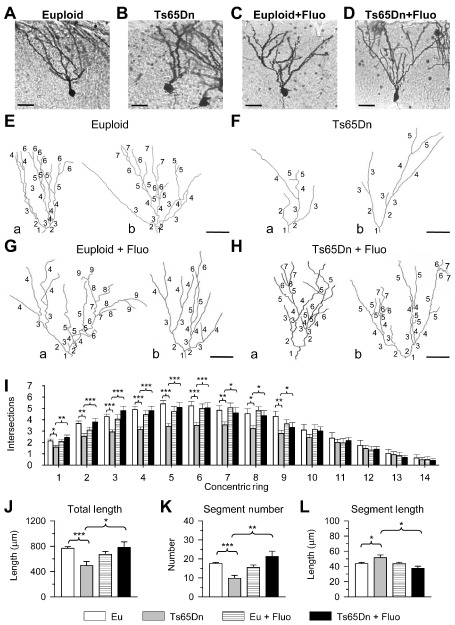
Effect of fluoxetine on the dendritic size of the oldest granule cells. A–D. Photomicrographs of Golgi‐stained granule cells in an animal from each of the following experimental groups: euploid (A), Ts65Dn (B), treated euploid (C) and treated Ts65Dn (D). E–H. Two examples (a and b) of the reconstructed dendritic tree of granule cells from animals of each of the following experimental groups: euploid (E), Ts65Dn (F), treated euploid (G) and treated Ts65Dn (H). Numbers indicate the different dendritic orders. Calibration in A–H: 40 μm. I–L. Mean number of dendritic intersections per ring (I; rings were 10 μm apart), mean total dendritic length (J), mean number of dendritic segments (K) and mean segment length (L) in untreated euploid and Ts65Dn mice, and euploid and Ts65Dn mice treated with fluoxetine. Values in I–L represent mean ± standard deviation (SD). *P < 0.05; **P < 0.01; ***P < 0.001 [Duncan's test after analysis of variance (anova)].
To quantify the overall effect of either genotype or treatment on the amount of dendritic material at different distances from the soma, we used Sholl's method. We found that Ts65Dn mice had fewer dendritic intersections on rings 1–9 (Figure 2I). While the number of dendritic intersections was not affected by treatment in euploid mice, it underwent a large increase in treated Ts65Dn mice on rings 1–9, and became similar to that of untreated euploid mice (Figure 2I). We next examined the total dendritic length, total number of segments and mean segment length. The latter was obtained by dividing the total dendritic length by the total number of branches. We found that Ts65Dn mice had a shorter dendritic length (−36%; Figure 2J) and a reduced number of segments (−45%; Figure 2K) than euploid mice. In contrast, the mean segment length was larger than in euploid mice (+17%; Figure 2L). While in euploid mice treatment with fluoxetine had no effect on dendritic length, number of segments and segment size (Figure 2J–L), in treated Ts65Dn mice the dendritic length (Figure 2J) and the number of segments (Figure 2K) underwent an increase and the mean segment length underwent a reduction (Figure 2L). All these parameters became similar to those of untreated euploid mice.
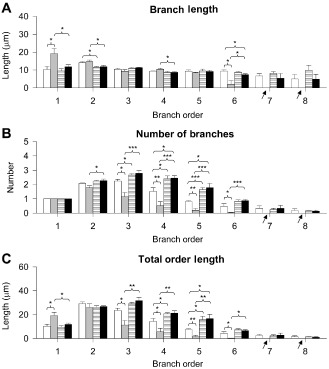
To dissect the effects of trisomy and treatment on details of the dendritic architecture, we examined each dendritic order separately. A striking difference between euploid and Ts65Dn mice was the absence of branches of higher order in the latter. While euploid mice had up to nine orders of branches, Ts65Dn mice completely lacked branches of orders 7–9 (Figure 3A–C arrows). Analysis of the branch length of individual orders showed no effects of either genotype or treatment on branches of orders 4–6. In contrast, branches of orders 1–3 were notably longer in untreated Ts65Dn vs. untreated euploid mice (Figure 3A). Analysis of the number of branches showed that untreated Ts65Dn mice had a similar number of branches of orders 1 and 2 as untreated euploid mice, fewer branches of orders 3–6 and, as noted above, no branches of order higher than 6 (see arrows in Figure 3B). In Ts65Dn mice, there was a progressive worsening in branch number reduction from order 3 to 6 (order 3: −13%, order 4: −56%, order 5: −70%, order 6: −91%). We evaluated the total dendritic surface offered by each order by multiplying the number of branches (Figure 3B) by the mean branch length (Figure 3A) of individual orders. In untreated Ts65Dn mice, the total length of orders 1, 2 and 3 was larger (+93%, +46% and +26% respectively) compared with the euploid counterparts (Figure 3C). This is in agreement with the greater branch length of these orders in Ts65Dn mice. In agreement with the reduced number of branches of orders 4–6, in Ts65Dn mice the total length of orders 4, 5 and 6 was reduced (−60%, −75% and −8% respectively) compared with that of euploid mice (Figure 3C).
Figure 3.
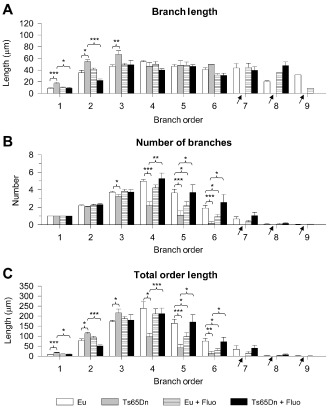
Effect of fluoxetine on dendritic architecture of the oldest granule cells. A–C. Quantification of the mean length (A) and mean number (B) of branches of the different orders and total length of each order (C) in untreated euploid and Ts65Dn mice, and euploid and Ts65Dn mice treated with fluoxetine. The arrows indicate the absence of branches in untreated Ts65Dn mice. Values in A–C represent mean ± standard deviation (SD). *P < 0.05; **P < 0.01; ***P < 0.001 [Duncan's test after analysis of variance (anova)].
A comparison between untreated and treated Ts65Dn mice showed that mice treated with fluoxetine underwent a reduction in the length of branches of orders 1–3 (Figure 3A) and an increase in the number of branches of orders 3–6, thus showing a pattern that became similar to that of untreated euploid mice. Importantly, treated Ts65Dn mice acquired branches of orders 6–8 and the number and length of these branches were similar to that of untreated euploid mice (Figure 3A,B). In agreement with these effects, the length of individual orders of treated Ts65Dn mice became similar to that of untreated euploid mice (Figure 3C).
A comparison between untreated and treated euploid mice showed that euploid mice treated with fluoxetine had fewer branches of orders 5 and 6 (−40% and −53% respectively; Figure 3B), with no change in the mean branch length (Figure 3A). In agreement with these effects, in treated euploid mice the total length of orders 5 and 6 was reduced (−40% and −62% respectively) compared with that of untreated euploid mice (Figure 3C).
Taken together, these results indicate a severe hypotrophy of the dendritic tree of the granule cells of Ts65Dn mice that is mainly due to a notably reduced number of branches of intermediate order and total lack of branches of higher order. Treatment with fluoxetine rescued total dendritic length by restoring the number of intermediate order branches and inducing the appearance de novo of higher order branches.
Effect of fluoxetine on the dendritic tree of newborn granule cells in euploid and Ts65Dn mice
DCX is a microtubule‐associated phosphoprotein selectively located in the periphery of the soma with a pattern that overlaps microtubule distribution 16. DCX is expressed widely in migrating neuroblasts and differentiating neurons. Dendritic morphology of newborn granule cells can be analyzed with immunohistochemistry for DCX, taking advantage of the expression of this protein in the cytoplasm of immature neurons during the period of neurite elongation (from 1 to 4 weeks after neuron birth). In view of the time course of DCX expression in the granule cells, DCX‐positive cells present in P45 animals are, necessarily, cells born after P15, that is, in the month that followed treatment. To establish the effect of genotype and treatment on dendritic development of granule cells born after cessation of treatment, we examined the dendritic morphology of DCX‐positive cells.
In agreement with the morphogenesis of the granule cell layer, DCX‐positive cells were located in the innermost portion of the layer, close to the hilus (Figure 1B). In view of their young age, these cells exhibited a dendritic tree with an immature pattern, characterized by a relatively low number of short processes that reached the inner but not the outer part of the molecular layer (Figure 4A–D). Figure 4E shows that DCX‐positive cells exhibited a range of morphologies, with branches of low orders only (Figure 4E, neuron “a”), branches of low and intermediate order (Figure 4E, neuron “b”) and branches of low, intermediate and high order (Figure 4E, neuron “c”). Figure 4F shows that in untreated Ts65Dn mice, DCX‐positive cells of each category had fewer processes than in their euploid counterparts. For instance, while in euploid mice most neurons of category “a” had branches of order 2 or 3, in untreated Ts65Dn mice there were numerous cells of category “a” with only a single process. Observation of the neurons reported in Figure 4A–H shows that treatment with fluoxetine increased the number of branches in neurons of each category both in euploid (Figure 4C,G) and Ts65Dn (Figure 4D,H) mice.
Sholl's analysis of DCX‐positive cells showed that Ts65Dn mice had fewer dendritic intersections on rings 2–8 (Figure 4I). After treatment with fluoxetine, there was a large increase in the number of intersections that spanned from ring 2 up to ring 11 and the number of intersections on all rings became similar to that of untreated euploid mice (Figure 4I). In euploid mice, treatment caused an increase in the number of dendritic intersections on rings 6, 7, 9 and 10 (Figure 4I). Quantification of the dendritic size showed that Ts65Dn mice had a shorter dendritic length (−32%; Figure 4J) and a reduced number of segments (−48%; Figure 4K) than euploid mice. In contrast, the mean segment length was greater in Ts65Dn than in euploid mice (+33%; Figure 4L). In euploid mice, treatment with fluoxetine slightly increased the total dendritic length (+20%), with no change in segment size and with a marginally significant increase in the number of segments (Figure 4J–L). Importantly, in treated Ts65Dn mice the dendritic length (Figure 4J) and the number of segments (Figure 4K) underwent a notable increase (+85% and +152% respectively), while the mean segment length underwent a reduction (−28%; Figure 4L). A comparison between untreated euploid mice and Ts65Dn mice treated with fluoxetine showed that trisomic mice had more segments (although this effect was only marginally significant) (Figure 4K) and a greater total dendritic length (+30%; Figure 4J), indicating that not only was dendritic size restored by treatment but it became even greater than that of euploid mice.
Similar to the oldest granule cells, newborn granule cells of Ts6Dn mice had no high‐order dendritic branches and, while in euploid mice DCX‐positive cells had up to eight orders of branches, in Ts65Dn mice they had no branches of orders 7 and 8 (Figure 5A–C arrows). Analysis of branch length of the individual orders showed that branches of order 1 were notably longer (+86%) in untreated Ts65Dn compared with untreated euploid mice, and that the remaining orders of Ts65Dn mice had branches with a similar length to those of euploid mice, except for order 6 branches, which were shorter (−80%; Figure 5A). Analysis of branch number showed that untreated Ts65Dn mice had a similar number of branches of orders 1 and 2 as untreated euploid mice, but fewer branches of orders 3–6 and no branches of orders 7 and 8 (Figure 5B). In Ts65Dn mice, there was a progressive worsening in branch number reduction from order 3 to 6 (order 3: −49%, order 4: −66%, order 5: −76%, order 6: −99%). Evaluation of the total dendritic surface offered by each order showed that in untreated Ts65Dn mice, the dendritic length of order 1 was greater (+86%) than in the euploid counterparts (Figure 5C). This is in agreement with the greater length of branch 1. Consistent with the reduced number of branches of orders 3–6, in Ts65Dn mice the dendritic length of orders 3, 4, 5 and 6 was smaller (−52%, −62%, −78% and −99% respectively) than that of euploid mice (Figure 5C).
Figure 5.
Effect of fluoxetine on the dendritic architecture of newborn granule cells. A–C. Quantification of the mean length (A) and mean number (B) of branches of the different orders and total length of each order (C) in untreated euploid and Ts65Dn mice, and euploid and Ts65Dn mice treated with fluoxetine. The arrows indicate the absence of branches in untreated Ts65Dn mice. Values in A–C represent mean ± standard deviation (SD). *P < 0.05; **P < 0.01; ***P < 0.001 [Duncan's test after analysis of variance (anova)].
A comparison between untreated and treated Ts65Dn mice showed that mice treated with fluoxetine underwent a reduction in the length of branches of orders 1, 2 and 4 (−39%, −19% and −17% respectively) which became similar to those of untreated euploid mice and an increase (+260%) in the length of branches of order 6 (Figure 5A). Importantly, treated Ts65Dn mice acquired branches of orders 7 and 8 (Figure 5B) and the length of these branches was similar to that of untreated euploid mice (Figure 5A). In parallel with these effects, in treated Ts65Dn mice there was an increase in the number of branches of orders 2–6 (Figure 5B). The number of branches became similar to (branches of orders 2, 3, 6–8) or even larger than (branches of orders 4 and 5) the number of branches seen in untreated euploid mice (Figure 5B). In agreement with these effects, the length of individual orders of treated Ts65Dn mice became similar to or even larger (order 5) than that of untreated euploid mice (Figure 5C).
A comparison between untreated and treated euploid mice showed that euploid mice treated with fluoxetine underwent a small (−18%) reduction in the length of branches of order 2 (Figure 5A). They also showed an increase in the number of branches of orders 3, 4 and 5 (+19%, +59% and +100% respectively; Figure 5B) and in the total length of orders 4 and 5 (+46% and +100% respectively; Figure 5C) vs. untreated euploid mice.
Taken together, these data indicate that in Ts65Dn mice the dendritic tree of the granule cells is hypotrophic starting from the early phases of maturation of newborn cells, and that this effect is mainly due to a reduction in the number of branches of intermediate order and a lack of branches of higher order. Treatment with fluoxetine rescued total dendritic length by restoring the number of branches of intermediate order and inducing the appearance de novo of higher‐order branches. Not only did fluoxetine fully restore this defect but made the total dendritic length larger than that of untreated euploid mice.
The overall effects of genotype and treatment on the dendritic architecture of the oldest and newborn granule cells are summarized in the dendrograms of Figure 6.
Figure 6.
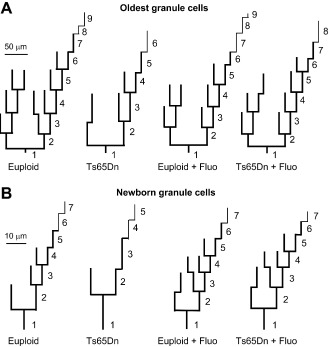
Dendrograms of the oldest and newborn granule cells. The dendrograms of the oldest (A) and newborn (B) granule cells were obtained from the mean length and mean number of branches of each order reported in Figures 3 and 5. The number of branches was approximated to the nearest integer value (thick lines). Thin lines have been used to indicate a number of branches ranging from 0.1 to 0.5. Note the difference in length scales for the oldest and newborn granule cells.
Effect of fluoxetine on granule cell spine density in euploid and Ts65Dn mice
Neurons receive their excitatory inputs through dendritic spines. Evidence in two mouse models of DS shows a spine density reduction along the dendritic tree of the granule cells 8, 9. To establish whether fluoxetine rescues this defect, we examined spine density in untreated and treated mice. Figure 7A–D shows that in untreated Ts65Dn mice the dendrites of the granule cells had fewer spines (Figure 7B) compared with euploid mice (Figure 7A) and that treatment increased spine number (Figure 7D).
Figure 7.
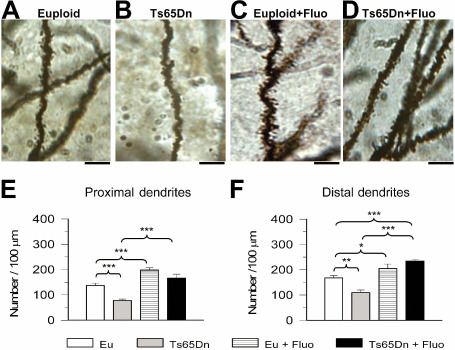
Effect of fluoxetine on spine density in the oldest granule cells. A–D. Photomicrograph of Golgi‐stained granule cells showing distal dendritic branches in an animal from each of the following experimental groups: euploid (A), Ts65Dn (B), treated euploid (C) and treated Ts65Dn (D). Calibration: 10 μm. E,F. Spine density in the proximal (E) and distal (F) dendritic branches of untreated euploid and Ts65Dn mice, and euploid and Ts65Dn mice treated with fluoxetine. Values represent mean ± standard deviation (SD). *P < 0.05; **P < 0.01; ***P < 0.001 [Duncan's test after analysis of variance (anova)].
Quantification of spine density showed that in untreated Ts65Dn mice, spine density was notably lower than that of untreated euploid mice, both at the level of the inner (−43%; Figure 7E) and outer (−35%; Figure 7F) portions of the molecular layer. After treatment with fluoxetine, Ts65Dn mice underwent a notable increase in spine density that became similar to that of untreated euploid mice in the inner half of the molecular layer (Figure 7E), and became even larger compared with euploid mice in the outer half (Figure 7F). In treated euploid mice, spine density increased compared with that of untreated mice, both in the inner half (+44%; Figure 7E) and outer half (+22%; Figure 7F) of the molecular layer.
Effect of fluoxetine on hippocampal SYN levels in euploid and Ts65Dn mice
It is likely that a reduction in connectivity is the counterpart of the severe dendritic hypotrophy that characterizes the granule cells of Ts65D mice. SYN (also known as p38) is a synaptic vesicle glycoprotein that is a specific marker of presynaptic terminals. Evaluation of SYN levels in the hippocampal formation (DG plus hippocampus proper) by Western blot analysis showed that Ts65Dn mice had reduced SYN levels and that treatment restored SYN levels (Figure 8A,B). SYN levels also increased in treated euploid mice and became higher than in untreated euploid mice (Figure 8A,B). Next, we examined SYN IR in order to obtain specific information on SYN levels in the molecular layer of the DG. Figure 8C shows representative images from animals of each group. It can be readily appreciated that IR for SYN was reduced in Ts65Dn mice compared with untreated euploid mice and that it was increased by treatment with fluoxetine. Quantitative analysis showed that in untreated Ts65Dn mice, the OD of SYN was significantly lower than in untreated euploid mice in the middle (−35%) and outer (−48%) molecular layers. A marginally significant reduction was present also in the inner molecular layer (Figure 8D). In Ts65Dn mice treated with fluoxetine, the OD of SYN underwent a large increase in all zones of the molecular layer and became even greater than that found in untreated euploid mice (Figure 8D). An increase in the OD of SYN also took place in treated euploid mice in all zones of the molecular layer (Figure 8D).
Figure 8.
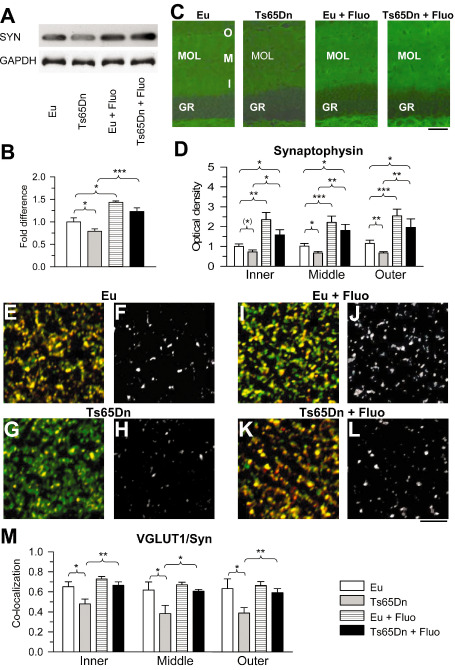
Effect of fluoxetine on connectivity in the molecular layer. A,B. Western blot analysis of synaptophysin levels in the hippocampal formation of untreated and treated mice. Western immunoblots in (A) are examples from animals of each experimental group. Histograms in (B) show synaptophysin levels normalized to glyceraldehyde‐3‐phosphate dehydrogenase (GAPDH) and expressed as fold difference in comparison to untreated euploid mice. C. Images of sections processed for synaptophysin immunofluorescence from the dentate gyrus (DG) of an animal from each experimental group. Calibration: 50 μm. D. Optical density of synaptophysin immunoreactivity in the inner, middle and outer third of the molecular layer of untreated and treated euploid and Ts65Dn mice. Data are given as fold difference vs. inner molecular layer of untreated euploid mice. E–L. Images of sections processed for double‐labeling immunofluorescence with an anti‐synaptophysin antibody (green) and an anti‐vesicular glutamate transporter 1 (VGLUT1) antibody (red) from the outer molecular layer of the DG of an animal from each of the following experimental groups: euploid (E,F), Ts65Dn (G,H), treated euploid (I,J) and treated Ts65Dn (K,L). Images in F, H, J, L represent co‐localization (white) between synaptophysin (SYN) and VGLUT1. Calibration: 5 μm (applies to E–L). M. Coefficient of co‐localization of SYN and VGLUT1 in the inner, middle and outer third of the molecular layer of untreated and treated euploid and Ts65Dn mice. Values in B, D and M represent mean ± standard deviation (SD). (*) P < 0.06; *P < 0.05; **P < 0.01; ***P < 0.001 [Duncan's test after analysis of variance (anova)].
Effect of fluoxetine on the glutamatergic innervation of the granule cells in euploid and Ts65Dn mice
Perforant path fibers, which take their origin from the entorhinal cortex and use glutamate as a neurotransmitter, innervate the middle and outer third of the molecular layer 3. In view of the key role of this input in hippocampus‐dependent memory functions, we examined the effects of trisomy and treatment on glutamatergic terminals in the DG. To this purpose, we evaluated the co‐localization of SYN and the VGLUT1 in the outer and middle third of the molecular layer. We additionally examined the inner third, which mainly contains glutamatergic terminals of the mossy cells 3. We found that co‐localization of SYN and VGLUT1 was reduced in untreated Ts65Dn as compared with euploid mice in the inner, middle and outer third of the molecular layer (Figure 8E–M), indicating a generalized reduction of excitatory afferents. Importantly, in treated Ts65Dn mice, co‐localization of SYN and VGLUT1 increased in all zones of the molecular layer and became similar to that of untreated euploid mice (Figure 8E–M), suggesting restoration of the glutamatergic inputs. In euploid mice, treatment had no effect on co‐localization of SYN and VGLUT1.
Effect of fluoxetine on the hippocampal serotonergic system in euploid and Ts65Dn mice
A profuse network of serotonin (5‐HT) containing axons originating from the dorsal and medial raphe nuclei innervates the hippocampus and DG 4. In a previous study, we found that Ts65Dn mice aged 15 days had no differences in serotonin levels but reduced levels of the 5‐HT1A receptor 11.
Quantification of 5‐HT by HPLC in the hippocampal region (hippocampus plus DG) of treated and untreated P45 mice showed that Ts65Dn mice had a lower 5‐HT concentration (Figure 9A), and a lower concentration of the 5‐HT metabolite 5‐HIAA (Figure 9B) than euploid mice. However, there was a similar expression of the serotonin transporter (SERT) (Figure 9C). After treatment with fluoxetine, the levels of 5‐HT and 5‐HIAA underwent an increase and became similar to those of euploid mice (Figure 9A,B), with no changes in the expression of SERT (Figure 9C). Taken together these data suggest impairment of the serotonergic input to the DG in Ts65Dn mice that can be restored by treatment. This is in agreement with the overall connectivity increase found in the DG of treated trisomic mice (Figure 8A–E).
Figure 9.
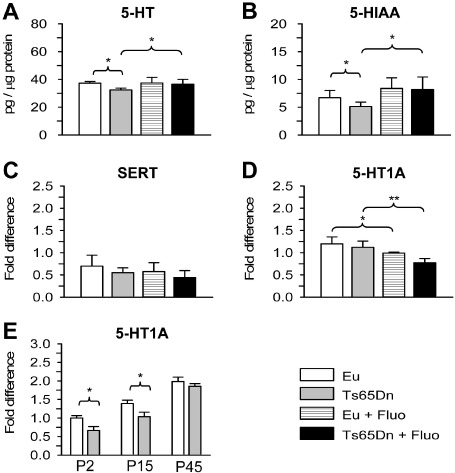
Effect of fluoxetine on serotonin levels and serotonin receptor expression in the hippocampal formation. A,B. Levels of serotonin (5‐HT) (A) and of the serotonin metabolite hydroxy indolic acid (5‐HIAA) (B) measured with high‐performance liquid chromatography (HPLC) in the hippocampal formation of P45 untreated euploid and Ts65Dn mice and P45 euploid and Ts65Dn mice treated with fluoxetine. Values represent mean ± standard deviation (SD). C–E. RNA expression levels quantified by real‐time quantitative PCR (RT‐qPCR) of the serotonin transporter (SERT) (C), 5‐HT1A receptor (D) in the hippocampal formation of P45 untreated and treated euploid and Ts65Dn mice, and in the hippocampal formation of untreated euploid and Ts65Dn mice at P2, P15 and P45 (E). Data are expressed as fold difference in comparison with untreated P45 euploid mice (C, D) or compared with P2 euploid mice (E). Data of P45 mice in E are the same as those in D. Values represent the mean ± standard deviation (SD). *P < 0.05; **P < 0.01 [Duncan's test after analysis of variance (anova)].
At P45, unlike P15 11, the hippocampal expression of the 5‐HT1A receptor was similar in Ts65Dn and euploid mice (Figure 9D). After treatment with fluoxetine, both Ts65Dn and euploid mice exhibited a reduction in the expression of the 5‐HT1A receptor compared with their untreated counterparts (Figure 9D). This may represent a compensatory mechanism caused by the increased bioavailability of serotonin induced by treatment. In view of the role of the 5‐HT1A receptor in neurogenesis and dendritic development 12, 18, 38, we compared its expression in euploid and Ts65Dn mice at three different ages. We found that both in euploid and Ts65Dn mice the expression of the 5‐HT1A receptor increased with age (Figure 9E). Importantly, its expression was lower in Ts65Dn mice compared with the euploid counterparts at P2 and P15, but not at P45. This indicates failure of the 5‐HT1A receptor in a period (P2–P15) that is critical for two fundamental processes: neurogenesis and dendritogenesis.
Effect of fluoxetine on DSCAM levels in the DG
The mechanisms underlying dendritic pathology in DS have not been elucidated and there is no clear evidence as to the role played by triplicated genes in the DS aberrant dendritic phenotype. DSCAM is a triplicated gene of HSA21. Over‐expression in hippocampal neurons of DSCAM dramatically inhibits dendritic branching, strongly suggesting that DSCAM over‐expression may be a determinant of the dendritic pathology in DS 2. DSCAM mRNA has been shown to be localized to dendrites where it is translated 2. Dendritic levels of DSCAM protein are regulated by synaptic activity at the NMDA receptor (NMDAR). In particular, activation of this receptor increases DSCAM levels. Evaluation of DSCAM levels in the hippocampal formation by Western blot analysis showed that Ts65Dn mice had higher DSCAM levels than untreated euploid mice (Figure 10A,B). After treatment with fluoxetine, Ts65Dn mice underwent a reduction in DSCAM levels that became similar to those of untreated euploid mice (Figure 10A,B). In sections immunostained for DSCAM, we quantified DSCAM IR in the DG. We found that untreated Ts65Dn mice, similar to Ts1Cej mice 2, had higher levels of DSCAM than euploid mice (Figure 10C–G). In the DG of Ts65Dn mice treated with fluoxetine, DSCAM levels became similar to those of untreated euploid mice (Figure 10C–G), suggesting that this reduction may underlie the recovery of granule cell dendritic architecture.
Figure 10.
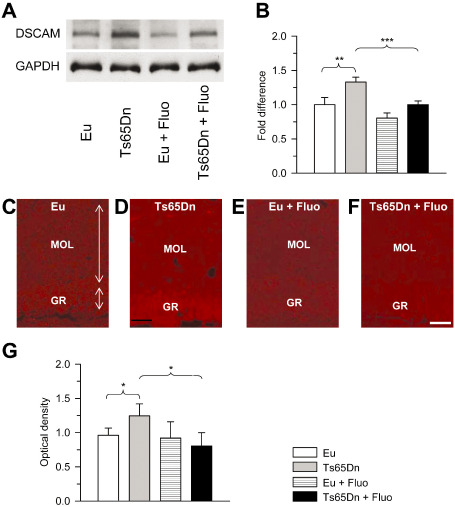
Effect of fluoxetine on Down syndrome cell adhesion molecule (DSCAM) immunoreactivity in the dentate gyrus. A,B. Western blot analysis of DSCAM levels in the hippocampal formation of untreated and treated mice. Western immunoblots in (A) are examples from animals of each experimental group. Histograms in (B) show DSCAM levels normalized to glyceraldehyde‐3‐phosphate dehydrogenase (GAPDH) and expressed as fold difference in comparison to untreated euploid mice. C–F. Images of sections processed for DSCAM immunoreactivity from the dentate gyrus (DG) of an animal from each of the following experimental groups: euploid (C), Ts65Dn (D), treated euploid (E) and treated Ts65Dn (F). Calibration: 50 μm (applies to C–F). G. Optical density of DSCAM immunoreactivity in the molecular layer of untreated and treated euploid and Ts65Dn mice. Data are given as fold difference vs. untreated euploid mice. Values in E represent mean ± standard deviation (SD). *P < 0.05; **P < 0.01; ***P < 0.001 [Duncan's test after analysis of variance (anova)].
Discussion
The current study provides novel evidence that pharmacotherapy with fluoxetine in the early postnatal period fully rescues dendritic pathology and connectivity in the hippocampal DG of the Ts65Dn mouse model of DS.
Fluoxetine rescues the aberrant dendritic phenotype of trisomic granule cells
In Ts65Dn mice, newborn granule cells had abnormally long branches of low order and very few branches of higher order (Figure 6B). The dendritic arbor of the oldest granule cells closely recapitulated these proximodistal defects (Figure 6A). This indicates that dendritic hypotrophy starts at the initial stages of granule cell development and is retained at later stages. The dendritic architecture of the newborn and oldest granule cells of Ts65Dn mice treated with fluoxetine underwent impressive changes. The exaggerated length of low‐order branches was restored; there was an increase in the number of branches of intermediate order and the de novo appearance of highest‐order branches. Because of these readjustments, the total length of the dendritic tree (Figures 2J and 4J) and its architecture (Figure 6A,B) were fully restored.
Fluoxetine rescues connectivity of trisomic granule cells
SYN immunohistochemistry revealed an overall reduction of the inputs to the molecular layer in trisomic mice (Figure 8D). Treatment with fluoxetine induced an increase in SYN IR throughout the molecular layer. Although it cannot be ruled out that an increase in SYN expression may be due to increased levels of the protein contained in individual synapses, the increase in the number of dendritic spines in treated trisomic mice is consistent with a treatment‐induced increase in the overall connectivity of the molecular layer. VGLUT1 immunohistochemistry showed that in trisomic mice the glutamatergic input to the molecular layer was reduced, which is consistent with the paucity of dendrites and spines of trisomic granule cells. Consistent with restoration of the dendritic arbor, treated trisomic mice underwent an increase in the glutamatergic input. Perforant path fibers convey signals from the entorhinal cortex to the granule cells 3 and the hippocampal processing of these signals is essential for long‐term declarative memory. Current results suggest that reduction of the glutamatergic input from the entorhinal cortex may be a key determinant of memory impairment in trisomic mice. It is likely that recovery of this input contributes to the rescue of hippocampus‐dependent memory performance previously observed in trisomic mice treated with fluoxetine 11.
In untreated trisomic mice, there were reduced hippocampal levels of serotonin (Figure 9A,B). In a study of euploid and Ts65Dn mice by Megias et al 27, no differences in the cellularity of the dorsal and medial raphe nuclei (the source of the serotonergic input to the forebrain) were detected. In view of the reduced dendritic surface of trisomic granule cells, it is likely that the reduced serotonin levels in trisomic mice are the result of a reduction in the number of serotonergic terminals. The finding that in treated trisomic mice serotonin levels became similar to those in euploid mice suggests recovery of the serotonergic input. As discussed below, this may be fundamental for the long‐term rescue of dendritic pathology.
Restoration of granule cell dendritic development parallels restoration of the serotonergic system
The dendritic branching pattern of trisomic DCX‐positive cells was rescued by fluoxetine (Figures 4 and 5). This indicates a positive impact of treatment on neurons born after the end of treatment. The time course of granule cell development 40 implies that the cells we sampled in the outer granule cell layer of mice aged 45 days were exposed to treatment during the early period of their dendritic maturation. The full dendritic recovery of these cells in treated trisomic mice shows that a relatively short period of treatment (13 days) was sufficient to rescue dendritic development, and that this effect was retained for up to 1 month after treatment cessation.
Serotonin is fundamental for granule cell dendritic development through the 5‐HT1A receptor, and the first 2 postnatal weeks represent a critical time window for serotonin action 37, 38. We previously found that in P15 trisomic mice, the serotonergic system was impaired because of reduced expression of the 5‐HT1A receptor, but with normal levels of serotonin 11. We found here that the expression of the 5‐HT1A receptor, which was reduced at P2 and P15, recovered by P45. In P45 trisomic mice, however, the serotonergic system was impaired because of a reduced serotonin level.
The reduced expression of the 5HT1A receptor at P2 and P15, a time when most of the granule cells are beginning maturation, is likely to aversively affect dendritic growth, in spite of normal serotonin levels. The outcome of a reduced dendritic growth is a reduction in the number of synaptic contacts established by afferent systems to the granule cells, including the serotonergic system. A reduction in the serotonergic input causes, in turn, a reduction in serotonin levels and, hence, further impairs dendritic development. Thus, for different reasons, the serotonergic system appears to be altered across critical phases of granule cell formation and maturation. The system begins to be deranged because of a low expression of the 5‐HT1A receptor. This defect leads to a negative process that reinforces itself with time: the fewer the dendrites, the fewer the serotonergic synaptic contacts, and so on.
Treatment with fluoxetine in the P3–P15 period restored the expression of the 5‐HT1A receptor in P15 trisomic mice 11 and, as found here, restored serotonin levels in P45 mice. By the same line of reasoning used above, normalization of the 5‐HT1A receptor at P15 may be fundamental in order to trigger proper dendritic development during the early phases of granule cell maturation and to prevent the entry in the vicious cycle mentioned above. Namely, early normalization of the dendritic material may favor the establishment of a proper number of synaptic contacts with serotonergic terminals. Correct serotonin levels will further favor dendritic growth and, consequently, create a milieu, which is favorable for the dendritic formation of granule cells born after treatment cessation.
Fluoxetine normalizes DSCAM levels in the DG of Ts65Dn mice
The abnormally long low‐order dendritic branches and the scanty number of higher‐order branches in trisomic granule cells suggest that dendritic hypotrophy is due to the failure of the mechanism/s that trigger dendritic branching. We found over‐expression of DSCAM IR in the DG of trisomic mice and that fluoxetine restored DSCAM levels. This suggests that the dendritic hypotrophy of the trisomic brain is underpinned by DSCAM over‐expression and that fluoxetine rescues this defect by reducing DSCAM levels. DSCAM mRNA is translated at dendritic level through an NMDA‐dependent mechanism. NMDAR activation increases dendritic levels of DSCAM protein, while NMDAR inhibition has an opposite effect 2. Interestingly, serotonin appears to suppress NMDAR function by activating the 5‐HT1A receptor 39. This provides a potential mechanism whereby fluoxetine restores dendritic development in trisomic mice. The impairment of the serotonergic system in trisomic mice (see above) implies a reduced suppression of NMDAR function, which, in turn, may lead to high levels of DSCAM protein. Increased serotonin availability, following treatment with fluoxetine, may reduce NMDAR function, which, in turn, may reduce DSCAM protein levels, thereby restoring dendritic branching.
Fluoxetine has moderate or no effects in euploid mice
In euploid mice, fluoxetine caused an increase in SYN levels similar to trisomic mice. Treatment, however, had smaller effects on dendritic length and spine density than in trisomic mice. The oldest granule cells of euploid mice even underwent a reduction in the number of some branches. Likewise, no effects of fluoxetine were observed on serotonin and DSCAM levels. It is possible that a relatively short period of treatment, such as the one used here, has large effects on brain plasticity under aversive brain conditions but weaker effects in the normal brain. The idea that the impact of fluoxetine on normal animals may have relatively scarce advantages, or even disadvantages, is strengthened by the observation that in euploid but not in trisomic mice treatment with fluoxetine caused a reduction in brain weight and no improvement in memory performance 11.
Fluoxetine corrects the two major defects of the trisomic brain
Neuron generation and dendritic maturation are heavily compromised in DS. Thus, therapies to improve brain development should be aimed at restoring both of these processes. We previously found that neonatal treatment with fluoxetine fully restores hippocampal neurogenesis and memory performance in trisomic mice 11. Current results show that fluoxetine restores dendritic architecture and spine density of trisomic granule cells, indicating that the same treatment is able to restore not only the number of granule neurons but also their “quality” in terms of correct maturation and connectivity. These findings strongly suggest that fluoxetine, a widely used antidepressant, may be a drug of choice for the improvement of mental retardation in DS and may open the way for future clinical trials in children and adolescents with DS.
Acknowledgments
This work was supported by a grant from the Fondation Jerome Lejeune to R. B.
References
- 1. Altman J, Bayer S (1975) Postnatal development of the hippocampal dentate gyrus under normal and experimental conditions. In: The Hippocampus, Vol. 1. Isaacson RL, Pribram KH (eds), pp. 95–122. Plenum Press: New York and London. [Google Scholar]
- 2. Alves‐Sampaio A, Troca‐Marin JA, Montesinos ML (2010) NMDA‐mediated regulation of DSCAM dendritic local translation is lost in a mouse model of Down's syndrome. J Neurosci 30:13537–13548. [DOI] [PMC free article] [PubMed] [Google Scholar]
- 3. Amaral DG, Witter MP (1995) Hippocampal formation. In: The Rat Nervous System, Paxinos G (ed.), pp. 443–492. Academic Press: San Diego, CA. [Google Scholar]
- 4. Banasr M, Hery M, Printemps R, Daszuta A (2004) Serotonin‐induced increases in adult cell proliferation and neurogenesis are mediated through different and common 5‐HT receptor subtypes in the dentate gyrus and the subventricular zone. Neuropsychopharmacology 29:450–460. [DOI] [PubMed] [Google Scholar]
- 5. Bar‐Peled O, Gross‐Isseroff R, Ben‐Hur H, Hoskins I, Groner Y, Biegon A (1991) Fetal human brain exhibits a prenatal peak in the density of serotonin 5‐HT1A receptors. Neurosci Lett 127:173–176. [DOI] [PubMed] [Google Scholar]
- 6. Bartesaghi R, Guidi S, Ciani E (2011) Is it possible to improve neurodevelopmental abnormalities in Down syndrome? Rev Neurosci 22:419–455. [DOI] [PubMed] [Google Scholar]
- 7. Becker L, Mito T, Takashima S, Onodera K (1991) Growth and development of the brain in Down syndrome. Prog Clin Biol Res 373:133–152. [PubMed] [Google Scholar]
- 8. Belichenko PV, Masliah E, Kleschevnikov AM, Villar AJ, Epstein CJ, Salehi A, Mobley WC (2004) Synaptic structural abnormalities in the Ts65Dn mouse model of Down syndrome. J Comp Neurol 480:281–298. [DOI] [PubMed] [Google Scholar]
- 9. Belichenko PV, Kleschevnikov AM, Salehi A, Epstein CJ, Mobley WC (2007) Synaptic and cognitive abnormalities in mouse models of Down syndrome: exploring genotype‐phenotype relationships. J Comp Neurol 504:329–345. [DOI] [PubMed] [Google Scholar]
- 10. Benavides‐Piccione R, de Ballesteros‐Yanez I, Lagran MM, Elston G, Estivill X, Fillat C et al (2004) On dendrites in Down syndrome and DS murine models: a spiny way to learn. Prog Neurobiol 74:111–126. [DOI] [PubMed] [Google Scholar]
- 11. Bianchi P, Ciani E, Guidi S, Trazzi S, Felice D, Grossi G et al (2010) Early pharmacotherapy restores neurogenesis and cognitive performance in the Ts65Dn mouse model for Down syndrome. J Neurosci 30:8769–8779. [DOI] [PMC free article] [PubMed] [Google Scholar]
- 12. Brezun JM, Daszuta A (1999) Depletion in serotonin decreases neurogenesis in the dentate gyrus and the subventricular zone of adult rats. Neuroscience 89:999–1002. [DOI] [PubMed] [Google Scholar]
- 13. Caccia S, Cappi M, Fracasso C, Garattini S (1990) Influence of dose and route of administration on the kinetics of fluoxetine and its metabolite norfluoxetine in the rat. Psychopharmacology (Berl) 100:509–514. [DOI] [PubMed] [Google Scholar]
- 14. Clark S, Schwalbe J, Stasko MR, Yarowsky PJ, Costa AC (2006) Fluoxetine rescues deficient neurogenesis in hippocampus of the Ts65Dn mouse model for Down syndrome. Exp Neurol 200:256–261. [DOI] [PubMed] [Google Scholar]
- 15. Contestabile A, Fila T, Ceccarelli C, Bonasoni P, Bonapace L, Santini D et al (2007) Cell cycle alteration and decreased cell proliferation in the hippocampal dentate gyrus and in the neocortical germinal matrix of fetuses with Down syndrome and in Ts65Dn mice. Hippocampus 17:665–678. [DOI] [PubMed] [Google Scholar]
- 16. Couillard‐Despres S, Winner B, Schaubeck S, Aigner R, Vroemen M, Weidner N et al (2005) Doublecortin expression levels in adult brain reflect neurogenesis. Eur J Neurosci 21:1–14. [DOI] [PubMed] [Google Scholar]
- 17. DeVane CL (1994) Pharmacokinetics of the newer antidepressants: clinical relevance. Am J Med 97:13S–23S. [DOI] [PubMed] [Google Scholar]
- 18. Faber KM, Haring JH (1999) Synaptogenesis in the postnatal rat fascia dentata is influenced by 5‐HT1A receptor activation. Brain Res Dev Brain Res 114:245–252. [DOI] [PubMed] [Google Scholar]
- 19. Grossi G, Bargossi A, Battistoni R, Lippi A, Sprovieri G (1989) Full automation of catecholamine metabolite determination by column switching and high‐performance liquid chromatography. J Chromatogr 465:113–119. [DOI] [PubMed] [Google Scholar]
- 20. Grossi G, Bargossi AM, Lucarelli C, Paradisi R, Sprovieri C, Sprovieri G (1991) Improvements in automated analysis of catecholamine and related metabolites in biological samples by column‐switching high‐performance liquid chromatography. J Chromatogr 541:273–284. [DOI] [PubMed] [Google Scholar]
- 21. Guidi S, Bonasoni P, Ceccarelli C, Santini D, Gualtieri F, Ciani E, Bartesaghi R (2008) Neurogenesis impairment and increased cell death reduce total neuron number in the hippocampal region of fetuses with Down syndrome. Brain Pathol 18:180–197. [DOI] [PMC free article] [PubMed] [Google Scholar]
- 22. Guidi S, Ciani E, Bonasoni P, Santini D, Bartesaghi R (2011) Widespread proliferation impairment and hypocellularity in the cerebellum of fetuses with Down syndrome. Brain Pathol 21:361–373. [DOI] [PMC free article] [PubMed] [Google Scholar]
- 23. Hajszan T, MacLusky NJ, Leranth C (2005) Short‐term treatment with the antidepressant fluoxetine triggers pyramidal dendritic spine synapse formation in rat hippocampus. Eur J Neurosci 21:1299–1303. [DOI] [PubMed] [Google Scholar]
- 24. Liu DP, Schmidt C, Billings T, Davisson MT (2003) Quantitative PCR genotyping assay for the Ts65Dn mouse model of Down syndrome. Biotechniques 35:1170–1174, 1176, 1178 passim. [DOI] [PubMed] [Google Scholar]
- 25. Malberg JE, Blendy JA (2005) Antidepressant action: to the nucleus and beyond. Trends Pharmacol Sci 26:631–638. [DOI] [PubMed] [Google Scholar]
- 26. Mann DM, Yates PO, Marcyniuk B, Ravindra CR (1985) Pathological evidence for neurotransmitter deficits in Down's syndrome of middle age. J Ment Defic Res 29(Pt 2):125–135. [DOI] [PubMed] [Google Scholar]
- 27. Megias M, Verduga R, Dierssen M, Florez J, Insausti R, Crespo D (1997) Cholinergic, serotonergic and catecholaminergic neurons are not affected in Ts65Dn mice. Neuroreport 8:3475–3478. [DOI] [PubMed] [Google Scholar]
- 28. Rachidi M, Lopes C (2008) Mental retardation and associated neurological dysfunctions in Down syndrome: a consequence of dysregulation in critical chromosome 21 genes and associated molecular pathways. Eur J Paediatr Neurol 12:168–182. [DOI] [PubMed] [Google Scholar]
- 29. Reeves RH, Irving NG, Moran TH, Wohn A, Kitt C, Sisodia SS et al (1995) A mouse model for Down syndrome exhibits learning and behaviour deficits. Nat Genet 11:177–184. [DOI] [PubMed] [Google Scholar]
- 30. Rhin LL, Claiborne BJ (1990) Dendritic growth and regression in rat dentate granule cells during late postnatal development. Dev Brain Res 54:115–124. [DOI] [PubMed] [Google Scholar]
- 31. Schlessinger AR, Cowan WM, Gottlieb DI (1975) An autoradiographic study of the time of origin and the pattern of granule cell migration in the dentate gyrus of the rat. J Comp Neurol 159:149–175. [DOI] [PubMed] [Google Scholar]
- 32. Sholl DA (1953) Dendritic organization in the neurons of the visual and motor cortices of the cat. J Anat 87:387–406. [PMC free article] [PubMed] [Google Scholar]
- 33. Strovel J, Stamberg J, Yarowsky PJ (1999) Interphase FISH for rapid identification of a Down syndrome animal model. Cytogenet Cell Genet 86:285–287. [DOI] [PubMed] [Google Scholar]
- 34. Takashima S, Ieshima A, Nakamura H, Becker LE (1989) Dendrites, dementia and the Down syndrome. Brain Dev 11:131–133. [DOI] [PubMed] [Google Scholar]
- 35. Trazzi S, Mitrugno VM, Valli E, Fuchs C, Rizzi S, Guidi S et al (2011) APP‐dependent up‐regulation of Ptch1 underlies proliferation impairment of neural precursors in Down syndrome. Hum Mol Genet 20:1560–1573. [DOI] [PubMed] [Google Scholar]
- 36. Wang JW, David DJ, Monckton JE, Battaglia F, Hen R (2008) Chronic fluoxetine stimulates maturation and synaptic plasticity of adult‐born hippocampal granule cells. J Neurosci 28:1374–1384. [DOI] [PMC free article] [PubMed] [Google Scholar]
- 37. Yan W, Wilson CC, Haring JH (1997) 5‐HT1A receptors mediate the neurotrophic effect of serotonin on developing dentate granule cells. Brain Res Dev Brain Res 98:185–190. [DOI] [PubMed] [Google Scholar]
- 38. Yan W, Wilson CC, Haring JH (1997) Effects of neonatal serotonin depletion on the development of rat dentate granule cells. Brain Res Dev Brain Res 98:177–184. [DOI] [PubMed] [Google Scholar]
- 39. Yuen EY, Jiang Q, Chen P, Gu Z, Feng J, Yan Z (2005) Serotonin 5‐HT1A receptors regulate NMDA receptor channels through a microtubule‐dependent mechanism. J Neurosci 25:5488–5501. [DOI] [PMC free article] [PubMed] [Google Scholar]
- 40. Zhao C, Teng EM, Summers RG Jr, Ming GL, Gage FH (2006) Distinct morphological stages of dentate granule neuron maturation in the adult mouse hippocampus. J Neurosci 26:3–11. [DOI] [PMC free article] [PubMed] [Google Scholar]