

Abstract
In various types of cancers including glioblastoma, accumulating evidence show the existence of cancer stem‐like cells (CSCs), characterized by stem cell marker expression, capability of differentiation and self‐renewal, and high potential for tumor propagation in vivo. LGR5, whose expression is positively regulated by the Wnt signaling pathway, is a stem cell marker in intestinal mucosa and hair follicle in the skin. As Wnt signaling is also involved in brain development, the function of LGR5 in the maintenance of brain CSCs is to be assessed. Our study showed that the LGR5 transcript level was increased in CSCs. Co‐immunofluorescence staining demonstrated the co‐localization of CD133‐ and LGR5‐positive cells in glioblastoma tissue sections. Functionally, silencing of LGR5 by lentiviral shRNA‐mediated knockdown induced apoptosis in brain CSCs. Moreover, LGR5 depletion led to a downregulation of L1 cell adhesion molecule expression. In line with an important function in glioma tumorigenesis, LGR5 expression increased with glioma progression and correlated with an adverse outcome. Our findings suggest that LGR5 plays a role in maintenance and/or survival of brain CSCs.
Keywords: apoptosis, cancer stem cell, glioblastoma, glioma, LGR5
Introduction
In glioma, accumulating evidence support the existence of a small subpopulation of cancer cells with properties of neural stem cells (NSC), including the expression of stem cell markers, as well as the capability to differentiate and self‐renew 16, 24, 34, 35. In addition, these cancer stem‐like cells (CSCs) have a high tumorigenic potential and are resistant to chemotherapy and irradiation, suggesting that cancer cells harboring stem cell‐like properties might be responsible for tumor development, recurrence and metastasis 2, 32, 38. A recent study using a transgenic mouse glioma model provided evidence that neural stem/progenitor cells with accumulation of genetic aberrations can be the origin of malignant astrocytoma 1. Further investigation of the molecular mechanisms that regulate CSCs expansion and maintenance is, therefore, essential to better understand glioma pathology and develop novel and effective therapeutics. However, the lack of specific stem cell markers impedes the isolation and analysis of glioblastoma stem‐like cells.
In the recent years, several reports highlighted restricted expression of the leucine‐rich repeat containing G‐protein–coupled receptor 5 (LGR5) in a small subset of cells from the intestinal crypt bottom, also found in stomach and hair follicles 4, 5, 26. LGR5 expression is positively regulated by the Wnt signaling pathway 4, 36, which is an essential pathway in brain development, regulating expansion and maintenance of neural stem and precursor cell populations 15, 29. Notably, Wnt signaling is also involved in the tumorigenesis of various other cancers 11, 25. Recently, it has been reported that the secreted Wnt‐enhancer proteins R‐spondins interact with LGR4 and LGR5, regulating Wnt signaling 9, 12, 20
Despite the eminent role of Wnt signaling in tumorigenesis, the functional role of LGR5 in brain tumors has not yet been examined. In this study, we investigated the expression pattern of LGR5 in clinical samples of astrocytoma tumors of different World Health Organization (WHO) grades and studied its function in survival and maintenance of brain CSCs in vitro.
Materials and Methods
Cell culture
Glioblastoma samples were obtained from patients undergoing surgical resection according to the research proposals approved by the Institutional Review Board at the Medical Faculty of Heidelberg, Germany. Tissues were enzymatically dissociated and cultivated in stem cell medium as neurospheres 13, 14, made of Dulbecco's modified Eagle's medium (DMEM)/F‐12 medium containing 20% bovine serum albumin, insulin, transferrin (BIT) serum‐free supplement, basic fibroblast growth factor and epidermal growth factor (EGF) at a concentration of 20 ng/mL each (Invitrogen, Karlsruhe, Germany). The brain CSC lines NCH421k and NCH441 cells were established independently from patients‐derived tumors of glioblastoma multiforme, and characterized genotypically and phenotypically in previous studies 8, 10, 14. To induce differentiation, neurospheres were grown in DMEM medium containing 10% fetal calf serum and 10 nM all‐trans retinoic acid (ATRA) after dissociation of neurospheres by trypsin (NCH421k) or accutase (NCH441). Human normal astrocytes were purchased from Promocell (Heidelberg, Germany) and maintained in astrocyte basal medium with astrocyte growth supplement, 2% fetal bovine serum and 1/3 conditioning medium (ScienCell, Carlsbad, CA, USA), according to supplier's recommendation.
Lentiviral vector‐mediated short hairpin RNA interference
RNAi clones targeting LGR5 were purchased from Sigma‐Aldrich (St Louis, MO, USA) (TRCN0000011585, TRCN0000011586, TRCN0000011587). Lentiviral particles were produced according to the manufacturer's instruction. Lentiviruses were concentrated by ultracentrifugation. Titer was measured by detecting green fluorescent protein (GFP)‐positive HEK293T cells using flow cytometry. Before transduction, neurospheres were dissociated with trypsin or accutase treatment. Transductions were performed at five of multiplicity of infection with 8 μg/mL polybrene for brain CSCs, conferring ∼90 % transduction efficiency without significant cytotoxicity in negative control samples.
Quantitative real‐time polymerase chain reaction (qRT‐PCR)
One μg of total RNA was treated with DNaseI (Invitrogen) and reverse‐transcribed with SuperscriptII (Invitrogen). Each complementary DNA sample was analyzed in triplicate with the ABI PRISM 7700 (Applied Biosystems, Foster City, CA, USA) using Absolute SYBR Green ROX Mix (ABgene, Epsom, UK) according to the manufacturer's instructions. Two endogenous housekeeping genes (ARF1 and DCTN2) were used as internal standards. All primers were tested to exclude amplification from genomic DNA. Pooled total normal brain extract from five adult donors were purchased (BioChain Institute, Inc., Hayward, CA, USA) and used as control. The relative quantification of the RNA of interest in comparison with the housekeeping genes was calculated with the standard curves that were generated with serial 1:3 dilutions of cDNA sample from the universal human reference total RNA (Stratagene Agilent Technologies, West Cedar Creek, TX, USA). Oligonucleotide sequences are available in Supporting Information Table S1.
Immunohistochemistry and immunofluorescence staining
Spheroid cells were dissociated by trypsin. Differentiation‐induced cells were detached from plates by trypsin and washed in PBS. Cytospin smears were prepared using Cytospin 3 Cytocentrifuge (Wolf Laboratories Limited, Pocklington, UK) and fixed with 4 % paraformaldehyde for 10 min at room temperature followed by permeablization using 0.01% of Triton X. Paraffin‐embedded sections were deparaffinized in xylene, and rehydrated through descending concentrations of ethanol. Antigen retrieval was performed using citrate buffer (10 mM, pH 6.0) and heating in a steamer cooker for 40 minutes. Endogenous peroxidase was blocked by 3% hydrogen peroxide for 10 minutes. Twenty percent normal goat serum was used as blocking solution for the LGR5 staining. Nuclei were counterstained with hematoxylin for 1 minute. LGR5 polyclonal antibodies (MBL International, Woburn, MA, USA, LS‐A1235 at 1:50, or LS‐A1232 at 1:100), and monoclonal CD133/1 antibody (Miltenyi Biotec, Bergisch Gladbach, Germany, at 1:11 dilution) were incubated overnight at 4°C. Immunohistochemical analysis including tissue microarray was performed using Envision+ System and AEC or DAB visualization (Dako, Carpinteria, CA, USA) according to the manufacturer's instructions.
Co‐immunofluorescence staining was performed using CSAII Signal Amplification System (Dako) for CD133 and Alexa Fluor 568‐conjugated goat anti‐rabbit IgG (Invitrogen, Carlsbad, CA, USA) as secondary antibody for LGR5. Nuclei were stained using To‐Pro3 prior to mounting. Negative controls were obtained with the same procedure without primary antibody or unimmunized rabbit IgG (Dako).
Cell viability and apoptosis assays
Cell viability was quantified with CellTiter Glo Luminescent Cell Viability Assay kit according to manufacturer's instruction (Promega, Madison, WI, USA). Cell counting with trypan blue dye exclusion test was performed with standard protocol using Vi‐CELL counter (Beckman Coulter, Fullerton, CA, USA). Apoptosis was quantified using the subG1 hypodiploid apoptosis assay. Cells were fixed with 70% ethanol, treated with ribonuclease A (SIGMA Chemical Co., St Louis, MO, USA), and the nuclei were stained with propidium iodide (SIGMA Chemical Co.). The DNA content was measured using a FACSCanto flow cytometer with FACSDiva software (BD Biosciences, San Jose, CA, USA). For all assays, 10 000 cells were counted.
Tissue microarray
Tumor samples for the tissue microarray were collected at the Department of Neurosurgery, Heidelberg University Hospital, Germany. Eligibility criteria included written informed consent from the patient and availability of follow‐up data. All patients were treated by surgery at diagnosis; radiotherapy and/or chemotherapy were administered for high‐grade tumors. All tumors were classified according to the WHO Classification of Tumors of the Nervous System. The LGR5 staining score was assessed by two independent researchers, who were blind to clinical informations. Average staining of evaluable biopsies of each individual patient were taken as final result. Complete negative staining was defined as LGR5 score 1. Cases containing only rare positive cells (∼10%) were defined as score 2. Cases containing 10∼70% LGR5‐positive cells were defined as score 3. Cases in which the vast majority of cells (>70%) were LGR5 positive were defined as score 4. We defined LGR5 “low” as cases with scores 1 and 2, and LGR5 “high” as cases with scores 3 and 4.
Patient characteristics of all samples used for the TMA are summarized in Supporting Information Table S2.
Gene expression analysis
Sample amplification was done using 100 ng of total RNA by the method of Van Gelder et al 37. RNA was amplified using the TotalPrep RNA Amplification kit (Illumina, San Diego, CA, USA) following the manufacturer's instructions. Labeling was achieved by incorporation of biotin‐16‐uridine triphosphate (UTP). Labeled RNA was hybridized to the Illumina Human whole genome Sentrix‐6 V2 BeadChip array according to the manufacturer's instructions (Illumina). Microarray scanning was done using a Beadstation array scanner. Data extraction was done using the bead array R package (svn release 1.7.0) from bioconductor.org. Bead outliers were removed when their expression value dropped below a threshold, because of the imaging system background, nonspecific binding or cross‐hybridization signal. Individual bead types were flagged as filtered when their bead replicate count dropped below 17. We excluded a bead type when its filter flag was set across all samples. Data analysis was done by variance stabilizing and spline normalizing the signals using the algorithms from the lumi R package (release 1.1.0) from bioconductor.org 19, implemented in our in‐house developed ChipYard framework for microarray data analysis (http://www.dkfz.de/genetics/ChipYard).
R2, a microarray analysis and visualization platform, provided by the Department of Human Genetics of the Academic Medical Centre (Amsterdam, the Netherlands; http://r2.amc.nl), was used to study LGR5 mRNA expression in CD133 sorted glioblastoma cells [17 GSE18015; n = 8]. Expression data was MAS5.0 normalized prior to analysis.
Statistical analysis
Significance analysis of microarrays (SAM) was performed using the MeV software 31, applying a false discovery rate < 1%. Genes showing a q‐value < 1% were considered as significantly differentially expressed between negative controls and shRNA‐LGR5–transduced samples.
Correlation between LGR5 expression and tumor aggressiveness was expressed as Pearson's correlation coefficients. The association between overall survival and gene expression was calculated using log‐rank tests and presented as Kaplan–Meier plots. Multivariate survival statistics were performed employing multivariate Cox regression. Calculations were performed using the statistical software environment R, version 2.4.1 (http://www.r‐project.org).
Results
LGR5 is expressed in brain CSCs
Several reports have emphasized the role of LGR5 as a stem cell marker in various tissues 4, 5, 22, 26. In order to verify its possible use to characterize brain CSCs, we examined LGR5 mRNA expression levels in CSCs of glioblastoma. As shown in Figure 1A, CSCs expressed LGR5 mRNA up to 10‐fold higher when compared with cultured normal astrocytes and total normal brain extract, suggesting a stem‐like cell‐specific high‐level expression. Moreover, LGR5 mRNA expression in glioblastoma cells sorted for their CD133 content was determined by in silico analysis of publicly available microarray data 17, using R2 analysis software. LGR5 expression was found to correlate with CD133 content (r = 0.582, P = 0.02, Figure 1B). In order to study LGR5 protein expression in glioblastoma tissues, we first confirmed the specificity of anti‐LGR5 antibody using human normal small intestine tissue sections, demonstrating its exclusive expression in the crypt base columnar cells consistent with a previous report 4 (Figure 1C). Immunohistochemical staining of glioblastoma sections showed LGR5‐positive tumor cells to be preferentially localized in the vicinity of blood vessels, reminiscent of the perivascular niche of CSCs previously described for CD133 positive cells 7, 33 (Figure 1D). Given the putative role of LGR5 as stem cell marker, we investigated the overlap of LGR5 and CD133 protein expression by co‐immunofluorescence staining with anti‐CD133 and anti‐LGR5 antibody. As depicted in Figure 1E, CD133 protein expression co‐localized with LGR5 in glioblastoma tissue samples, suggesting that these markers could identify a small subpopulation of brain CSCs.
Figure 1.
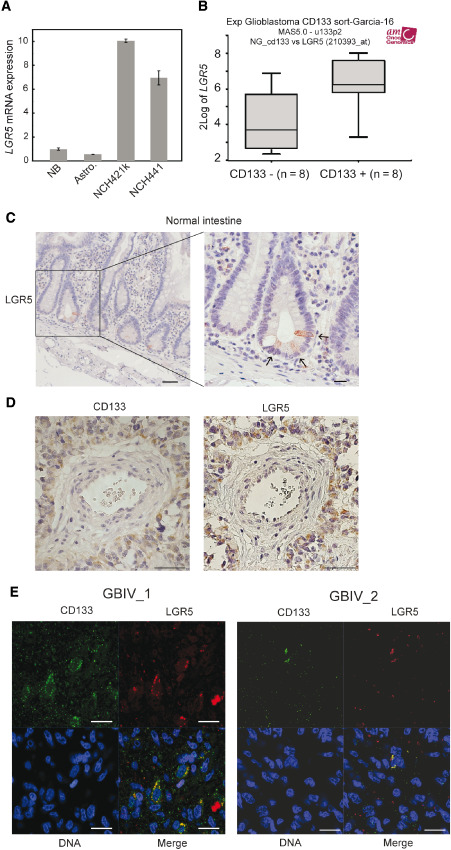
LGR5 is expressed in brain CSCs in vitro and in CD133 + cells in glioblastoma. A. Analysis of LGR5 mRNA expression by quantitative real‐time polymerase chain reaction. Total mRNA was extracted from NB, Astro and brain CSCs (NCH421k and NCH441). Results were normalized to mRNA levels of two housekeeping genes. Error bars represent standard deviations of three independent biological replicates. B. In silico analysis of LGR5 mRNA expression using R2 analysis software on datasets of CD133 sorted glioblastoma cells. C. Normal intestine labelling was used as positive control for LGR5 antibody. Isotype. Scale bar = 50 μm for left panel, 20μm for center and right panel. D. Representative images of LGR5 and CD133 positive perivascular glioblastoma cells. Scale bar = 50 μm. E. Representative images of co‐immunofluorescence staining of CD133 (green) and LGR5 (red) with counter‐staining of DNA (blue) in glioblastoma tumor section. Staining from two independent cases are shown. Scale bar = 20 μm. Astro = cultured normal human astrocytes; CSCs = cancer stem‐like cells; NB = normal brain.
LGR5 is downregulated upon differentiation
To verify the stem cell specificity of LGR5 expression, we induced differentiation of CSCs (Figure 2A) by cultivating glioblastoma spheroids in ATRA‐containing medium without growth factors. Differentiation was indicated by the observed decreased CD133 expression and increased GFAP expression (Figure 2B). Importantly, LGR5 mRNA expression was reduced by more than twofold in ATRA‐treated cells when compared with undifferentiated cells (Figure 2B). Moreover, LGR5‐positive cells were similarly reduced following ATRA treatment. In contrast, the proportion of GFAP‐positive cells was increased indicating differentiation of ATRA‐treated cells. These results confirmed that LGR5 is expressed preferentially in brain CSCs and is reduced following differentiation (Figure 2C).
Figure 2.
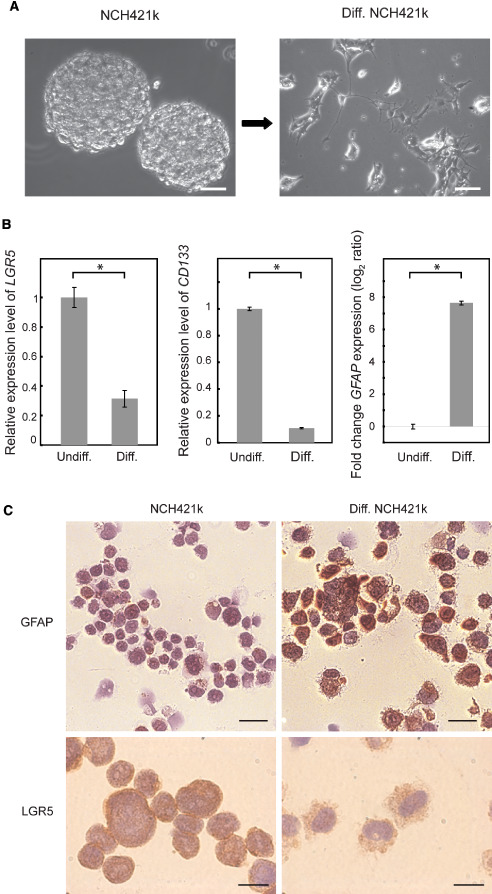
LGR5 is downregulated upon differentiation. A. Phase contrast images of NCH421k cells before and after induction of differentiation using ATRA. Scale bar = 20 μm. B. Analysis of LGR5, CD133 and GFAP mRNA expression quantified by quantitative real‐time polymerase chain reaction in NCH421k cells and ATRA‐differentiated cells. Results were normalized to mRNA levels of two housekeeping genes. Error bars represent standard deviations of three independent biological replicates. C. Protein expression of GFAP and LGR5 were visualized by immunohistochemistry in cytospin smears of NCH421k cells and ATRA‐differentiated NCH421k cells. Scale bar = 20 μm, GFAP staining; 10 μm LGR5 staining. ATRA = all‐trans retinoic acid.
LGR5 knockdown suppresses viability and induces apoptosis of brain CSCs
Given the association of LGR5 expression with stem cell characteristics, we hypothesized that LGR5 might play a role in brain CSCs maintenance. To test this, we silenced LGR5 mRNA expression using lentiviral‐mediated shRNA and confirmed the successful knockdown by qRT‐PCR (Figure 3A) and immunofluorescence staining (Figure 3B). Upon LGR5 silencing, the spheroid morphology of brain CSCs was impaired (Figure 3C). The growth curve by trypan blue dye exclusion test demonstrated that LGR5 knockdown significantly decreased the number of viable CSCs (Figure 3E) and increased the proportion of trypan blue‐positive dead CSCs (Figure 3F). The significant reduction of viability upon silencing of LGR5 was confirmed by a metabolism‐based Cell Titer Glo viability assay (Figure 3D). In order to determine the level of apoptosis, we measured the number of dead cells upon LGR5 knockdown by flow cytometry. As shown in Figure 3G–I, the size of the subG1 population was significantly increased when compared with the negative control in LGR5‐silenced NCH421k cells. Similar results were observed in NCH441, an additional CSC line (Supporting Figure S1), indicating the importance of LGR5 for the survival of brain CSCs in vitro. In line with these observations, even 9 days after LGR5 silencing, sphere formation could not be detected, in contrast to confluent sphere formation in CSC lines transduced with nontarget shRNA (Supporting Information Figure S2).
Figure 3.
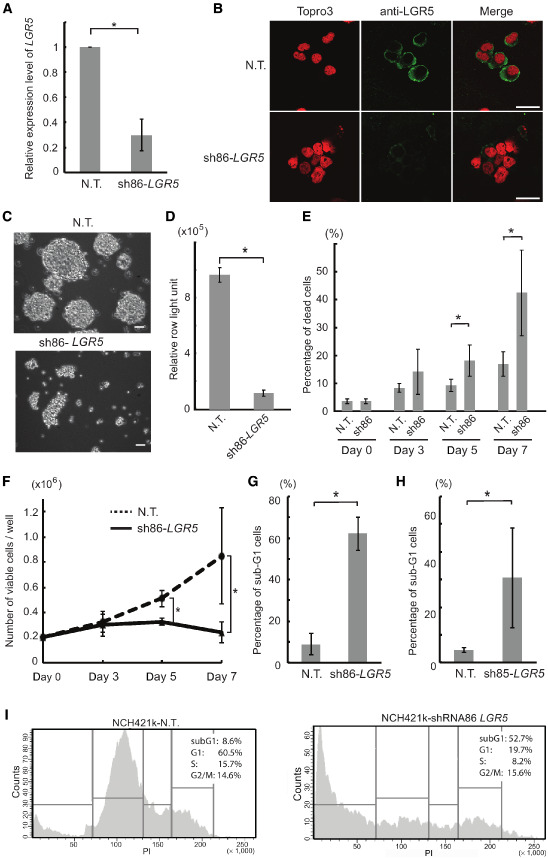
LGR5 depletion induces apoptosis in brain CSCs. A. Quantitative real‐time polymerase chain reaction analysis of LGR5 mRNA expression in NCH421k cells transduced with lentiviral NT and LGR5 shRNA (sh‐LGR5). B. Protein expression of LGR5 was visualized by immunofluorescence staining in cytospin smears of NCH421k cells transduced with lentiviral NT and LGR5 shRNA (sh‐LGR5). Scale bar = 20 μm. C. Phase contrast images of NCH421k and NCH441 cells 7 days after the transduction with NT and LGR5 lentiviral shRNA. Scale bar; 50 μm. D. NCH421k cells were transduced with NT and LGR5 shRNA and then assessed for viability by CellTiter‐Glo assay. Error bars represent the standard deviation of three independent biological replicates. E–F. NCH421k cells were transduced with NT and LGR5 shRNA and then assessed for viability by trypan blue dye exclusion tests on day 0, 3, 5 and 7 days after the transduction. Absolute numbers of trypan blue‐negative viable cells were shown in D, and percentages of trypan blue‐positive dead cells in E. G–H. Validation of the apoptosis phenotype upon LGR5 silencing using two different shRNAs by PI staining and sub‐G1 assay in NCH421k. Quantitative analysis of three independent experiments of sub‐G1 assay are shown. P‐value < 0.001, Student's t‐test. I. Representing histograms of sub‐G1 assay are shown. Left panel, NT control; Right panel, shRNA targeting LGR5. NT = nontarget control.
In ATRA‐differentiated cells, no significant rate of apoptosis was observed despite the low LGR5 expression, suggesting that pro‐survival function of LGR5 might be specific for stem cell cultures maintained in serum‐free medium. To exclude that serum‐containing components could rescue LGR5‐silenced cells from apoptosis induction, we cultivated spheroid cells in serum‐containing medium. However, these culture conditions failed to attenuate apoptosis induction in LGR5‐silenced brain CSCs (data not shown), indicating that serum components are not responsible for the survival of LGR5‐low expressing cells in differentiation promoting conditions.
L1CAM is a downstream target of LGR5
Next, we studied the impact of silencing LGR5 on gene expression of brain CSCs. NCH421k cells were transduced with three different shRNAs targeting LGR5 and subsequently, the mRNA profiles were compared with those of three negative controls. We performed unsupervised hierarchical clustering of the RNA expression data of un‐transduced cells (mock), cells transduced with an empty pLKO.1 vector or with a nontargeting shRNA, as well as the LGR5 knockdown NCH421k. As depicted by the Euclidean distance, silenced cells were easily distinguishable from three negative controls that cluster together, (Figure 4A).
Figure 4.
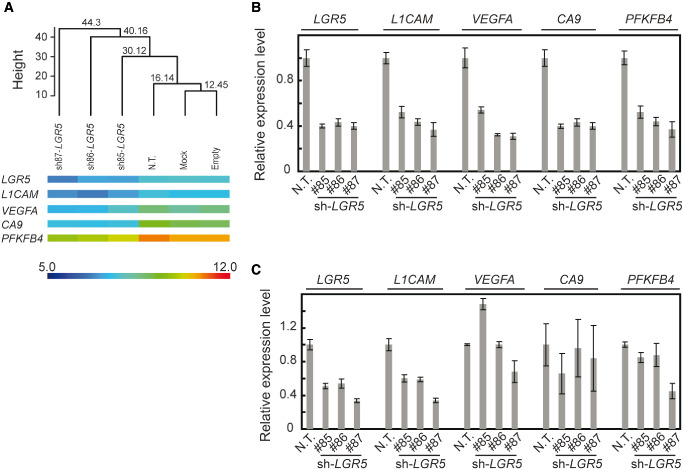
Expression analysis of LGR5 knockdowns by microarrays. A. Dendogram built upon unsupervised clustering using information from all the probe sets of the microarrays. Three negative controls (Mock, empty vector and nontarget shRNA) and three samples silenced with three different LGR5 targeting shRNAs were studied by significance analysis of microarrays. The Euclidean distance is represented by the height on the y‐axis. Heatmaps of the verified genes are depicted. Color scale represents the intensity of the hybridization on Illumina microarrays. B. Confirmation of the significant gene expression changes using qRT‐PCR in NCH421k cells cultivated in suspension. C. Verification of the significant gene expression changes by qRT‐PCR in NCH421k cells cultivated in adherent conditions. Error bars represent the standard deviation of three independent biological replicates. qRT‐PCR = quantitative real‐time polymerase chain reaction.
By SAM, using a false discovery rate and a q‐value < 1% as statistical cut‐off values, we identified 78 and 27 genes that showed significant down‐ and upregulation, respectively. By qRT‐PCR, we verified the expression of a set of genes that showed downregulation of mRNA expression level upon LGR5 silencing (Figure 4B). Among them are several genes known to be regulated by environmental factors such as pH and oxygen level (e.g., CA9, VEGFA, PFKFB4 and L1CAM; Tables 1 and 2). However, the high representation of hypoxia‐related genes among the differentially regulated genes could be caused by the disruption of the spheric conformation upon the silencing of LGR5 leading to more normoxic conditions and therefore may result from the specific in vitro conditions. To address this question, we used an adherent cell culture system for NSCs maintenance 30. LGR5‐silenced cells in adherent stem cell culture did not show the significant reduction of VEGFA, CA9 or PFKFB4. In contrast, L1CAM was downregulated upon LGR5 knockdown also in the adherent CSC cultures that are subject to a constant and equal level of oxygen (Figure 4C). Moreover, LGR5 knockdown induced a significant level of apoptosis in adherent stem cell cultures as well. These results demonstrate that the induction of apoptosis and the downregulation of L1CAM caused by LGR5 knockdown are independent of the sphere formation or the change of the oxygen level.
Table 1.
List of genes downregulated upon LGR5 knockdown.
| Gene symbol | Gene name | Fold change (Log2) | q‐value (%) |
|---|---|---|---|
| CA9a | Carbonic anhydrase 9 precursor | −1.54 | 0 |
| MT3 | Metallothionein‐3 | −1.41 | 0 |
| NDRG1 | N‐myc downstreamregulated gene 1 protein | −1.35 | 0 |
| AHNAK2 | AHNAK nucleoprotein 2 | −1.26 | 0 |
| MIA | Melanoma‐derived growth regulatory protein precursor | −1.25 | 0 |
| ZNF395 | Zinc finger protein 395 | −1.08 | 0 |
| WSB1 | WD repeat and SOCS box‐containing protein 1 | −1.05 | 0 |
| PKM2 | Pyruvate kinase isozymes M1/M2 | −1.04 | 0 |
| VEGFAa | Vascular endothelial growth factor A precursor | −1.03 | 0 |
| SLC5A3 | Sodium/myo‐inositol cotransporter (Na(+) | −1.01 | 0 |
| RNASE4 | Ribonuclease 4 precursor | −0.98 | 0 |
| MT1A | Metallothionein‐1A | −0.92 | 0 |
| FZD3 | Frizzled‐3 precursor | −0.92 | 0 |
| PRRT2 | Proline‐rich transmembrane protein 2 | −0.90 | 0 |
| C1orf54 | Uncharacterized protein C1orf54 precursor. | −0.88 | 0 |
| ALDOC | Fructose‐bisphosphate aldolase C | −0.88 | 0 |
| PFKFB4a | 6‐phosphofructo‐2‐kinase/fructose‐2,6‐biphosphatase 4 | −0.86 | 0 |
| CCDC136 | Coiled‐coil domain‐containing 136 | −0.84 | 0 |
| MFNG | Beta‐1,3‐N‐acetylglucosaminyltransferase manic fringe | −0.83 | 0 |
| ATP1A2 | Sodium/potassium‐transporting ATPase subunit alpha‐2 precursor | −0.82 | 0 |
| GSN | Gelsolin precursor | −0.82 | 0 |
| PGK1 | Phosphoglycerate kinase 1 | −0.81 | 0 |
| SLC6A6 | Sodium‐ and chloride‐dependent taurine transporter. | −0.79 | 0 |
| RAB20 | Ras‐related protein Rab‐20. | −0.79 | 0 |
| LGR5 a | Leucine‐rich repeat‐containing G‐protein coupled receptor 5 precursor | −0.78 | 0 |
| ATP2B4 | Plasma membrane calcium‐transporting ATPase 4 | −0.78 | 0 |
| TNNT1 | Troponin T | −0.77 | 0 |
| FCGR2A | Low affinity immunoglobulin gamma Fc region receptor II‐a precursor | −0.76 | 0 |
| PPFIA4 | Liprin‐alpha‐4 | −0.76 | 0 |
| NAT10 | N‐acetyltransferase 10 | −0.74 | 0 |
| MYO9A | Myosin IXA | −0.72 | 0 |
| L1CAMa | Neural cell adhesion molecule L1 precursor | −0.67 | 0 |
| NEDD4L | E3 ubiquitin‐protein ligase NEDD4‐like protein | −0.65 | 0 |
| STAT5B | Signal transducer and activator of transcription 5B. | −0.63 | 0 |
| C12orf57 | Putative C10 protein. | −0.63 | 0 |
| SCD | Acyl‐CoA desaturase | −0.61 | 0 |
| GPR125 | Probable G‐protein coupled receptor 125 precursor. | −0.61 | 0 |
| MGLL | Monoglyceride lipase | −0.61 | 0 |
| FRAS1 | Extracellular matrix protein FRAS1 precursor. | −0.60 | 0 |
| RUNX1 | Runt‐related transcription factor 1 | −0.60 | 0 |
| CBR3 | Carbonyl reductase | −0.60 | 0 |
| TUB | Tubby protein homolog. | −0.59 | 0 |
| PHF19 | PHD finger protein 19 isoform a | −0.59 | 0 |
| SLC44A1 | Choline transporter‐like protein 1 | −0.58 | 0 |
| LPIN1 | Lipin‐1. | −0.58 | 0 |
| WDR54 | WD repeat protein 54. | −0.57 | 0 |
| COL9A1 | Collagen alpha‐1(IX) chain precursor. | −0.57 | 0 |
| GBE1 | 1,4‐alpha‐glucan branching enzyme | −0.55 | 0 |
| ADCK4 | Uncharacterized aarF domain‐containing protein kinase 4 | −0.55 | 0 |
| NAV1 | Neuron navigator 1 | −0.54 | 0 |
| ADNP2 | Zinc finger protein 508. | −0.54 | 0 |
| MGST3 | Microsomal glutathione S‐transferase 3 | −0.53 | 0 |
| ARMCX4 | Armadillo repeat‐containing X‐linked protein 4. | −0.53 | 0 |
| CCDC113 | Coiled‐coil domain‐containing protein 113 | −0.51 | 0 |
| PTCHD1 | Patched domain‐containing protein 1. | −0.51 | 0 |
| AHCTF1P | AT‐hook‐containing transcription factor 1 | −0.65 | 0.6024903 |
| SLC22A17 | Brain‐type organic cation transporter | −0.63 | 0.6024903 |
| FLNB | Filamin‐B | −0.58 | 0.6024903 |
| HELZ | Probable helicase with zinc finger domain | −0.50 | 0.6518747 |
| S100A1 | S100 calcium‐binding protein A1 | −0.87 | 0.6739722 |
| ENO2 | Gamma‐enolase | −0.72 | 0.6739722 |
| S100A10 | S100 calcium‐binding protein A10 | −1.03 | 0.69155407 |
| MT1X | Metallothionein‐1X | −0.90 | 0.69155407 |
| ADM | ADM precursor | −0.57 | 0.69155407 |
| HK1 | Hexokinase‐1 | −0.60 | 0.71647495 |
| ACAD11 | Nephrocystin‐3. | −0.51 | 0.71647495 |
| LMO1 | LIM domain only protein 1 | −0.95 | 0.7296213 |
| DDIT4 | RTP801 | −0.59 | 0.7502709 |
| RAB26 | Ras‐related protein Rab‐26. | −0.92 | 0.75741637 |
| TMEM45A | Transmembrane protein 45A | −0.68 | 0.7646992 |
| EFEMP2 | EGF‐containing fibulin‐like extracellular matrix protein 2 precursor | −0.59 | 0.7646992 |
| MT2A | Metallothionein‐2 | −0.75 | 0.8033204 |
| CABIN | Calcineurin‐binding protein Cabin 1 | −0.55 | 0.8033204 |
| PFKP | 6‐phosphofructokinase type C | −0.55 | 0.8033204 |
| SERTAD2 | SERTA domain‐containing protein 2 | −0.54 | 0.8033204 |
| EML2 | Echinoderm microtubule‐associated protein‐like 2 | −0.58 | 0.88365245 |
| ODF2 | Outer dense fiber of sperm tails 2 isoform 1 | −0.55 | 0.935632 |
| CREB3L2 | cAMP responsive element‐binding protein 3‐like protein 2 | −0.53 | 0.9758125 |
Differential expression was verified by quantitative real‐time polymerase chain reaction.
Table 2.
List of genes upregulated upon LGR5 knockdown.
| Gene symbol | Gene name | Fold change (Log2) | q‐value (%) |
|---|---|---|---|
| TMEFF2 | Transmembrane protein with EGF‐like and two follistatin‐like domains | 1.33 | 0 |
| ARL4A | ADP‐ribosylation factor‐like protein 4A. | 1.09 | 0 |
| CXCL11 | Small inducible cytokine B11 precursor | 0.84 | 0 |
| PKIA | cAMP‐dependent protein kinase inhibitor alpha | 0.83 | 0 |
| CTSA | Lysosomal protective protein precursor | 0.82 | 0 |
| ARL4A | ADP‐ribosylation factor‐like protein 4A. | 0.75 | 0 |
| ZNF789 | Zinc finger protein 789 isoform 1 | 0.68 | 0 |
| VAMP3 | Vesicle‐associated membrane protein 3 | 0.65 | 0 |
| PAFAH2 | Platelet‐activating factor acetylhydrolase 2, cytoplasmic | 0.57 | 0 |
| GPX7 | Glutathione peroxidase 7 precursor | 0.69 | 0.56403345 |
| ARL6IP1 | ADP‐ribosylation‐like factor 6‐ interacting protein 1 | 0.57 | 0.56403345 |
| LARP7 | La‐related protein 7 | 0.56 | 0.56403345 |
| ST7 | Suppression of tumorigenicity 7 isoform a | 0.50 | 0.56403345 |
| COL4A1 | Collagen alpha‐1(IV) chain precursor | 0.94 | 0.64136064 |
| CDKN1B | Cyclin‐dependent kinase inhibitor 1B | 0.66 | 0.6518747 |
| BCAT2 | Branched‐chain‐amino‐acid aminotransferase, mitochondrial precursor | 0.79 | 0.7796933 |
| CDH19 | Cadherin‐19 precursor. | 0.61 | 0.7796933 |
| SH3BGRL | SH3 domain‐binding glutamic acid‐rich‐like protein. | 0.74 | 0.88365245 |
| LASS2 | LAG1 longevity assurance homolog 2 | 0.68 | 0.88365245 |
| ZHX1 | Zinc fingers and homeoboxes protein 1. | 0.51 | 0.88365245 |
| DNAJB9 | DnaJ homolog subfamily B member 9 | 0.59 | 0.935632 |
| C7orf25 | UPF0415 protein C7orf25. | 0.51 | 0.935632 |
| CXCL10 | Small inducible cytokine B10 precursor | 1.22 | 0.981836 |
| HN1 | Hematological and neurological expressed 1 protein | 0.68 | 0.981836 |
| NOVA1 | Neuro‐oncological ventral antigen 1 | 0.58 | 0.981836 |
| BCL2L12 | Bcl‐2‐like 12 protein | 0.54 | 0.981836 |
| PSL2 | Protein SPP‐like 2A | 0.51 | 0.981836 |
ADP = adenosine diphosphate; cAMP = cyclic adenosine monophosphate; EGF = epidermal growth factor; SPP = signal peptide peptidase.
LGR5 expression correlates with tumor malignancy and is associated with glioblastoma prognosis
Previous reports have established a direct link between patient outcome and levels of expression of putative stem cell markers, such as nestin and CD133 39, 40, 41. In order to study its relevance as potential prognostic marker, LGR5 protein expression was analyzed by immunohistochemistry on a tissue microarray containing tissues derived from 283 different astrocytic glioma samples of WHO grades II–IV (Figure 5A). We identified 34 and 111 cases classified as score 1 and 2, respectively, and defined as low‐LGR5 expressing group, as well as a high‐LGR5 expressing group encompassing 100 and 9 samples classified as score 3 and 4, respectively.
Figure 5.
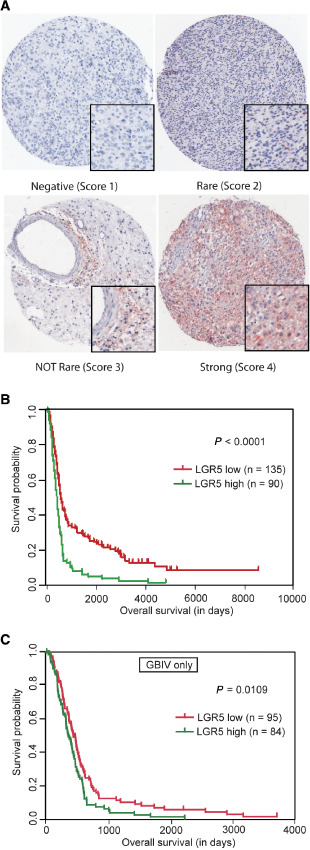
Expression of LGR5 in gliomas. A. Representative immunohistochemistry staining of LGR5 on tissue microarrays. B. Kaplan–Meier analysis showing the significant association of LGR5 expression with overall survival rate in all glioma tumors (P < 0.0001). Low‐ and high‐expression groups were separated according to the strength of the staining. Score 1 and 2 were grouped and considered as low expression. Score 3 and 4 represented the sections with a high LGR5 protein expression. C. Kaplan–Meier analysis showing the association of LGR5 expression with overall survival in patients with glioblastoma multiforme grade IV (P = 0.0109).
Interestingly, LRG5 expression correlated with tumor aggressiveness (Pearson's correlation coefficient 0.4, P < 0.001) and was higher in glioblastomas (WHO grade IV) as compared with WHO grades II and III astrocytomas, with a high LGR5 expression in 47% of glioblastomas, but only in 13% of WHO grades II and III astrocytomas (Table 3). These results indicate that LGR5 expression increases with malignancy. To further corroborate a function of LGR5 in tumor progression, we investigated the association of LGR5 protein expression with patient survival. Kaplan–Meier analysis showed significant correlation of LGR5 expression with shorter survival (P < 0.0001, Figure 5B). Remarkably, when the analysis was restricted to glioblastomas, significant correlation between overall survival and LGR5 protein expression was also observed (P = 0.0109, Figure 5C), indicating that LGR5 protein expression is a prognostic marker in glioblastoma. The association with adverse survival was even more pronounced after adjusting for age and gender, two potential clinical confounders (P = 0.002).
Table 3.
Expression of LGR5 in human gliomas.
| Clinical grading | LGR5 expressiona | |
|---|---|---|
| Low (%) | High (%) | |
| WHO grade II | 87 | 13 |
| WHO grade III | 86 | 14 |
| WHO grade IV | 53 | 47 |
LGR5 expression level of the tumor sections is defined as low when less than 10% of the cells are positive for LGR5. When more than 10% of the tumor sections is positively stained, LGR5 expression is considered as high.
WHO = World Health Organization.
Discussion
Here, we demonstrate that LGR5, a stem cell marker in various tissues, is highly expressed in brain CSCs in vitro, when compared with astrocytes and normal brain extracts. Notably, LGR5 depletion led to strong induction of apoptosis in brain CSCs, indicating a pro‐survival role of LGR5 for this type of stem cells. Moreover, LGR5 expression was reduced upon cell differentiation by adding serum and ATRA. Together, these data indicate a preferential expression and function of LGR5 in CSCs.
Several studies have shown the correlation of stem cell marker expression, such as CD133, with the clinical outcome in glioma patients 39, 40, 41. In a large panel of glioma sections, we observed that the proportion of cells expressing LGR5 protein increases with tumor grade. Moreover, LGR5 expression in glioblastoma samples was associated with worse clinical outcome, suggesting that content of LGR5‐positive cells within each tumor might affect tumor aggressiveness or resistance to therapy. These results indicate that LGR5 could be used as a novel prognostic marker for glioma patients.
By microarray analysis, we demonstrated that knockdown of LGR5 leads to downregulation of L1CAM expression in glioblastoma cells. Interestingly, L1CAM has previously been implicated in CSC maintenance as L1CAM inhibition blocked sphere‐forming activity and induced apoptosis in glioblastoma stem cells 3. As L1CAM is also one of the downstream target genes of the Wnt pathway 18, we tested whether LGR5 knockdown attenuates Wnt pathway signaling. However, we did not find any other Wnt pathway target gene, such as CCND1, cMYC or AXIN, to be downregulated by LGR5 knockdown. L1CAM is also known as an angiogenic gene that is induced by hypoxic treatment 28. Indeed, we observed several hypoxia‐related genes downregulated by LGR5 knockdown in spheroid culture, including VEGFA, CA9, NDRG1, ALDOC, PGK1 and PFKFB4. Hypoxia‐related signaling has been reported as an essential pathway for glioblastoma stem cell maintenance in vitro and in vivo 21, 23, 27, 33. However, we showed that the expression of these hypoxia‐responsive genes was decreased because of the reduced capacity of the LGR5‐knockdown CSCs to form spheres as compared with negative control. By using an adherent stem cell culture system, we demonstrated that L1CAM was the only verified gene that showed a significant downregulation upon LGR5 silencing in both in vitro systems.
CD133 is known to be a CSC marker of glioblastoma 35, 38, whereas it is reported that the CD133 expression is not always required for glioblastoma stem‐like cells 6, 30. Interestingly, we observed that a subpopulation of CD133+ cells in glioblastomas show higher LGR5 expression. This co‐localization implies that the combined usage of CD133 and LGR5 as stem cell markers might be useful for the specific isolation of brain CSCs from fresh tumor samples. However, the lack of antibodies, which recognize the extracellular domain of the native protein of LGR5 for living cell sorting impedes fluorescence‐activated cell sorting (FACS)‐based isolation and analysis of CD133/LGR5‐positive subpopulations of CSCs.
Taken together, our data suggest that LGR5 is indispensable for the propagation and survival of brain CSCs in vitro. In addition, LGR5 expression level increases with glioma progression and correlates with adverse outcome, suggesting that the pro‐survival and pro‐proliferating functions of LGR5 in CSCs would be activated preferentially in less‐differentiated gliomas. Further efforts to characterize the physiological role of LGR5 in vivo might unveil additional aspects of the biology of brain CSCs.
Conflict of Interest
The authors declare that they have no conflict of interest.
Supporting information
Figure S1. LGR5 depletion induces apoptosis in another brain CSC line, NCH441 cells. A. qRT‐PCR analysis of LGR5 mRNA expression in NCH441 cells transduced with lentiviral nontarget control shRNA (N.T.) and LGR5 shRNA (sh‐LGR5). B. Left panel; Phase contrast images of NCH441 cells 7 days after the transduction with nontarget (N.T.) and LGR5 lentiviral shRNA. Scale bar; 50 μm. Right panel; Macroscopic images in 6 well plates of NCH441k cells 9 days after the transduction with nontarget and LGR5 lentiviral shRNA. C. Validation of the apoptosis phenotype upon LGR5 silencing by PI staining and Sub‐G1 assay in NCH441k.
Figure S2. LGR5‐silenced brain CSCs could not form spheres due to massive cell death. Macroscopic images of NCH421k cells 9 days after the transduction with nontarget (left panel) and LGR5 lentiviral shRNA (right panel) in a 6 well plate.
Table S1. List of primers used for qRT‐PCR.
Table S2. Patient characteristics of astrocytic glioma samples on the tissue microarrays (TMAs).
Acknowledgments
This work was supported by the German Research Foundation (DFG; LI406/12‐1), as well as the German Federal Ministry of Education and Research (BMBF) within the National Genome Research Network NGFNplus (01GS0883, 01GS0884), and a stipend from the Alexander von Humboldt foundation (S.N.). We thank Karsten Richter for useful discussion and support in confocal laser scanning microscopy. We thank Laura Puccio, Frauke Devens, Magdalena Schlotter and Stefanie Hofmann for their technical support.
References
- 1. Alcantara Llaguno S, Chen J, Kwon CH, Jackson EL, Li Y, Burns DK et al (2009) Malignant astrocytomas originate from neural stem/progenitor cells in a somatic tumor suppressor mouse model. Cancer Cell 15:45–56. [DOI] [PMC free article] [PubMed] [Google Scholar]
- 2. Bao S, Wu Q, McLendon RE, Hao Y, Shi Q, Hjelmeland AB et al (2006) Glioma stem cells promote radioresistance by preferential activation of the DNA damage response. Nature 444:756–760. [DOI] [PubMed] [Google Scholar]
- 3. Bao S, Wu Q, Li Z, Sathornsumetee S, Wang H, McLendon RE et al (2008) Targeting cancer stem cells through L1CAM suppresses glioma growth. Cancer Res 68:6043–6048. [DOI] [PMC free article] [PubMed] [Google Scholar]
- 4. Barker N, van Es JH, Kuipers J, van den Kujala P, Born M, Cozijnsen M et al (2007) Identification of stem cells in small intestine and colon by marker gene LGR5. Nature 449:1003–1007. [DOI] [PubMed] [Google Scholar]
- 5. Barker N, Huch M, van de Kujala P, Wetering M, van Snippert HJ, Es JH et al (2010) LGR5(+ve) stem cells drive self‐renewal in the stomach and build long‐lived gastric units in vitro. Cell Stem Cell 6:25–36. [DOI] [PubMed] [Google Scholar]
- 6. Beier D, Hau P, Proescholdt M, Lohmeier A, Wischhusen J, Oefner PJ et al (2007) CD133(+) and CD133(–) glioblastoma‐derived cancer stem cells show differential growth characteristics and molecular profiles. Cancer Res 67:4010–4015. [DOI] [PubMed] [Google Scholar]
- 7. Calabrese C, Poppleton H, Kocak M, Hogg TL, Fuller C, Hamner B et al (2007) A perivascular niche for brain tumor stem cells. Cancer Cell 11:69–82. [DOI] [PubMed] [Google Scholar]
- 8. Campos B, Wan F, Farhadi M, Ernst A, Zeppernick F, Tagscherer KE et al (2010) Differentiation therapy exerts antitumor effects on stem‐like glioma cells. Clin Cancer Res 16:2715–2728. [DOI] [PubMed] [Google Scholar]
- 9. Carmon KS, Gong X, Lin Q, Thomas A, Liu Q (2011) R‐spondins function as ligands of the orphan receptors LGR4 and LGR5 to regulate Wnt/beta‐catenin signaling. Proc Natl Acad Sci U S A 108:11452–11457. [DOI] [PMC free article] [PubMed] [Google Scholar]
- 10. Chirasani SR, Sternjak A, Wend P, Momma S, Campos B, Herrmann IM et al (2010) Bone morphogenetic protein‐7 release from endogenous neural precursor cells suppresses the tumourigenicity of stem‐like glioblastoma cells. Brain 133(Pt 7):1961–1972. [DOI] [PubMed] [Google Scholar]
- 11. Clark PA, Treisman DM, Ebben J, Kuo JS (2007) Developmental signaling pathways in brain tumor‐derived stem‐like cells. Dev Dyn 236:3297–3308. [DOI] [PubMed] [Google Scholar]
- 12. de Lau W, Barker N, Low TY, Koo BK, Li VS, Teunissen H et al (2011) LGR5 homologues associate with Wnt receptors and mediate R‐spondin signalling. Nature 476:293–297. [DOI] [PubMed] [Google Scholar]
- 13. Dictus C, Tronnier V, Unterberg A, Herold‐Mende C (2007) Comparative analysis of in vitro conditions for rat adult neural progenitor cells. J Neurosci Methods 161:250–258. [DOI] [PubMed] [Google Scholar]
- 14. Ernst A, Hofmann S, Ahmadi R, Becker N, Korshunov A, Engel F et al (2009) Genomic and expression profiling of glioblastoma stem cell‐like spheroid cultures identifies novel tumor‐relevant genes associated with survival. Clin Cancer Res 15:6541–6550. [DOI] [PubMed] [Google Scholar]
- 15. Freese JL, Pino D, Pleasure SJ (2010) Wnt signaling in development and disease. Neurobiol Dis 38:148–153. [DOI] [PMC free article] [PubMed] [Google Scholar]
- 16. Galli R, Binda E, Orfanelli U, Cipelletti B, Gritti A, De Vitis S et al (2004) Isolation and characterization of tumorigenic, stem‐like neural precursors from human glioblastoma. Cancer Res 64:7011–7021. [DOI] [PubMed] [Google Scholar]
- 17. Garcia JL, Perez‐Caro M, Gomez‐Moreta JA, Gonzalez F, Ortiz J, Blanco O et al (2010) Molecular analysis of ex‐vivo CD133+ GBM cells revealed a common invasive and angiogenic profile but different proliferative signatures among high grade gliomas. BMC Cancer 10:454. [DOI] [PMC free article] [PubMed] [Google Scholar]
- 18. Gavert N, Conacci‐Sorrell M, Gast D, Schneider A, Altevogt P, Brabletz T, Ben‐Ze'ev A (2005) L1, a novel target of beta‐catenin signaling, transforms cells and is expressed at the invasive front of colon cancers. J Cell Biol 168:633–642. [DOI] [PMC free article] [PubMed] [Google Scholar]
- 19. Gentleman RC, Carey VJ, Bates DM, Bolstad B, Dettling M, Dudoit S et al (2004) Bioconductor: open software development for computational biology and bioinformatics. Genome Biol 5:R80. [DOI] [PMC free article] [PubMed] [Google Scholar]
- 20. Glinka A, Dolde C, Kirsch N, Huang YL, Kazanskaya O, Ingelfinger D et al (2011) LGR4 and LGR5 are R‐spondin receptors mediating Wnt/beta‐catenin and Wnt/PCP signalling. EMBO Rep 12:1055–1061. [DOI] [PMC free article] [PubMed] [Google Scholar]
- 21. Goidts V, Bageritz J, Puccio L, Nakata S, Zapatka M, Barbus S et al (2012) RNAi screening in glioma stem‐like cells identifies PFKFB4 as a key molecule important for cancer cell survival. Oncogene 31:3235–3243. [DOI] [PubMed] [Google Scholar]
- 22. Haegebarth A, Clevers H (2009) Wnt signaling, LGR5, and stem cells in the intestine and skin. Am J Pathol 174:715–721. [DOI] [PMC free article] [PubMed] [Google Scholar]
- 23. Heddleston JM, Li Z, McLendon RE, Hjelmeland AB, Rich JN (2009) The hypoxic microenvironment maintains glioblastoma stem cells and promotes reprogramming towards a cancer stem cell phenotype. Cell Cycle 8:3274–3284. [DOI] [PMC free article] [PubMed] [Google Scholar]
- 24. Hemmati HD, Nakano I, Lazareff JA, Masterman‐Smith M, Geschwind DH, Bronner‐Fraser M, Kornblum HI (2003) Cancerous stem cells can arise from pediatric brain tumors. Proc Natl Acad Sci U S A 100:15178–15183. [DOI] [PMC free article] [PubMed] [Google Scholar]
- 25. Ille F, Sommer L (2005) Wnt signaling: multiple functions in neural development. Cell Mol Life Sci 62:1100–1108. [DOI] [PMC free article] [PubMed] [Google Scholar]
- 26. Jaks V, Barker N, van Kasper M, Es JH, Snippert HJ, Clevers H, Toftgard R (2008) LGR5 marks cycling, yet long‐lived, hair follicle stem cells. Nat Genet 40:1291–1299. [DOI] [PubMed] [Google Scholar]
- 27. Li Z, Bao S, Wu Q, Wang H, Eyler C, Sathornsumetee S et al (2009) Hypoxia‐inducible factors regulate tumorigenic capacity of glioma stem cells. Cancer Cell 15:501–513. [DOI] [PMC free article] [PubMed] [Google Scholar]
- 28. Ong LL, Li W, Oldigs JK, Kaminski A, Gerstmayer B, Piechaczek C et al (2010) Hypoxic/normoxic preconditioning increases endothelial differentiation potential of human bone marrow CD133+ cells. Tissue Eng Part C Methods 16:1069–1081. [DOI] [PubMed] [Google Scholar]
- 29. Patapoutian A, Reichardt LF (2000) Roles of Wnt proteins in neural development and maintenance. Curr Opin Neurobiol 10:392–399. [DOI] [PMC free article] [PubMed] [Google Scholar]
- 30. Pollard SM, Yoshikawa K, Clarke ID, Danovi D, Stricker S, Russell R et al (2009) Glioma stem cell lines expanded in adherent culture have tumor‐specific phenotypes and are suitable for chemical and genetic screens. Cell Stem Cell 4:568–580. [DOI] [PubMed] [Google Scholar]
- 31. Saeed AI, Bhagabati NK, Braisted JC, Liang W, Sharov V, Howe EA et al (2006) TM4 microarray software suite. Methods Enzymol 411:134–193. [DOI] [PubMed] [Google Scholar]
- 32. Salmaggi A, Boiardi A, Gelati M, Russo A, Calatozzolo C, Ciusani E et al (2006) Glioblastoma‐derived tumorospheres identify a population of tumor stem‐like cells with angiogenic potential and enhanced multidrug resistance phenotype. Glia 54:850–860. [DOI] [PubMed] [Google Scholar]
- 33. Seidel S, Garvalov BK, von Wirta V, Stechow L, Schanzer A, Meletis K et al (2010) A hypoxic niche regulates glioblastoma stem cells through hypoxia inducible factor 2 alpha. Brain 133 (Pt 4):983–995. [DOI] [PubMed] [Google Scholar]
- 34. Singh SK, Clarke ID, Terasaki M, Bonn VE, Hawkins C, Squire J, Dirks PB (2003) Identification of a cancer stem cell in human brain tumors. Cancer Res 63:5821–5828. [PubMed] [Google Scholar]
- 35. Singh SK, Hawkins C, Clarke ID, Squire JA, Bayani J, Hide T et al (2004) Identification of human brain tumour initiating cells. Nature 432:396–401. [DOI] [PubMed] [Google Scholar]
- 36. Van der Flier LG, Sabates‐Bellver J, Oving I, Haegebarth A, De Palo M, Anti M et al (2007) The intestinal Wnt/TCF signature. Gastroenterology 132:628–632. [DOI] [PubMed] [Google Scholar]
- 37. Van Gelder RN, von Zastrow ME, Yool A, Dement WC, Barchas JD, Eberwine JH (1990) Amplified RNA synthesized from limited quantities of heterogeneous cDNA. Proc Natl Acad Sci U S A 87:1663–1667. [DOI] [PMC free article] [PubMed] [Google Scholar]
- 38. Vescovi AL, Galli R, Reynolds BA (2006) Brain tumour stem cells. Nat Rev Cancer 6:425–436. [DOI] [PubMed] [Google Scholar]
- 39. Wan F, Herold‐Mende C, Campos B, Centner F‐C, Dictus C, Becker N et al (2011) Expression of stem cell‐associated markers and survival in astrocytic gliomas. Biomarkers 16: 136–143. [DOI] [PubMed] [Google Scholar]
- 40. Zeppernick F, Ahmadi R, Campos B, Dictus C, Helmke BM, Becker N et al (2008) Stem cell marker CD133 affects clinical outcome in glioma patients. Clin Cancer Res 14:123–129. [DOI] [PubMed] [Google Scholar]
- 41. Zhang M, Song T, Yang L, Chen R, Wu L, Yang Z, Fang J (2008) Nestin and CD133: valuable stem cell‐specific markers for determining clinical outcome of glioma patients. J Exp Clin Cancer Res 27:85. [DOI] [PMC free article] [PubMed] [Google Scholar]
Associated Data
This section collects any data citations, data availability statements, or supplementary materials included in this article.
Supplementary Materials
Figure S1. LGR5 depletion induces apoptosis in another brain CSC line, NCH441 cells. A. qRT‐PCR analysis of LGR5 mRNA expression in NCH441 cells transduced with lentiviral nontarget control shRNA (N.T.) and LGR5 shRNA (sh‐LGR5). B. Left panel; Phase contrast images of NCH441 cells 7 days after the transduction with nontarget (N.T.) and LGR5 lentiviral shRNA. Scale bar; 50 μm. Right panel; Macroscopic images in 6 well plates of NCH441k cells 9 days after the transduction with nontarget and LGR5 lentiviral shRNA. C. Validation of the apoptosis phenotype upon LGR5 silencing by PI staining and Sub‐G1 assay in NCH441k.
Figure S2. LGR5‐silenced brain CSCs could not form spheres due to massive cell death. Macroscopic images of NCH421k cells 9 days after the transduction with nontarget (left panel) and LGR5 lentiviral shRNA (right panel) in a 6 well plate.
Table S1. List of primers used for qRT‐PCR.
Table S2. Patient characteristics of astrocytic glioma samples on the tissue microarrays (TMAs).