

Abstract
The accumulation of extracellular matrix (ECM) and glial scar formation are considered important factors for the failure of regeneration in central nervous system (CNS) injury and multiple sclerosis. Theiler's murine encephalomyelitis (TME) as a model of multiple sclerosis served to evaluate the spatio‐temporal course of ECM alterations in demyelinating conditions. Microarray analysis revealed only mildly upregulated gene expression of ECM molecules, their biosynthesis pathways and pro‐fibrotic factors, while upregulation of matrix remodeling enzymes was more prominent. Immunohistochemistry demonstrated progressive accumulation of chondroitin sulfate proteoglycans, glycoproteins and collagens within demyelinated TME lesions, paralleling the development of astrogliosis. Deposition of collagen IV, laminin, perlecan and tenascin‐C started 28 days postinfection (dpi), collagen I, decorin, entactin and neurocan accumulated from 56 dpi on, and fibronectin from 98 dpi on. The basement membrane (BM) molecules collagen IV, entactin, fibronectin, laminin and perlecan showed perivascular and parenchymal deposition, while the non‐BM components collagen I, decorin, neurocan and tenascin‐C only accumulated in a nonvascular pattern in demyelinated areas. Contrary, phosphacan expression progressively decreased during TME. The immunoreactivity of aggrecan and brevican remained unchanged. The spatio‐temporal association of matrix accumulation with astrogliosis suggests a mainly astrocytic origin of ECM deposits, which in turn may contribute to remyelination failure in TME.
Keywords: demyelination, extracellular matrix, glial scar, immunohistochemistry, microarray analysis, Theiler's murine encephalomyelitis
INTRODUCTION
The infection of susceptible mouse strains with low neurovirulent strains of Theiler's murine encephalomyelitis virus (TMEV) leads to demyelinating lymphohistioplasmacytic leukomyelitis, which pathogenetically is in part attributed to a delayed‐type hypersensitivity reaction 9, 62. Chronic demyelinated lesions of Theiler's murine encephalomyelitis (TME) are characterized by mild inflammation and an increased number of activated astrocytes whereas remyelination processes are insufficient. These findings closely resemble the morphologic changes in other demyelinating diseases such as experimental allergic encephalomyelitis (EAE) in rats and mice as well as chronic progressive multiple sclerosis (MS) in humans 44, 50, 53. Failure of successful remyelination in MS, considered to be a main factor for the progressive clinical course, is largely based on the lack of mature myelinating oligodendrocytes within the MS plaques (60). This parallels recent findings of impaired oligodendroglial differentiation in chronic TME lesions (53). Intralesional accumulation of the extracellular matrix molecule hyaluronan was shown to inhibit oligodendrocyte maturation in MS whereas the respective mechanism in TME remains unclear so far 3, 53. However, in general, various components of the extracellular matrix (ECM) have a manifold impact on central nervous system (CNS) regeneration as demonstrated in different spontaneous and experimental conditions. Activation of resident glial and meningeal cells leads to upregulation of their matrix secretion and subsequent intralesional accumulation of ECM, resulting in the so‐called glial scar, which is considered to hamper regeneration substantially (8). Accumulating scar matrix is biochemically dominated by chondroitin sulfate proteoglycans (CSPGs) such as aggrecan, brevican, decorin, neurocan and phosphacan, as well as collagen I and the glycoprotein tenascin‐C. According to their physiological tissue distribution, these aforementioned molecules can be grouped as parenchymal or non‐basement membrane (BM) ECM molecules. Additionally, explicit BM components including collagen IV, entactin, fibronectin and perlecan are involved in the formation of a glial scar, where they are secreted by both endothelial cells and perivascular astrocytes. As these BM molecules contribute to blood–brain barrier (BBB) integrity and permeability, changes in their molecular composition or expression level influence the infiltration of inflammatory cells 37, 55. Rodent models of spinal cord injury served to discover a distinct spatio‐temporal course of ECM synthesis and deposition following tissue damage. They thereby allowed to specify the impact of particular molecules to the overall properties of the glial scar and to modify scar formation with regard to future therapeutic approaches 17, 18, 20, 22, 43, 46. Similarly in demyelinated MS plaques, different molecular patterns of ECM deposition were observed despite upregulation of important matrix remodeling enzymes such as matrix metalloproteinases (MMPs) 16, 25, 30, 40, 42, 48, 58. Thus, a crucial influence of ECM alterations on disease development must be assumed and dealt with when developing new therapeutic approaches. However, a detailed decoding of temporal or spatial processes during glial scar formation remains difficult in MS because of the spontaneous and unpredictable nature of this disease and the shortage of samples from early lesions. In contrast, TME features a progressive demyelination with intralesionally increased numbers of activated putatively ECM secreting astrocytes, concurrent elevation of MMP levels and only insufficient remyelination. Thus, TME represents a very suitable model to elucidate spatio‐temporal aspects of glial scar formation in chronic inflammatory and demyelinating CNS lesions. Considering recently published data suggesting a contribution of the BBB to TME pathology (32), as well as the morphological features previously mentioned, we hypothesize that chronic demyelinating TME is accompanied by profound alterations in spinal cord ECM and that these in turn contribute to a failure of regeneration. Therefore, the aims of the present study were twofold: (i) to characterize the composition and distribution of spinal cord ECM during TMEV infection; and (ii) to identify underlying molecular mechanisms and transcriptional changes.
MATERIALS AND METHODS
Animal experiments
Female SJL/JHanHsd mice (Harlan Winkelmann, Borchen, Germany) were used in this study. At the age of 5 weeks, the animals were inoculated into the right cerebral hemisphere with 1.63 × 10⁶ plaque‐forming units/mouse of the BeAn strain of TMEV as described (53). Mock‐infected mice (placebos) served as a control for all experiments. Groups of five to six TMEV‐infected and mock‐infected mice were killed 1 h (0 days) and 7, 14, 28, 42, 56, 98 and 196 days post infection (dpi) by administering an overdose of medetomidine and ketamine (53). The vertebral column was immediately removed and dissected transversally. Segments of the cervical, thoracic and lumbar vertebral cord were fixed in 10% formalin for 24 h, decalcified in 10% ethylenediaminetetraacetic acid disodium solution (EDTA) for 48 h, and embedded in paraffin wax. The remaining spinal cord was removed via complete laminectomy, immediately embedded in Tissue‐Tec® O.C.T.™ (Sakura, Zoeterwoude, The Netherlands), snap frozen and stored at −80°C (53). Frozen and formalin‐fixed tissue from 0, 7, 14, 28, 56, 98 and 196 dpi was used for histochemical and immunohistochemical examinations. For RNA isolation and microarray hybridization, frozen tissue from 14, 42, 98 and 196 dpi was used as described (54). All animal experiments were approved by the local authorities (Bezirksregierung Hannover, Germany, permission number 509c‐42502‐02/589, and Niedersächsisches Landesamt für Verbraucherschutz und Lebensmittelsicherheit, Oldenburg, Germany, permission number 33‐42502‐05/963).
Histochemical examination and light microscopic evaluation
Serial transversal sections of formalin‐fixed, paraffin‐embedded thoracic spinal cord were stained with hematoxylin and eosin as well as luxol fast blue‐cresyl violet (LFB). Furthermore, histochemical stainings such as azan stain (27) and a modified picrosirius red (PSR) stain 10, 15 were applied to detect extracellular substances. For the latter, briefly, sections were deparaffinized and rehydrated. After dipping the sections in 3% acetic acid, the specimens were stained in 1% alcian blue solution pH 2.5 (1 g alcian blue 8GX in 100 mL 3% acetic acid supplemented by 1 crystal of thymol) for 30 minutes. Thereafter, sections were dipped repeatedly in 70% ethanol, and were then stained in an aldehyde fuchsin solution for 45 minutes. Following dipping in 70% ethanol and rinsing in running tap water, the specimens were stained in Weigert's hematoxylin, consisting of ferric chloride solution and 1% hematoxylin in absolute alcohol in equal amounts, for 10 minutes. After rinsing again in running tap water, sections were stained in 0.1% PSR solution (0.1 g sirius red F3B combined with 100 mL saturated aqueous picric acid) for 30 minutes. Finally, slides were dipped in 0.01% hydrochloric acid for 30 s, followed by dehydration and mounting. This staining procedure resulted in a purple color of sulfated mucosubstances like proteoglycans and glycoproteins, a blue labeling of carboxylated mucosubstances like hyaluronan, and a red decoration of collagens. The latter additionally exhibited yellow to red birefringency under polarized light (35).
For characterization of TMEV‐induced lesions, hematoxylin and eosin as well as LFB‐stained sections were evaluated by assessing the degree of meningitis, myelitis and demyelination semi‐quantitatively as described (52). The extent of histochemical staining reaction was determined morphometrically. Slides were digitalized with a color video camera (Color View II, 3.3 megapixel CCD; Soft Imaging System, Münster, Germany) mounted on an Axiophot microscope (Zeiss, Oberkochen, Germany) with 2.5× objective. The positive area for each staining method was measured after manually outlining the total white matter area using the analySIS 3.1 software (Soft Imaging System). Results were given as percentage calculated as the positively labeled area divided by the total white matter area.
RNA isolation and microarray hybridization
RNA was isolated from snap‐frozen spinal cord tissue using the RNeasy Mini Kit (Qiagen, Hilden, Germany), amplified and labeled with the MessageAmp II‐Biotin Enhanced Kit (Ambion, Austin, TX, USA), and microarray hybridization was performed using the Affymetrix mouse genome 430 2.0 array as described previously (54). MIME compliant data sets have been published in the ArrayExpress database (http://www.ebi.ac.uk/microarray‐as/ae/). Background adjustment and normalization of the microarray data were performed employing the RMA algorithm 5, 54.
Selection of ECM‐associated genes
Further analysis focused on a list of candidate genes that are considered to be associated with synthesis and degradation of ECM or fibrosis. The complete list comprised 350 probe sets representing 170 genes (Supporting Information Table S1) with 67 genes directly coding for ECM molecules. Sixty‐six enzymes belonging to the synthesis or degradation cascades of ECM molecules were extracted from the KEGG PATHWAY database (21) and published literature (34). These comprised 18 genes involved in chondroitin sulfate biosynthesis, 14 genes for heparan sulfate biosynthesis, 14 genes for keratan sulfate biosynthesis, 3 genes for hyaluronan synthases and 17 genes coding for enzymes involved in glycosaminoglycan degradation. Additionally, the list contained 24 genes of ECM modifying enzymes comprising 20 MMPs and four tissue inhibitors of metalloproteinases (TIMPs). Finally, 13 genes coding for pro‐ and anti‐fibrotic factors with known importance in CNS tissue were enclosed 36, 38, 47, 61.
Immunohistochemical examination
In order to validate the obtained microarray results and to specify the spatio‐temporal course of ECM deposition, immunohistochemistry was performed. The antibodies used for immunohistochemistry are listed in Table 1. Detection of glial fibrillary acidic protein (GFAP), aggrecan, collagen I and IV, decorin, fibronectin and laminin was conducted on formalin‐fixed, paraffin‐embedded sections employing an avidin‐biotin‐peroxidase complex method as described 52, 53. Briefly, sections were dewaxed and rehydrated through graded alcohols. Endogenous peroxidase was quenched with 0.5% hydrogen peroxide in methanol. For detection of collagen I and collagen IV, sections were heated in 10 mM sodium citrate buffer pH 6.0 for 15 minutes in a microwave oven (800 W). For demonstration of aggrecan, an enzymatic pretreatment was performed by using chondroitinase ABC from Proteus vulgaris (Sigma‐Aldrich Chemie GmbH, Taufkirchen, Germany; 0.5 U/mL in 0.05 M TRIS buffer pH 8.0) for 90 minutes at 37°C (7). Sections were incubated in goat or rabbit normal serum diluted 1:5 in phosphate‐buffered saline (PBS) for 20 minutes to block nonspecific binding sites before incubation with the primary antibody at 4°C overnight. Secondary antibodies were diluted 1:200 in PBS and applied for 30 minutes, unless stated otherwise in Table 1. Finally, sections were incubated with the avidin‐biotin‐peroxidase‐complex (ABC; Vector Laboratories, Inc., Burlingame, CA, USA) for 30 minutes. Positive antigen‐antibody reactions were visualized by incubation in 3,3‐diaminobenzidine‐tetrahydrochloride (DAB) and 0.03% hydrogen peroxide in PBS for 10 minutes followed by slight counterstaining with Mayer's hemalum.
Table 1.
Source and immunogen of primary antibodies, pretreatment, blocking serum and secondary antibodies used for immunohistochemical detection of GFAP, extracellular matrix molecules and von Willebrand factor. Abbreviations: Dako ARK = Dako Animal Research Kit™ Peroxidase (DakoCytomation GmbH, Hamburg, Germany); GFAP = glial fibrillary acidic protein; GaR‐b = goat anti‐rabbit immunoglobulins biotinylated (Vector Laboratories, Inc., Burlingame, CA, USA); NGS = normal goat serum; NRS = normal rabbit serum; RaG‐PO = rabbit anti‐goat immunoglobulins peroxidase‐conjugated (DakoCytomation GmbH); RaR‐b = rabbit anti‐rat immunoglobulins biotinylated (Vector Laboratories, Inc.); PBS = phosphate‐buffered saline.
| Primary antibody | Source of primary antibody; catalog no. | Immunogen | Tissue fixation | Pretreatment* | Blocking serum† | Dilution of primary antibody§ | Secondary antibody‡ |
|---|---|---|---|---|---|---|---|
| Polyclonal rabbit anti‐GFAP | Dako‐Cytomation GmbH, Hamburg, Germany; # Z0334 | GFAP isolated from bovine spinal cord | Formalin | None | NGS | 1:2000 | GaR‐b |
| Polyclonal rabbit anti‐aggrecan | Chemicon Europe Ltd., Hampshire, UK; # AB1031 | GST fusion protein containing AA 1177–1326 of mouse aggrecan | Formalin | Chondroitinase digestion | NGS | 1:400 | GaR‐b |
| Monoclonal mouse anti‐brevican, clone 2 | BD Biosciences, Heidelberg, Germany; # 610894 | Amino acids 232–394 of rat brevican | Formalin | Citrate buffer, microwave heating | None | 1:200 | Dako ARK |
| Polyclonal rabbit anti‐murine collagen I | Abcam Ltd., Cambridge, UK; # ab21286 | Collagen I extracted and purified from mouse skin | Formalin | Citrate buffer, microwave heating | NGS | 1:300 | GaR‐b |
| Polyclonal rabbit anti‐murine collagen IV | Abcam Ltd.; # ab19808 | Collagen IV extracted and purified from mouse tumor tissues | Formalin | Citrate buffer, microwave heating | NGS | 1:200 | GaR‐b |
| Polyclonal goat anti‐murine decorin | R&D Systems GmbH, Wiesbaden, Germany; # AF1060 | NS0‐derived recombinant mouse decorin | Formalin | None | NRS | 1:200 | RaG‐PO¶ |
| Monoclonal rat anti‐entactin, clone ELM1 | Neomarkers, Fremont, CA, USA; # RT‐797‐P0 | Murine EHS laminin preparation | Frozen | None | NRS | 1:2000 | RaR‐b |
| Polyclonal rabbit anti‐human fibronectin | Sigma‐Aldrich Chemie GmbH, Taufkirchen, Germany; # F3648 | Purified human fibronectin | Formalin | None | NGS | 1:1000 | GaR‐b |
| Polyclonal rabbit anti‐laminin | Sigma‐Aldrich Chemie GmbH; # L9393 | Laminin purified from basement membrane of EHS mouse sarcoma | Formalin | None | NGS | 1:100 | GaR‐b |
| Monoclonal mouse anti‐neurocan; clone 650.24 | Chemicon Europe Ltd.; # MAB5212 | Not specified | Formalin | None | None | 1:50 | Dako ARK |
| Monoclonal rat anti‐heparan sulphate proteoglycan large (perlecan), clone A7L6 | Abcam Ltd.; # ab2501 | High molecular mass material derived from EHS mouse sarcoma matrix | Frozen | None | NRS | 1:1000 | RaR‐b |
| Monoclonal mouse anti‐phosphacan, clone 122.2 | Chemicon Europe Ltd.; # MAB5210 | Not specified | Formalin | None | None | 1:40 | Dako ARK |
| Monoclonal rat anti‐tenascin C, clone MTn‐12 | Abcam Ltd.; # ab6346 | Purified full‐length murine tenascin‐C | Frozen | None | NRS | 1:8000 | RaR‐b |
| Polyclonal rabbit anti‐von Willebrand factor | Dako‐Cytomation GmbH; # A0082 | Von Willebrand factor isolated from human plasma | Formalin | Citrate buffer, microwave heating | NGS | 1:500 | GaR‐b |
Performance of pretreatment, see Materials and Methods.
Diluted 1:5 in PBS.
Diluted 1:200 in PBS, incubation for 30 minutes at room temperature, unless otherwise stated.
Diluted in PBS containing 1% bovine serum albumin.
Diluted 1:100 in PBS, incubation for 45 minutes at room temperature.
Frozen sections were used for demonstration of entactin, perlecan and tenascin‐C. Slides were hydrated in PBS for 5 minutes and afterwards endogenous peroxidase was blocked with 0.5% hydrogen peroxide in PBS. The following steps were performed as described above.
Brevican, neurocan and phosphacan were detected employing the Dako Animal Research Kit™ Peroxidase (DakoCytomation GmbH, Hamburg, Germany) according to the manufacturer's recommendations (53).
As negative controls, primary antibodies were replaced by control serum or isotype‐specific antibodies directed against irrelevant antigens, respectively. Quantitative evaluation of ECM molecules was performed morphometrically as previously described for histochemically stained sections. The density of GFAP‐positive cells/mm2 was manually counted in the white matter using a calibrated 10‐fold reticle eyepiece and a 40‐fold objective (Olympus Europe, Hamburg, Germany). In every spinal cord section, randomly selected areas with a mean total area of 0.15 mm2 were evaluated for normal appearing white matter (NAWM) and lesioned white matter, respectively.
Immunohistochemical double‐labeling
In order to clarify the spatial relationship of BM molecule deposits and blood vessels, a double immunostaining for collagen IV and the endothelial cell marker von Willebrand factor (formerly factor VIII‐related antigen) was performed on selected formalin‐fixed, paraffin‐embedded sections from TMEV‐infected animals. Briefly, sections were dewaxed and rehydrated through graded alcohols, and endogenous peroxidase was quenched with 0.5% hydrogen peroxide in methanol. Then, sections were heated in 10 mM sodium citrate buffer pH 6.0 for 15 minutes in a microwave oven (800 W). After incubation in goat normal serum diluted 1:5 in PBS for 20 minutes to block nonspecific binding sites, the sections were incubated with anti‐von Willebrand factor immunoglobulins at 4°C overnight. The secondary antibody according to Table 1 was diluted 1:200 in PBS and applied for 30 minutes. Sections were incubated with ABC for 30 minutes, and positive antigen–antibody reactions were visualized by incubation in DAB and 0.03% hydrogen peroxide in PBS for 10 minutes. Afterwards, anti‐collagen IV immunoglobulins were applied at a dilution of 1:200 for 1 h at room temperature, followed by incubation with the secondary antibody and ABC as previously described. The collagen IV immunostaining was visualized by using HistoGreen (Linaris GmbH, Wertheim‐Bettingen, Germany).
Statistical analysis
Statistical analysis was performed using SPSS for Windows version 13.0 (SPSS Inc., Chicago, IL, USA). Regarding the microarray data, the gene expression values of each individual animal were used. Histochemical and immunohistochemical data were analyzed using the percentage values of the morphometric evaluation and the density values of cell counting. To all data, a time point specific Mann–Whitney U‐test was applied for detection of differences between mock‐ and TMEV‐infected mice. For comparison of cell density values in NAWM and lesions of TMEV‐infected mice, a Wilcoxon test was employed. Statistical significance was designated as P < 0.05 in all tests performed.
RESULTS
Morphology of TMEV‐induced spinal cord lesions
TMEV‐infected mice showed lymphohistioplasmacytic meningitis with multifocal to coalescing perivascular infiltrates from 7 dpi to 196 dpi, with highest severity at 28 dpi and 98 dpi. In addition, a multifocal to coalescing predominantly perivascular lymphohistioplasmacytic infiltration in spinal cord white matter was observed between 7 dpi and 196 dpi, reaching a peak at 98 dpi (Figure 1A,E). As the first sign of demyelination, scattered foci of myelinophagia were detected as early as 14 dpi. LFB revealed a progressive loss of myelin during TME lesion development between 28 dpi and 196 dpi. Demyelinated lesions were mainly present in the ventral and lateral funiculi of the spinal cord, and were not detected in any of the mock‐infected animals (Figure 1B,F).
Figure 1.

Histochemical findings after Theiler's murine encephalomyelitis virus (TMEV) infection. Serial sections of thoracic spinal cord of TMEV‐infected mice from 56 days postinfection (dpi; A–D) and 98 dpi (E–H) representing hematoxylin and eosin stain (A, E), luxol fast blue‐cresyl violet (LFB) stain (B, F), azan stain (C, G) and picrosirius red (PSR) stain (D, H). (A) At 56 dpi, moderate lymphohistiocytic meningitis and leukomyelitis are present with vacuolation of the white matter including loss of eosinophilia (asterisk), and myelinophagia. (B) LFB stain reveals moderate demyelination of the lesion (asterisk). (C) In the center of the lesion, there is a minimal accumulation of extracellular azan‐positive matrix (arrowhead). (D) PSR stain reveals a diffuse bluish to greenish extracellular labeling at the periphery (asterisk) and a red filamentous staining of extracellular matrix in the center of the lesion (arrowhead) at 56 dpi. (E) At 98 dpi, the white matter lesions exhibit only mild mononuclear inflammation but increased cellularity indicating gliosis (asterisk) with peripheral dilatation of myelin sheaths. (F) LFB stain demonstrates an almost complete loss of myelin in the white matter lesion (asterisk) with sparse preserved myelin at the periphery (arrowhead). (G) There is a dense meshwork of azan‐positive extacellular matrix deposits throughout the lesion. (H) Paralleling the azan labeling, PSR stain demonstrates large amounts of accumulating extracellular matrix. Scale bars = 100 µm.
GFAP immunohistochemistry for detection of astrocytes revealed an unchanged number of astrocytes and their processes in the gray and white matter of the spinal cord in mock‐infected mice. At 28 days after TMEV infection, intralesional astrocytes appeared activated, characterized by elongation and thickening of their processes. At subsequent time points, the number of GFAP‐positive astrocytes and the amount of their processes continuously increased (Figure 2A,E,I). Thus, there was a significantly higher density of GFAP‐positive cells within TMEV lesions at 98 dpi and 196 dpi compared with NAWM and mock‐infected mice (Figure 3).
Figure 2.

Immunohistochemical findings after Theiler's murine encephalomyelitis virus (TMEV) infection. Serial sections of thoracic spinal cord of TMEV‐infected mice from 56 days postinfection (dpi; A–D, same lesion as in Figure 1A–D), 98 dpi (E–H, same lesion as in Figure 1E–H; N–P, different animal) and 196 dpi (I–M), showing immunoreactivity for glial fibrillary acidic protein (GFAP; A, E, I), collagen IV (B, F), laminin (C, G), collagen I (D, H), fibronectin (J), decorin (K), neurocan (L), phosphacan (M), perlecan (N), entactin (O) and tenascin‐C (P). (A) At 56 dpi, intralesional GFAP‐positive cells show a reactive phenotype with thickened processes (asterisk). (B) Mild deposits of nonvessel‐associated collagen IV (arrowhead) are present in the demyelinated white matter lesion. (C) Laminin immunoreactivity is detected in minimal amounts (arrowhead) at 56 dpi. (D) Mild collagen I accumulation occurs in a lattice‐like pattern (arrowhead) in the center of the lesion. (E) At 98 dpi, an increased number of GFAP‐positive astrocytes is present in the demyelinated white matter lesion (asterisk). (F) Marked collagen IV deposits are detected in this lesion in a diffuse parenchymal distribution pattern at 98 dpi. (G) At 98 dpi, laminin is prominently accumulated throughout the demyelinated area. (H) A comparable, diffuse collagen I immunoreactivity is present intralesionally. (I) The white matter lesions contain a prominently increased number of GFAP‐positive cells with thickened processes at 196 dpi (asterisk). (J) Fibronectin immunoreactivity occurs diffusely throughout the lesion (asterisk) at 96 dpi. (K) A dense meshwork of decorin deposits is present intralesionally at 196 dpi. (L) Mild intralesional neurocan deposition occurs in a circular pattern around capillaries (arrowhead) at 196 dpi. (M) The prominent phosphacan expression in normal white matter is markedly reduced in a demyelinated lesion (asterisk) at 196 dpi. (N) At 98 dpi, prominent parenchymal and vessel‐associated perlecan deposits are present in a demyelinated white matter lesion. (O) Entactin is markedly accumulated throughout the same lesion with and without blood vessel association. (P) A lattice‐like pattern of tenascin‐C immunoreactivity is detected in the demyelinated area. Immunohistology, ABC method, DAB chromogen, slight counterstain with Mayer's hemalum. Nomarski differential interference contrast. Scale bars = 100 µm.
Figure 3.
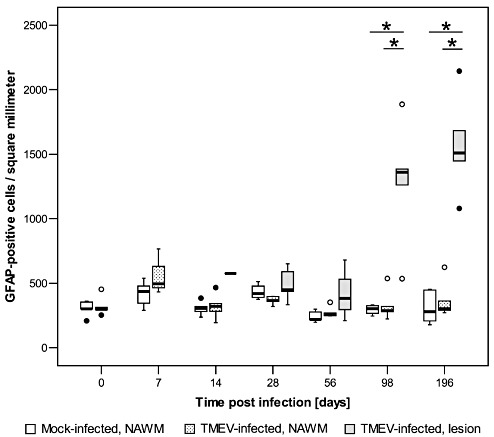
Density of astrocytes in the thoracic spinal cord of mice after Theiler's murine encephalomyelitis virus (TMEV) infection and mock infection, shown as glial fibrillary acidic protein (GFAP)‐positive cells per square millimeter of normal appearing white matter (NAWM; mock‐ and TMEV‐infected mice) and demyelinated white matter areas (lesion; TMEV‐infected mice). Box and whisker plots show median and quartiles with outliers and extreme values depicted as circles and filled circles, respectively. Following TMEV infection, the density of intralesional GFAP‐positive cells (astrocytes) was significantly increased at 98 dpi and 196 dpi compared with NAWM of TMEV‐ and mock‐infected mice. Significant differences between mock‐ and TMEV‐infected mice as revealed by a Mann–Whitney U test, and between NAWM and lesion in TMEV‐infected mice as detected by a Wilcoxon test are marked as follows: *P < 0.05.
Progressive deposition of ECM in TME lesions
Histochemical stains served to estimate the amount and distribution of ECM in normal and TME‐affected spinal cord. Within the spinal cord of mock‐infected mice, positive staining obtained by azan and PSR stain was restricted to meninges and blood vessel walls, and did not show any age‐related modifications until 196 dpi (Table 2). During the course of TME, prominent changes of the spinal cord ECM were observed, generally restricted to demyelinated white matter areas. Using azan stain, minimal amounts of ECM deposition were detected within demyelinated areas at 28 dpi following TMEV infection, characterized by a fine filamentous reaction pattern in the lesion center. With lesion progression, azan‐positive ECM accumulated intralesionally in a dense lattice‐like pattern (Figure 1C,G), frequently extending to the edge of the demyelinated area and resulting in a median of 1.47% positive area of total white matter area at 196 dpi, which differed significantly from 0.004% to 0.03% measured in mock‐infected animals (details in Table 2). With the modified PSR stain, two different staining patterns and colors were observed. As early as 28 dpi, a diffuse light bluish to greenish signal occurred within demyelinated lesions, occupying a median of 0.46% of total white matter area and indicating the presence of nonsulfated mucosubstances. At subsequent time points, this bluish reaction was only present at the lesions' margins or completely disappeared (Figure 1D). An additional red reticular staining indicative of collagens, proteoglycans and glycoproteins first appeared at 56 dpi in the lesions' center (Figure 1D,H). Progressive expansion of this red signal resulted in a median area percentage of 2.56% at 196 dpi with maximal values up to 3.7% of total white matter area (Table 2). Yellow to red birefringence of the red‐labeled structures using polarized light documented the contribution of collagen fibers to the accumulating matrix.
Table 2.
Morphometrically determined area of extracellular matrix molecule deposition in the thoracic spinal cord of mock‐ and TMEV‐infected mice. Abbreviations: PSR = picrosirius red stain; Mock = mock‐infected mice; TMEV = Theiler's murine encephalomyelitis virus‐infected mice; dpi = days post infection.
| Histochemical stain or immunohistochemically detected molecule | Positive area per total white matter area [%] | |||||
|---|---|---|---|---|---|---|
| 0 dpi | 7 dpi | |||||
| Mock | TMEV | P‐value | Mock | TMEV | P‐value | |
| Azan | 0.032 (0.010;0.091)† | 0.010 (0.003;0.015) | 0.082 | 0.013 (0.005;0.034) | 0.013 (0.006;0.022) | 1.000 |
| PSR, blue color | 0.000 (0.000;0.002) | 0.013 (0.000;0.099) | 0.082 | 0.002 (0.000;0.017) | 0.017 (0.005;0.026) | 0.167 |
| PSR, red color | 0.025 (0.000;0.084) | 0.000 (0.000;0.021) | 0.126 | 0.011 (0.020;0.019) | 0.003 (0.000;0.009) | 0.167 |
| Aggrecan | 0.004 (0.000;0.011) | 0.007 (0.000;0.122) | 0.931 | 0.017 (0.000;0.026) | 0.023 (0.007;0.066) | 0.548 |
| Brevican | 0.009 (0.000;0.033) | 0.008 (0.000;0.021) | 1.000 | 0.014 (0.005;0.023) | 0.011 (0.010;0.014) | 0.381 |
| Collagen I | 0.191 (0.046;0.589) | 0.100 (0.025;1.430) | 0.792 | 0.175 (0.102;0.252) | 0.060 (0.053;1.474) | 0.548 |
| Collagen IV | 1.990 (0.736;3.282) | 1.710 (1.307;4.073) | 0.762 | 1.249 (0.559;2.890) | 1.154 (0.691;1.132) | 0.714 |
| Decorin | 0.167 (0.097;0.527) | 0.145 (0.041;0.585) | 0.792 | 0.236 (0.102;0.407) | 0.127 (0.055;0.312) | 0.381 |
| Entactin | 2.484 (1.236;3.101) | 2.212 (1.537;2.628) | 0.699 | 2.460 (1.699;3.718) | 2.030 (1.552;3.213) | 0.413 |
| Fibronectin | 0.023 (0.013;0.054) | 0.078 (0.000;0.146) | 0.662 | 0.085 (0.000;0.216) | 0.028 (0.022;0.068) | 0.381 |
| Laminin | 0.053 (0.019;0.177) | 0.054 (0.009;0.119) | 1.000 | 0.149 (0.031;0.208) | 0.152 (0.011;0.169) | 0.548 |
| Neurocan | 0.102 (0.031;0.270) | 0.188 (0.103;0.297) | 0.082 | 0.066 (0.018;0.157) | 0.126 (0.101;0.155) | 0.262 |
| Perlecan | 0.422 (0.205;0.881) | 0.537 (0.229;1.115) | 0.485 | 0.577 (0.225;0.751) | 0.390 (0.214;0.778) | 0.686 |
| Phosphacan | 99.972 (99.869;99.992) | 99.884 (99.814;99.994) | 0.429 | 99.962 (99.834;99.966) | 99.953 (99.862;99.984) | 1.000 |
| Tenascin‐C | 0.366 (0.170;0.463) | 0.336 (0.091;0.551) | 1.000 | 0.374 (0.211;0.471) | 0.320 (0.054;0.488) | 0.905 |
| Histochemical stain or immunohistochemically detected molecule | Positive area per total white matter area [%] | |||||
|---|---|---|---|---|---|---|
| 14 dpi | 28 dpi | |||||
| Mock | TMEV | P‐value | Mock | TMEV | P‐value | |
| Azan | 0.004 (0.003;0.032) | 0.015 (0.000;0.038) | 0.662 | 0.015 (0.004;0.024) | 0.040 (0.000;0.093) | 0.429 |
| PSR, blue color | 0.008 (0.000;0.045) | 0.006 (0.003;0.011) | 0.548 | 0.011 (0.000;0.082) | 0.463 (0.003;0.656) | 0.052 |
| PSR, red color | 0.013 (0.000;0.062) | 0.000 (0.000;0.017) | 0.222 | 0.033 (0.004;0.050) | 0.016 (0.000;0.094) | 0.662 |
| Aggrecan | 0.021 (0.000;0.057) | 0.036 (0.000;0.089) | 0.662 | 0.013 (0.000;0.034) | 0.005 (0.000;0.025) | 0.537 |
| Brevican | 0.008 (0.000;0.023) | 0.000 (0.000;0.004) | 0.171 | 0.009 (0.000;0.029) | 0.005 (0.000;0.015) | 0.429 |
| Collagen I | 0.510 (0.071;0.894) | 0.289 (0.022;6.405) | 0.841 | 0.162 (0.096;0.337) | 0.201 (0.176;0.266) | 0.171 |
| Collagen IV | 1.147 (0.278;2.634) | 2.976 (1.398;5.525) | 0.114 | 1.127 (0.263;2.308) | 3.485 (2.010;5.245) | 0.009* |
| Decorin | 0.363 (0.032;0.466) | 0.393 (0.071;0.487) | 0.931 | 0.094 (0.034;0.109) | 0.188 (0.040;0.219) | 0.247 |
| Entactin | 2.684 (1.897;3.338) | 2.531 (1.408;3.422) | 0.818 | 2.905 (1.564;3.444) | 2.471 (1.294;2.913) | 0.180 |
| Fibronectin | 0.032 (0.003;0.110) | 0.026 (0.000;0.175) | 1.000 | 0.447 (0.000;0.088) | 0.027 (0.008;0.244) | 0.792 |
| Laminin | 0.050 (0.017;0.200) | 0.111 (0.006;0.288) | 0.690 | 0.044 (0.016;0.124) | 0.169 (0.006;0.543) | 0.329 |
| Neurocan | 0.091 (0.017;0.175) | 0.059 (0.033;0.122) | 0.662 | 0.119 (0.062;0.153) | 0.085 (0.058;0.159) | 0.792 |
| Perlecan | 0.390 (0.103;0.685) | 0.286 (0.081;0.975) | 0.931 | 0.439 (0.216;0.786) | 0.461 (0.224;2.411) | 0.699 |
| Phosphacan | 99.960 (99.921;99.996) | 99.982 (99.865;99.998) | 1.000 | 99.891 (99.670;99.977) | 99.540 (99.191;99.971) | 0.177 |
| Tenascin‐C | 0.211 (0.112;0.670) | 0.279 (0.195;0.618) | 0.476 | 0.353 (0.231;0.466) | 1.709 (0.032;4.392) | 0.257 |
| Histochemical stain or immunohistochemically detected molecule | Positive area per total white matter area [%] | |||||
|---|---|---|---|---|---|---|
| 56 dpi | 98 dpi | |||||
| Mock | TMEV | P‐value | Mock | TMEV | P‐value | |
| Azan | 0.018 (0.003;0.024) | 0.090 (0.009;0.420) | 0.030* | 0.010 (0.003;0.030) | 0.474 (0.003;3.550) | 0.083 |
| PSR, blue color | 0.003 (0.000;0.005) | 0.030 (0.000;1.049) | 0.247 | 0.004 (0.000;0.013) | 0.207 (0.000;0.493) | 0.257 |
| PSR, red color | 0.010 (0.002;0.044) | 0.101 (0.000;1.362) | 0.177 | 0.014 (0.000;0.027) | 0.497 (0.021;1.312) | 0.019* |
| Aggrecan | 0.002 (0.000;0.005) | 0.006 (0.000;0.039) | 0.352 | 0.002 (0.000;0.031) | 0.003 (0.000;0.042) | 0.931 |
| Brevican | 0.021 (0.000;0.031) | 0.004 (0.000;0.015) | 0.171 | 0.011 (0.000;0.032) | 0.013 (0.000;0.038) | 0.792 |
| Collagen I | 0.098 (0.050;0.815) | 0.354 (0.013;0.637) | 0.730 | 0.036 (0.011;0.064) | 1.953 (0.138;13.755) | 0.010* |
| Collagen IV | 0.857 (0.043;2.085) | 3.196 (2.073;7.421) | 0.009* | 0.509 (0.090;1.708) | 8.710 (3.539;15.868) | 0.010* |
| Decorin | 0.080 (0.039;0.100) | 0.073 (0.030;0.118) | 0.762 | 0.041 (0.009;0.183) | 0.212 (0.046;5.173) | 0.052 |
| Entactin | 2.438 (2.063;3.173) | 2.475 (1.699;5.222) | 0.699 | 2.356 (0.922;2.874) | 3.149 (1.986;5.711) | 0.052 |
| Fibronectin | 0.010 (0.003;0.048) | 0.005 (0.000;0.089) | 0.792 | 0.018 (0.000;0.035) | 0.430 (0.045;2.388) | 0.004* |
| Laminin | 0.019 (0.013;0.085) | 0.046 (0.007;1.248) | 0.352 | 0.059 (0.005;0.198) | 1.189 (0.089;11.777) | 0.017* |
| Neurocan | 0.053 (0.025;0.109) | 0.075 (0.036;0.150) | 0.662 | 0.051 (0.017;0.243) | 0.146 (0.059;0.436) | 0.329 |
| Perlecan | 0.369 (0.105;0.853) | 0.627 (0.369;5.084) | 0.240 | 0.304 (0.021;0.539) | 4.409 (0.307;5.262) | 0.017* |
| Phosphacan | 99.928 (99.878;99.989) | 99.071 (88.127;99.982) | 0.126 | 99.888 (99.854;99.980) | 91.831 (89.665;96.469) | 0.004* |
| Tenascin‐C | 0.350 (0.074;0.538) | 1.680 (0.299;4.033) | 0.026* | 0.215 (0.208;0.619) | 1.887 (0.247;3.707) | 0.032* |
| Histochemical stain or immunohistochemically detected molecule | Positive area per total white matter area [%] | ||
|---|---|---|---|
| 196 dpi | |||
| Mock | TMEV | P‐value | |
| Azan | 0.012 (0.004;0.022) | 1.474 (0.011;2.714) | 0.030* |
| PSR, blue color | 0.016 (0.000;0.022) | 0.033 (0.004;0.885) | 0.310 |
| PSR, red color | 0.005 (0.000;0.021) | 2.561 (0.030;3.792) | 0.008* |
| Aggrecan | 0.008 (0.002;0.022) | 0.012 (0.000;0.022) | 0.610 |
| Brevican | 0.013 (0.000;0.035) | 0.006 (0.003;0.012) | 0.352 |
| Collagen I | 0.015 (0.000;0.051) | 1.447 (0.108;7.642) | 0.010* |
| Collagen IV | 1.009 (0.133;1.638) | 7.458 (1.495;8.584) | 0.038* |
| Decorin | 0.086 (0.020;0.356) | 1.152 (0.020;7.004) | 0.167 |
| Entactin | 2.515 (1.745;2.879) | 5.202 (3.046;8.751) | 0.004* |
| Fibronectin | 0.002 (0.000;0.034) | 0.393 (0.007;6.377) | 0.038* |
| Laminin | 0.085 (0.026;0.140) | 3.050 (0.094;10.859) | 0.017* |
| Neurocan | 0.072 (0.048;0.088) | 0.156 (0.057;1.194) | 0.310 |
| Perlecan | 0.507 (0.143;0.870) | 5.018 (2.908;5.711) | 0.008* |
| Phosphacan | 99.968 (99.908;99.990) | 97.669 (87.386;99.877) | 0.029* |
| Tenascin‐C | 0.295 (0.076;0.453) | 1.693 (0.067;6.600) | 0.177 |
Data are given as percentage of positively labeled area per total white matter area.
Significant difference between TMEV‐infected and mock‐infected mice with P < 0.05 as detected by the Mann–Whitney U‐test.
Median (Minimum;Maximum).
Transcriptional changes of ECM‐related genes in TMEV‐infected mice
These histochemical results, in particular the diverse staining patterns in the PSR stain, strongly suggested a contribution of various molecules to ECM accumulation. In order to detect candidate molecules and to elucidate underlying molecular mechanism, microarray analysis of transcriptional changes within the spinal cord tissue was performed. Previous analyses of differential gene expression employing the spline‐based method embedded in the extraction of differential gene expression (EDGE) have revealed a total of 1210 genes differentially expressed at a false discovery rate of 1% in the study animals 23, 54. In the present study, a set of genes associated with ECM metabolism was manually selected for detailed analysis, including 20 genes already discovered by EDGE. Thus, a total of 350 probe sets was statistically analyzed to detect time point specific differences in gene expression between mock‐infected and TMEV‐infected mice (Supporting Information Table S1). Out of this list, 140 probe sets coding for 106 genes showed an altered gene expression at one to four of the investigation time points (Table 3, Supporting Information Table S2). In the group of ECM molecules, 31 of 40 differentially expressed genes exhibited mild upregulation with fold changes between 1.1 and 2.0 in the chronic phase of the disease. These included biglycan (gene symbol Bgn), chains of fibrillar and basement membrane collagens (eg, Col1a1, Col1a2, Col3a1, Col4a1), versican (Cspg2), neurocan (Cspg3), decorin (Dcn), fibronectin (Fn1), laminin chains (e.g. Lama3, Lama4, Lama5, Lamb1‐1, Lamb2, Lamc1, Lamc2), entactin (Nid2) and tenascin‐C (Tnc). In contrast, there was a minimal downregulation with fold changes between −1.1 and −1.4 of hyaluronan and proteoglycan link protein (Hapln1), aggrecan (Agc1) and phosphacan (Ptprz1; Table 3). Thirty‐one of the 49 enzymes involved in the biosynthesis of hyaluronan and chondroitin, keratan and heparan sulfates showed transcriptional changes that were generally only minimal and occurred particularly in the late phase of the disease. Enzymes of chondroitin sulfate biosynthesis tended to be downregulated, while there was an alternating expression profile of enzymes along the pathway of heparan sulfate biosynthesis (Supporting Information Table S2). Genes of glycosaminoglycan degradation enzymes were consistently upregulated from 42 dpi onwards including the maximal fold change among all selected genes by the ECM‐cleaving enzyme heparanase (Hpse), which showed an 8.53‐fold and 10.22‐fold upregulation at 98 dpi and 196 dpi, respectively (Table 3). Out of the MMP/TIMP group, further matrix modulating enzymes with robust fold changes in the chronic disease phase included MMP12 (Mmp12), being upregulated 5.26‐fold and 6.89‐fold at 98 dpi and 196 dpi, respectively, as well as MMP2 (Mmp2) and MMP‐19 (Mmp19). Several other MMP genes were minimally downregulated. The MMP inhibitors TIMP1 (Timp1) and TIMP2 (Timp2) showed upregulations of about twofold to 4.5‐fold between 42 dpi and 196 dpi (Table 3). Differentially expressed genes of pro‐fibrotic factors included transforming growth factor beta (TGFβ; Tgfb1, Tgfb3, Tgfbi) and one of its receptors, TGFβ receptor I (Tgfbr1), as well as the CC‐chemokine CCL2 (Ccl2) and its receptor CCR2 (Ccr2), which were upregulated about twofold from 42 dpi to 196 dpi. Two cytokines with anti‐fibrotic properties, interferon gamma (IFNγ; Ifng) and interleukin‐10 (IL‐10; Il10), were upregulated in a similar pattern (Supporting Information Table S2).
Table 3.
Probe set IDs of the Affymetrix mouse genome 430 2.0 array, official gene symbols and titles, and relative fold changes with respective P‐values for probe sets related to extracellular matrix molecules, glycosaminoglycan degradation and matrix metalloproteinases/tissue inhibitors of metalloproteinases (MMPs/TIMPs), and differentially expressed between TMEV‐infected and mock‐infected mice in the time course of TME. Abbreviations: dpi = days post‐infection; aka = also known as; MMP = matrix metalloproteinase; TIMP = tissue inhibitors of metalloproteinase; TMEV = Theiler's murine encephalomyelitis virus; TME = Theiler's murine encephalomyelitis.
| Gene symbol | Probe set ID | Gene title | 14 dpi | 42 dpi | 98 dpi | 196 dpi | ||||
|---|---|---|---|---|---|---|---|---|---|---|
| Fold change | P‐value | Fold change | P‐value | Fold change | P‐value | Fold change | P‐value | |||
| Extracellular matrix molecules | ||||||||||
| Agc1 | 1449827_at | Aggrecan 1 | −1.09* | 0.041 | −1.13* | 0.041 | −1.21* | 0.004 | −1.16 | 0.065 |
| Bgn | 1437889_x_at | Biglycan | 1.19 | 0.394 | 1.14 | 0.093 | 1.07 | 0.537 | 1.56* | 0.002 |
| Bgn | 1416405_at | Biglycan | 1.22 | 0.394 | 1.31* | 0.015 | 1.21 | 0.126 | 1.88* | 0.002 |
| Bgn | 1448323_a_at | Biglycan | 1.26 | 0.180 | 1.28* | 0.015 | 1.19 | 0.177 | 1.84* | 0.002 |
| Col1a1 | 1423669_at | Procollagen type I alpha 1 | 2.05 | 0.240 | 1.07 | 0.180 | −1.18 | 0.662 | 1.50* | 0.004 |
| Col1a2 | 1450857_a_at | Procollagen type I alpha 2 | 1.58 | 0.180 | 1.20 | 0.240 | −1.15 | 0.537 | 1.75* | 0.002 |
| Col1a2 | 1423110_at | Procollagen type I alpha 2 | 1.51 | 0.394 | −1.10 | 0.937 | −1.28 | 0.429 | 1.60* | 0.004 |
| Col3a1 | 1427883_a_at | Procollagen type III alpha 1 | 1.28 | 0.485 | 1.29 | 0.093 | 1.03 | 0.931 | 2.35* | 0.009 |
| Col4a1 | 1452035_at | Procollagen type IV alpha 1 | 1.09* | 0.041 | 1.11 | 0.180 | −1.03 | 0.662 | 1.19 | 0.132 |
| Col5a1 | 1416740_at | Procollagen type V alpha 1 | 1.33 | 0.240 | 1.10 | 0.240 | 1.03 | 0.429 | 1.34* | 0.004 |
| Col5a1 | 1434479_at | Procollagen type V alpha 1 | 1.10 | 0.485 | −1.11 | 0.180 | −1.12* | 0.017 | 1.05 | 0.485 |
| Col5a2 | 1422437_at | Procollagen type V alpha 2 | 1.21 | 0.394 | 1.10 | 0.394 | −1.04 | 0.662 | 1.41* | 0.026 |
| Col6a1 | 1448590_at | Procollagen type VI alpha 1 | 1.31 | 0.394 | 1.11 | 0.394 | −1.07 | 0.429 | 1.62* | 0.002 |
| Col6a2 | 1452250_a_at | Procollagen type VI alpha 2 | 1.23 | 0.132 | 1.03 | 0.589 | −1.14 | 0.247 | 1.38* | 0.015 |
| Col6a2 | 1426947_x_at | Procollagen type VI alpha 2 | 1.11 | 0.240 | 1.13 | 0.180 | −1.10 | 0.329 | 1.19* | 0.015 |
| Col6a3 /// LOC674521 | 1424131_at | Procollagen type VI alpha 3 /// similar to alpha 3 type VI collagen isoform 1 precursor | 1.25 | 0.394 | 1.13 | 0.589 | 1.25* | 0.009 | 1.36* | 0.015 |
| Col8a1 | 1418440_at | Procollagen type VIII alpha 1 | 1.07 | 0.240 | −1.06 | 0.589 | 1.07 | 0.662 | 1.23* | 0.041 |
| Col8a2 | 1434667_at | Procollagen type VIII alpha 2 | −1.00 | 0.937 | −1.05 | 0.937 | −1.14 | 0.126 | 1.35* | 0.009 |
| Col9a3 | 1460734_at | Procollagen type IX alpha 3 | 1.07 | 0.180 | −1.10 | 0.310 | 1.23* | 0.004 | 1.06 | 0.394 |
| Col13a1 | 1422866_at | Procollagen type XIII alpha 1 | 1.05 | 0.818 | 1.08 | 0.485 | −1.14* | 0.004 | 1.09 | 0.310 |
| Col14a1 | 1427168_a_at | Procollagen type XIV alpha 1 | −1.05 | 0.937 | −1.15 | 0.699 | −1.26 | 0.247 | 1.48* | 0.041 |
| Col15a1 | 1448755_at | Procollagen type XV | −1.01 | 0.937 | 1.11 | 0.394 | −1.11* | 0.030 | 1.14 | 0.132 |
| Col16a1 | 1427986_a_at | Procollagen type XVI alpha 1 | 1.29* | 0.009 | 1.41* | 0.004 | 1.45* | 0.004 | 1.44* | 0.009 |
| Col18a1 | 1426955_at | Procollagen type XVIII alpha 1 | 1.13 | 0.065 | 1.06 | 0.310 | 1.04 | 0.537 | 1.29* | 0.015 |
| Col19a1 | 1421698_a_at | Procollagen type XIX alpha 1 | 1.21 | 0.132 | −1.14 | 0.394 | −1.21 | 0.537 | −1.30* | 0.009 |
| Col20a1 | 1425234_at | Collagen type XX alpha 1 | 1.16* | 0.026 | 1.22* | 0.015 | 1.65* | 0.004 | 1.44* | 0.015 |
| Col20a1 | 1430855_at | Collagen type XX alpha 1 | 1.05 | 0.394 | 1.31* | 0.009 | 1.28 | 0.052 | 1.02 | 0.589 |
| Col22a1 | 1453084_s_at | Collagen type XXII alpha 1 | 1.10 | 0.818 | 1.05 | 0.699 | −1.15* | 0.030 | 1.01 | 0.589 |
| Col27a1 | 1429549_at | Procollagen type XXVII alpha 1 | 1.22* | 0.026 | 1.16 | 0.699 | −1.03 | 0.792 | 1.10 | 0.180 |
| Cspg2 | 1427256_at | Chondroitin sulfate proteoglycan 2 (aka neurocan) | 1.04 | 0.818 | 1.08 | 0.240 | 1.49* | 0.004 | 1.40* | 0.026 |
| Cspg2 | 1427257_at | Chondroitin sulfate proteoglycan 2 (aka neurocan) | −1.21* | 0.041 | 1.06 | 0.699 | 1.26* | 0.004 | 1.02 | 0.699 |
| Cspg3 | 1423604_at | Chondroitin sulfate proteoglycan 3 (aka neurocan) | 1.01 | 0.818 | 1.16* | 0.009 | 1.11* | 0.030 | −1.02 | 0.485 |
| Cspg3 | 1434679_at | Chondroitin sulfate proteoglycan 3 (aka neurocan) | 1.11* | 0.002 | 1.37* | 0.002 | 1.59* | 0.004 | 1.48* | 0.002 |
| Dcn | 1449368_at | Decorin | 1.29 | 0.394 | 1.25 | 0.310 | −1.34 | 0.247 | 1.94* | 0.002 |
| Eln | 1420854_at | Elastin | −1.03 | 0.589 | −1.04 | 0.394 | −1.06 | 0.429 | −1.19* | 0.009 |
| Fn1 | 1426642_at | Fibronectin 1 | 1.37 | 0.180 | 1.48* | 0.009 | 1.32* | 0.030 | 1.61* | 0.004 |
| Hapln1 | 1438020_at | Hyaluronan and proteoglycan link protein 1 | −1.34* | 0.015 | −1.19* | 0.009 | −1.19 | 0.177 | −1.26* | 0.009 |
| Lama2 | 1426285_at | Laminin alpha 2 | −1.06 | 0.699 | −1.04 | 0.937 | −1.20* | 0.009 | 1.14 | 0.180 |
| Lama3 | 1444860_at | Laminin alpha 3 | −1.04 | 0.485 | −1.03 | 0.818 | 1.04 | 0.329 | −1.17* | 0.026 |
| Lama3 /// LOC669814 | 1427512_a_at | Laminin alpha 3 /// similar to Laminin alpha‐3 chain precursor (Nicein alpha subunit) | 1.01 | 0.937 | −1.01 | 0.937 | 1.01 | 1.000 | 1.40* | 0.026 |
| Lama4 | 1424807_at | Laminin alpha 4 | 1.01 | 0.699 | 1.03 | 0.699 | 1.02 | 0.429 | 1.41* | 0.004 |
| Lama5 /// LOC671909 | 1427009_at | Laminin alpha 5 /// similar to Laminin alpha‐5 chain precursor | −1.06 | 0.240 | 1.02 | 0.589 | −1.12 | 0.177 | 1.12* | 0.026 |
| Lamb1‐1 | 1424114_s_at | Laminin B1 subunit 1 | 1.01 | 0.937 | −1.05 | 0.589 | −1.14 | 0.082 | 1.34* | 0.026 |
| Lamb2 | 1416513_at | Laminin beta 2 | 1.03 | 0.699 | −1.01 | 0.485 | −1.08 | 0.537 | 1.32* | 0.004 |
| Lamc1 | 1423885_at | Laminin gamma 1 | 1.11 | 0.065 | 1.04 | 0.818 | 1.12 | 0.126 | 1.26* | 0.009 |
| Lamc2 | 1421279_at | Laminin gamma 2 | 1.09 | 0.240 | 1.17* | 0.026 | 1.07 | 0.247 | 1.01 | 0.937 |
| Nid2 | 1423516_a_at | Nidogen 2 (aka entactin) | 1.02 | 0.310 | 1.30* | 0.041 | 1.21 | 0.052 | 1.49* | 0.026 |
| Ptprz1 | 1452284_at | Protein tyrosine phosphatase, receptor type Z, polypeptide 1 (aka phosphacan) | −1.04 | 0.310 | −1.12* | 0.015 | −1.08 | 0.052 | −1.11* | 0.026 |
| Tnc | 1416342_at | Tenascin C | 1.33 | 0.093 | 1.38* | 0.004 | 1.33* | 0.017 | 1.26 | 0.394 |
| Enzymes of glycosaminoglycan degradation | ||||||||||
| Arsb | 1429190_at | Arylsulfatase B | −1.05 | 0.310 | 1.18* | 0.041 | 1.24 | 0.537 | 1.41 | 0.093 |
| Galns | 1448744_at | Galactosamine (N‐acetyl)‐6‐sulfate sulfatase | −1.04 | 0.818 | 1.34* | 0.002 | 1.50* | 0.004 | 1.58* | 0.002 |
| Gns | 1433488_x_at | Glucosamine (N‐acetyl)‐6‐sulfatase | 1.18* | 0.009 | 1.62* | 0.002 | 2.09* | 0.004 | 1.81* | 0.002 |
| Gns | 1433546_at | Glucosamine (N‐acetyl)‐6‐sulfatase | 1.19* | 0.002 | 1.57* | 0.002 | 1.89* | 0.004 | 1.81* | 0.002 |
| Gns | 1446861_at | Glucosamine (N‐acetyl)‐6‐sulfatase | 1.28* | 0.015 | −1.00 | 0.937 | 1.24 | 0.082 | 1.05 | 0.699 |
| Gusb | 1430332_a_at | Glucuronidase, beta | −1.26 | 0.132 | 1.05 | 0.699 | 1.13 | 0.662 | 1.45* | 0.009 |
| Gusb | 1448124_at | Glucuronidase, beta | 1.19* | 0.041 | 2.15* | 0.002 | 3.10* | 0.004 | 3.30* | 0.002 |
| Hexa | 1449024_a_at | Hexosaminidase A | 1.13 | 0.065 | 1.53* | 0.002 | 1.98* | 0.004 | 2.04* | 0.002 |
| Hexb | 1437874_s_at | Hexosaminidase B | 1.18 | 0.093 | 1.64* | 0.002 | 1.96* | 0.004 | 1.75* | 0.002 |
| Hexb | 1460180_at | Hexosaminidase B | 1.34* | 0.004 | 1.96* | 0.002 | 2.39* | 0.004 | 2.24* | 0.002 |
| Hpse | 1433930_at | Heparanase | 1.08 | 0.394 | 2.80* | 0.002 | 8.53* | 0.004 | 10.22* | 0.002 |
| Hyal1 /// Nat6 | 1449954_at | Hyaluronoglucosaminidase 1 /// N‐acetyltransferase 6 | −1.03 | 0.589 | −1.03 | 0.589 | 1.02 | 0.792 | 1.26* | 0.002 |
| Ids | 1427813_at | Iduronate 2‐sulfatase | −1.03 | 0.485 | −1.11* | 0.041 | 1.01 | 0.792 | 1.01 | 0.937 |
| Ids | 1455481_at | Iduronate 2‐sulfatase | −1.01 | 0.818 | −1.08* | 0.026 | −1.15* | 0.017 | −1.10* | 0.002 |
| Idua | 1418793_at | Iduronidase alpha‐L‐ | 1.03 | 0.394 | 1.11* | 0.026 | 1.19 | 0.052 | 1.06 | 0.132 |
| Idua | 1439251_at | Iduronidase alpha‐L‐ | 1.00 | 0.818 | 1.23* | 0.002 | 1.16 | 0.052 | 1.07 | 0.310 |
| Naglu | 1417706_at | Alpha‐N‐acetylglucosaminidase (Sanfilippo disease IIIB) | 1.05 | 0.818 | 1.91* | 0.002 | 2.92* | 0.004 | 3.18* | 0.002 |
| Matrix metalloproteinases (MMPs) and tissue inhibitors of metalloproteinases (TIMPs) | ||||||||||
| Mmp2 | 1416136_at | Matrix metallopeptidase 2 | −1.03 | 0.937 | 1.00 | 0.818 | 1.08 | 0.429 | 1.61* | 0.002 |
| Mmp2 | 1439364_a_at | Matrix metallopeptidase 2 | 1.04 | 0.937 | 1.13 | 0.240 | 1.13 | 0.429 | 1.64* | 0.002 |
| Mmp3 | 1418945_at | Matrix metallopeptidase 3 | 1.07 | 0.394 | 1.02 | 0.818 | 1.22* | 0.017 | 1.28 | 0.310 |
| Mmp9 | 1448291_at | Matrix metallopeptidase 9 | −1.15 | 0.310 | −1.28* | 0.004 | −1.14 | 0.177 | −1.02 | 0.937 |
| Mmp9 | 1416298_at | Matrix metallopeptidase 9 | −1.06 | 0.589 | −1.12* | 0.041 | −1.11 | 0.429 | −1.08 | 0.310 |
| Mmp12 | 1449153_at | Matrix metallopeptidase 12 | 1.02 | 0.589 | 1.47* | 0.026 | 5.26* | 0.004 | 6.89* | 0.002 |
| Mmp13 | 1417256_at | Matrix metallopeptidase 13 | 1.33 | 0.589 | 1.02 | 0.240 | 1.11 | 0.792 | 1.21* | 0.015 |
| Mmp14 | 1448383_at | Matrix metallopeptidase 14 (membrane‐inserted) | 1.09 | 0.485 | 1.37* | 0.041 | 1.08 | 0.537 | 1.41 | 0.240 |
| Mmp14 | 1440920_at | Matrix metallopeptidase 14 (membrane‐inserted) | 1.07 | 0.310 | 1.22* | 0.026 | −1.00 | 1.000 | 1.16 | 0.132 |
| Mmp16 | 1440161_at | Matrix metallopeptidase 16 | −1.05 | 0.394 | 1.13* | 0.026 | −1.16 | 0.537 | −1.09 | 0.132 |
| Mmp17 | 1448598_at | Matrix metallopeptidase 17 | −1.02 | 0.589 | −1.18* | 0.004 | −1.11 | 0.052 | −1.17* | 0.041 |
| Mmp19 | 1421977_at | Matrix metallopeptidase 19 | −1.02 | 0.937 | 1.01 | 0.937 | 1.47* | 0.004 | 1.49* | 0.002 |
| Mmp23 | 1417281_a_at | Matrix metallopeptidase 23 | 1.09 | 0.394 | 1.03 | 0.240 | −1.19* | 0.030 | 1.16* | 0.041 |
| Mmp24 | 1417678_at | Matrix metallopeptidase 24 | −1.10 | 0.240 | −1.12* | 0.041 | −1.07 | 0.429 | −1.05 | 0.699 |
| Mmp24 | 1441456_at | Matrix metallopeptidase 24 | −1.09 | 0.240 | −1.15* | 0.009 | −1.07 | 0.329 | −1.08* | 0.041 |
| Mmp24 | 1456376_at | Matrix metallopeptidase 24 | −1.06* | 0.041 | −1.08 | 0.093 | −1.18* | 0.004 | −1.09* | 0.041 |
| Mmp28 | 1447544_at | Matrix metallopeptidase 28 (epilysin) | −1.08 | 0.310 | −1.04 | 0.589 | −1.18* | 0.017 | 1.08 | 0.310 |
| Timp1 | 1460227_at | Tissue inhibitor of metalloproteinase 1 | 1.24 | 0.240 | 3.18* | 0.002 | 4.56* | 0.004 | 4.00* | 0.002 |
| Timp2 | 1460287_at | Tissue inhibitor of metalloproteinase 2 | 1.06 | 0.240 | 1.93* | 0.002 | 2.67* | 0.004 | 2.65* | 0.002 |
| Timp4 | 1450974_at | Tissue inhibitor of metalloproteinase 4 | −1.15 | 0.310 | −1.24* | 0.015 | −1.25* | 0.017 | −1.16 | 0.065 |
| Timp4 | 1423405_at | Tissue inhibitor of metalloproteinase 4 | −1.11 | 0.485 | −1.20 | 0.093 | −1.19* | 0.017 | −1.22* | 0.026 |
Significant difference between TMEV‐infected and mock‐infected mice with P < 0.05 as detected by the Mann–Whitney U‐test.
Distinct spatio‐temporal morphological pattern of various ECM molecules in TME lesions
These microarray results led to the assumption that transcriptional upregulations and altered composition of ECM molecules contributed to the prominent, histochemically demonstrated matrix deposition in TME lesions. For detailed localization and phenotyping of the ECM, the following molecules were chosen for immunostaining: aggrecan, brevican, decorin, neurocan, phosphacan, perlecan (all proteoglycans), entactin, fibronectin, laminin, tenascin‐C (all glycoproteins), collagen I and IV (Table 1). This selection particularly considers the known involvement of these substances in glial scar formation.
Within the spinal cord of mock‐infected mice, the immunoreactivity pattern of all applied antibodies remained unchanged throughout the observation period until 196 dpi (Table 2). In detail, immunolabeling for collagen I, decorin and fibronectin was restricted to meningeal connective tissue. Collagen IV, entactin and laminin immunoreactivity were also present in meninges and additionally in blood vessel walls. Immunostaining for perlecan and tenascin‐C revealed a weak labeling of meningeal structures and a diffuse staining of the spinal cord gray and white matter. Neurocan immunolabeling was restricted to the spinal nerves and was completely absent in the gray and white matter of the spinal cord. In contrast, diffuse phosphacan expression was prominent in spinal cord gray and white matter. Aggrecan and brevican immunoreactivity was generally weak and restricted to the gray matter, where both molecules showed a perineuronal enhancement of immunolabeling.
In TMEV‐infected animals, all basement membrane components investigated as well as several non‐BM molecules contributed to ECM accumulation, which in general was restricted to lesioned areas.
Regarding the BM molecules, collagen IV and laminin started to accumulate intralesionally as early as 28 days after TMEV infection, displaying a filamentous extracellular pattern in addition to the regular vascular reaction (Figure 2B,C,F,G). Until 196 dpi, the positive immunoreaction of both molecules progressively expanded, resulting in a lattice‐like pattern throughout the lesioned area, with frequent perivascular enhancement and occupying up to 13.76% (collagen IV) and 11.78% (laminin) of the total white matter area (details in Table 2).
Immunohistochemical double labeling demonstrated that intralesional deposition of collagen IV occurred predominantly without spatial association to von Willebrand factor‐positive vascular structures in spinal cord lesions 98 dpi and 196 dpi (Figure 4).
Figure 4.
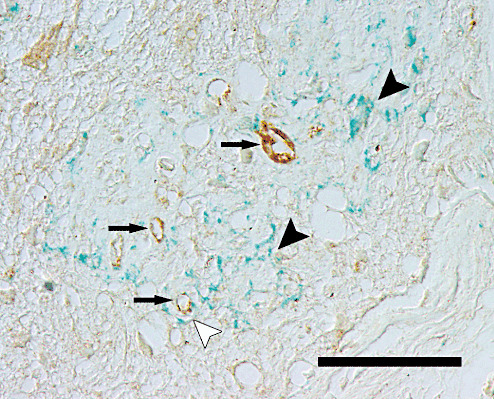
Immunohistochemical findings after Theiler's murine encephalomyelitis virus (TMEV) infection. Section of the thoracic spinal cord of a TMEV‐infected mouse from 196 days postinfection, showing immunoreactivity for von Willebrand factor (brown signal) and collagen IV (bluish to greenish signal). In a demyelinated white matter lesion, prominent collagen IV deposits are present predominantly without (black arrowheads) and occasionally with (white arrowhead) association to von Willebrand factor‐positive blood vessels (arrows). Immunohistology, ABC method, DAB chromogen (von Willebrand factor) and HistoGreen chromogen (collagen IV). Nomarski differential interference contrast. Scale bar = 40 µm.
Similarly, vascular perlecan immunoreactivity, which regularly was very weak, started to increase at 28 dpi within demyelinated areas. While the perlecan‐positive area continuously expanded until 198 dpi, an additional parenchymal staining appeared besides the vascular accentuation (Figure 2N). An increase in entactin immunoreactivity was observed at 56 dpi, displaying a partly granular, partly meshwork‐like pattern. While the median of the entactin‐positive white matter area increased up to 5.2% at 196 dpi, the immunolabeling frequently showed a distinct spatial relation to vascular structures (Figure 2O). Extracellular fibronectin immunoreactivity was observed only at 98 dpi and more prominently at 196 dpi in several demyelinated lesions, exhibiting a granular to laminar pattern (Figure 2J). Simultaneously, several intralesional macrophages and gitter cells contained fibronectin within their cytoplasm.
The first non‐BM molecule that started to accumulate within demyelinated areas was tenascin‐C, displaying a granular to dendritic pattern at 28 dpi. During disease progression, tenascin‐C continuously accumulated, reaching 1.89% and 1.69% area percentage at 98 dpi and 196 dpi, respectively (Figure 2P). An intralesional deposition of collagen I, decorin and neurocan was detected at 56 dpi and further increased until day 196 pi. The collagen I signal displayed a granular to filamentous pattern within demyelinated lesions (Figure 2D,H). This immunolabeling continued to expand, hence developing a lattice‐like and rarely an extended laminar pattern and reaching median area percentages of 1.96% and 1.48% at 98 dpi and 196 dpi, respectively. Mild decorin and neurocan immunolabeling was observed within a demyelinated area in a single animal 56 days after TMEV infection, whereas several mice showed positive signals at 98 dpi and 196 dpi, respectively. Simultaneously, the size of immunopositive areas increased, with decorin displaying a dendritic pattern and neurocan exhibiting a multifocal semi‐circular to circular labeling most likely attributed to capillary blood vessels (Figure 2K,L). However, statistic analysis failed to demonstrate a significant difference to the mock‐infected group for both molecules. In contrast to all other ECM molecules investigated, phosphacan expression showed a progressive reduction following TMEV infection. Loss of phosphacan immunoreactivity occurred as early as 28 dpi multifocally within demyelinated lesions and progressed until 196 dpi (Figure 2M). Aggrecan and brevican did not show any changes in their expression pattern during TME lesion development.
DISCUSSION
In this study, microarray analysis as well as histochemistry and immunohistochemistry were used to assess the contribution of ECM alterations and to identify their molecular mechanisms in demyelinating TME, a virus‐induced experimental model of MS.
Within demyelinated TME lesions, prominent ECM accumulation occurred in the lesion center, starting as early as 28 dpi and continuously progressed until the end of the observation period at 196 dpi. With this time course, matrix alterations closely followed the process of demyelination and paralleled the development of astrogliosis 52, 53. First clues about the molecular composition of the accumulating ECM were obtained by histochemical stains, which revealed a contribution of collagens, glycoproteins and proteoglycans (4). Additionally, a transient bluish to greenish signal in the PSR stain with an exceptional perilesional distribution indicated the presence of hyaluronan (4). Similarly, hyaluronan has been demonstrated to accumulate within demyelinated lesions of MS patients and rats with EAE. This was attributed to elevated expression of the hyaluronan receptor CD44 by glial cells, which appears to be a common effect in demyelinating conditions (2). In MS and EAE, this hyaluronan accumulation persists and interferes with remyelination by inhibiting oligodendrocyte progenitor cell maturation (3). Similar mechanisms may play a role in TME, where an insufficient differentiation of oligodendrocyte progenitor cells results in failure of complete remyelination (53).
Using immunohistochemistry, various ECM components were shown to contribute to intralesional matrix alterations. Progressively accumulating molecules included collagen I and collagen IV, the CSPGs decorin and neurocan, and the glycoproteins laminin, entactin, tenascin‐C and fibronectin, though with distinct differences concerning their spatial distribution. Deposition of collagen I, decorin, fibronectin, neurocan and tenascin‐C was found diffusely distributed throughout demyelinated areas in TME. Strikingly, also the BM components collagen IV, laminin, entactin and perlecan accumulated in the demyelinated white matter parenchyma without association to blood vessels. Similar observations have been made in MS, where networks of collagen IV, laminin and perlecan occur diffusely within plaques (56). In contrast, the diffuse deposition of non‐BM components was not observed in MS, where collagen I, decorin and fibronectin accumulate only in the perivascular space, and neurocan and tenascin‐C are even reduced in plaque centers 16, 30, 40, 55. An accumulation of the BM molecule entactin as detected in TME has not been described in primary demyelinating conditions before but occurs in experimental spinal cord injury (17). The amount and distribution of brevican and aggrecan remained unchanged in spinal cord lesions in TME, although upregulated expression and accumulation of these molecules were observed in rat EAE and human MS plaques, respectively 19, 20, 40, 46. These divergent reactions following CNS lesions probably rely on species‐specific differences, as brevican and aggrecan physiologically occur in spinal cord white matter in rats and humans but were restricted to the gray matter in mice 20, 40.
In general, the different spatial patterns of matrix molecule deposition in TME lesions raise the question of the cellular source of the accumulating matrix. As the observed ECM deposition parallels progressive astrogliosis both spatially and temporally, a substantial contribution of reactive astrocytes has to be assumed. This is in accordance with results from CNS injury models, where activated astrocytes were proven to represent the major source of CSPGs and glycoproteins, collectively forming the so‐called glial scar 14, 20, 28, 46. An astrocytic origin of ECM is further supported by findings in demyelinated MS lesions, where matrix deposits are closely associated with areas of astrogliosis, whereas chronic plaque centers with marked cell loss and tissue destruction exhibit prominent loss of ECM 16, 40, 56. Moreover, reactive astrocytes are able to secrete BM molecules such as collagen IV and laminin both in BM structures and in parenchymal patterns 17, 24. Schwann cells represent another potential source of BM structures, hence the occurrence of Schwann cell‐type remyelination in TME suggests a contribution of this cell population to parenchymal, nonvessel‐associated ECM deposition in the present study 1, 53. In experimental rodent spinal cord injury, meningeal fibroblasts are also substantially involved in intralesional matrix deposition including immediate upregulation of tenascin‐C, brevican and neurocan, and delayed secretion of collagens and laminin 14, 17, 20, 24, 46, 59. However, analog processes are considered negligible in TME as there is no primary meningeal tissue disruption and thus no considerable trigger for fibroblast proliferation and invasion into spinal cord tissue.
Regarding the functional impact of a glial scar, a certain degree of reactive astrogliosis has been proven crucial following CNS injury in order to re‐establish the BBB and prevent ongoing tissue disruption and influx of inflammatory cells 13, 49. However, overwhelming astrogliosis and accompanying accumulation of CSPGs, tenascin‐C and various BM components are generally considered as inhibitory environment for regenerative processes, particularly axonal sprouting 8, 11, 14, 17, 41, 43, 58. Furthermore, the glial scar considerably impairs remyelination, as ECM deposits inhibit maturation and differentiation of oligodendrocyte precursors 3, 53. This strongly suggests that the failure of remyelination in TME is partly attributable to the dense ECM accumulation within the lesions, which probably inhibits regenerative attempts of resident and progenitor cells.
The CNS‐specific proteoglycan phosphacan was the only ECM component that was progressively reduced in demyelinated TME lesions, accompanied by slight downregulation of the respective gene (Ptprz1). Phosphacan immunoreactivity was similarly decreased in the early phase of experimental spinal cord injury and in the cell‐poor center of chronic MS plaques; however, in association with astrogliosis, phosphacan amount was restored or increased in these entities 20, 40, 46. These differences may in part depend on the impossibility to differentiate immunohistochemically between extracellular, putatively accumulating phosphacan and cell membrane‐bound phosphacan that is probably diminished because of cell loss.
A second aspect in matrix accumulation in TME lesions was the successive temporal occurrence of individual ECM molecules during the disease course. The amount of collagen IV, laminin, perlecan and tenascin‐C started to increase from 28 dpi on, whereas accumulation of collagen I, decorin, entactin and neurocan was not observed until 56 dpi, or occurred only 98 dpi, as in the case of fibronectin. Interestingly, this temporal course was only in part paralleled by transcriptional changes of the respective genes. Accumulation of several molecules, including collagens I and IV, laminin, decorin and perlecan, was morphologically demonstrable from the early phase or midterm of the disease onwards, although transcriptional upregulation of their respective genes were detected only transiently (Col4a1), considerably delayed in the disease course (Col1a1, Col1a2, Col3a1; Dcn; Lama3, Lama4, Lama5, Lamb1‐1, Lamb2, Lamc1, Lamc2) or not at all (Hspg2). In contrast, progressive tenascin‐C accumulation was closely paralleled by upregulated gene expression (Tnc), and increased transcription of their respective genes preceded and accompanied the intralesional deposition of entactin (Nid2), neurocan (Cspg3) and fibronectin (Fn1). Matrix accumulations also exhibit diverse patterns in different types of MS plaques and have been considered as an important factor for regeneration failure, but a distinct timeline of ECM deposition is not definable because of the spontaneous character of this disease 16, 30, 40, 56, 58. Therefore, the precisely regulated temporal course of ECM production and deposition in TME further enhances the value of this model to examine the impact of single ECM molecules upon the pathogenesis and to develop preventive and therapeutic strategies in demyelinating diseases such as MS.
Interestingly, the present study revealed a lack of complete parallelism between morphological matrix accumulation and transcriptional changes of related genes. There are several possible explanations for this seeming incongruity, one of which is the different observation period covered by the two methods. Immunohistochemistry shows the summation of altered protein production, whereas microarray analysis reveals a snapshot‐like picture of one particular transcriptional state. Therefore, periods of increased gene expression between the different evaluation time points remain undetected, or minimal transcriptional alterations may be below the detection level, albeit sufficient for long‐term ECM accumulation. Finally, lesion areas in TME are relatively small compared with the total area of spinal cord transverse sections, which are used for microarray analysis, so that the transcriptional profile of the lesion may be superimposed by that of the surrounding intact tissue.
In order to detect superior regulating mechanisms of ECM alterations, several pro‐fibrotic factors such as TGFβ and IL‐13 and chemokines of the CC‐ and CXC‐family were included in the microarray analysis (61). In TME, the gene expression of TGFβ1 (Tgfb1) and its receptor TGFβ receptor I (Tgfbr1) was mildly upregulated in the chronic phase of the disease, probably because of microglia activation and infiltration of macrophages (38). This may have promoted the astrocytic secretion of CSPGs and collagens 24, 38. In contrast, a TGFβ1 upregulation correlating with an increased laminin content of blood vessel walls was shown in the acute phase of TME by others (51). However, the highly virulent GDVII strain of TMEV was used in this aforementioned study, thus virus‐dependent effects may account for differences in TGFβ1 expression profiles. The pro‐fibrotic effect of CCL2 and CCR2, which showed mild upregulation in the late phase of TME, is well known from pulmonary fibrosis, and an increased expression by reactive astrocytes has also been shown in MS lesions 31, 39, 47. However, their role in ECM modulation during CNS diseases is somewhat ambiguous as CCL2 signaling may result in MMP synthesis and thus contribute to BBB breakdown and inflammatory influx 6, 47. As monocytes represent another main source of CCL2, the observed upregulation in TME may at least partly be derived from the inflammatory infiltrate in the affected spinal cord (30).
With regard to the biosynthesis pathways of proteoglycans and hyaluronan, there was not a uniform pattern of enzyme regulation, with only minimal fold changes as well as alternating up‐ and downregulation within one pathway. As these findings may be based on periodic gene transcription or intrinsic feedback mechanisms, a partial contribution of synthesis pathway regulation in the development of ECM accumulation cannot be ruled out. In contrast, enzymes of proteoglycan cleavage showed obvious transcriptional activation in TME, with heparanase showing the strongest upregulation. As this enzyme specifically cleaves heparan sulfate proteoglycans, which are integral components of BMs, it disturbs BBB integrity and thus favors inflammatory influx 12, 33. Moreover, heparanase overexpression coincides with astrocyte activation and migration, which suggests a contributing role of this enzyme for the development of astrogliosis in TME (45). Transcriptional changes were also detected in the MMP/TIMP group of matrix modulating enzymes, in particular represented by prominent upregulation of MMP12 as well as TIMP1 and TIMP2 in the late phase of TMEV infection. This confirms previous polymerase chain reaction (PCR) results in TME, where increased MMP12 levels have been considered as a trigger of ongoing demyelination (52). The mildly increased expression of MMP2 and MMP19 parallels recent findings in MS lesions, where these enzymes are involved in BBB leakage and ECM remodeling 30, 57. MMP9 expression levels were mildly decreased during TMEV infection, which parallels previous PCR results but is in contrast to MS and other demyelinating diseases such as canine distemper 26, 29, 52. Conclusively, the overall tendency of upregulated matrix degradation did not prevent net accumulation of ECM within lesions. Putative mechanisms include inhomogeneous distribution of digesting enzymes in the TME‐affected spinal cord, particularly lack of matrix‐degrading enzymes in demyelinated areas, upregulation of TIMPs as well as altered enzymatic activities. Additionally, disturbed aggregation of matrix molecule subunits (eg, laminin chains) or post‐translational modifications of the ECM, which are not reflected by transcriptional changes, might withdraw them from regular degradation.
CONCLUSION
TMEV‐induced demyelination in the murine spinal cord is accompanied by progressive astrogliosis and prominent intralesional ECM accumulation resulting in a glial scar, which is considered to impair regenerative processes. Contributing molecular mechanisms include induction of pro‐fibrotic factors as well as alterations in matrix‐modulating pathways. The experimental and well‐reproducible character renders chronic demyelinating TME a highly valuable model for further studies on glial scar formation in demyelinating diseases. Moreover, the distinct spatio‐temporal pattern of matrix deposition allows to analyze the impact of individual ECM components to this condition and to modulate them subsequently for therapeutic strategies. Finally, morphological approaches may occasionally be superior to molecular methods in order to detect mild but slowly progressive alterations.
Supporting information
Table S1. Probe set IDs of the Affymetrix mouse genome 430 2.0 array, official gene symbols and titles, and relative fold changes with respective p‐values of all 350 probe sets manually selected for further analysis.
Table S2. Probe set IDs of the Affymetrix mouse genome 430 2.0 array, official gene symbols and titles, and relative fold changes with respective P‐values for probe sets related to chondroitin sulfate biosynthesis, heparan sulfate biosynthesis, keratan sulfate biosynthesis and fibrosis, and differentially expressed between TMEV‐infected and mock‐infected mice in the time course of TME.
Supporting info item
Supporting info item
ACKNOWLEDGMENTS
The authors wish to thank Anuschka Unold, Thomas Feidl and Martin Gamber for their excellent technical support with the microarray technology; Petra Grünig and Bettina Buck for their technical assistance with histochemistry and immunohistology; as well as Stephanie Klein, Frauke Seehusen, Ingo Gerhauser, Frank Seeliger, Heinz Theobald and Michael Müller for support with the animal experiments. The BeAn strain of TMEV was a generous gift of Dr H. L. Lipton, Department of Microbiology & Immunology, University of Illinois, Chicago, IL, USA. This study was in part supported by the German Research Foundation (FOR 1103; BA 815/10‐1).
Support: Scholarship of the Boehringer Ingelheim Pharma GmbH & Co. KG, Biberach a.d. Riss, Germany (VH). Grant of the Center for Systems Neuroscience, Hannover, Germany (RU).
REFERENCES
- 1. Akiyama Y, Honmou O, Kato T, Uede T, Hashi K, Kocsis JD (2001) Transplantation of clonal neural precursor cells derived from adult human brain establishes functional peripheral myelin in the rat spinal cord. Exp Neurol 167:27–39. [DOI] [PubMed] [Google Scholar]
- 2. Alldinger S, Fonfara S, Kremmer E, Baumgärtner W (2000) Up‐regulation of the hyaluronate receptor CD44 in canine distemper demyelinated plaques. Acta Neuropathol (Berl) 99:138–146. [DOI] [PubMed] [Google Scholar]
- 3. Back SA, Tuohy TM, Chen H, Wallingford N, Craig A, Struve J et al (2005) Hyaluronan accumulates in demyelinated lesions and inhibits oligodendrocyte progenitor maturation. Nat Med 11:966–972. [DOI] [PubMed] [Google Scholar]
- 4. Bancroft JD, Gamble M (2002) Theory and Practice of Histological Techniques, 5th edn. Churchill Livingstone: London. [Google Scholar]
- 5. Bolstad BM, Irizarry RA, Astrand M, Speed TP (2003) A comparison of normalization methods for high density oligonucleotide array data based on variance and bias. Bioinformatics 19:185–193. [DOI] [PubMed] [Google Scholar]
- 6. Brouwer N, Zuurman MW, Wei T, Ransohoff RM, Boddeke HW, Biber K (2004) Induction of glial L‐CCR mRNA expression in spinal cord and brain in experimental autoimmune encephalomyelitis. Glia 46:84–94. [DOI] [PubMed] [Google Scholar]
- 7. Bruckner G, Grosche J, Hartlage‐Rubsamen M, Schmidt S, Schachner M (2003) Region and lamina‐specific distribution of extracellular matrix proteoglycans, hyaluronan and tenascin‐R in the mouse hippocampal formation. J Chem Neuroanat 26:37–50. [DOI] [PubMed] [Google Scholar]
- 8. Busch SA, Silver J (2007) The role of extracellular matrix in CNS regeneration. Curr Opin Neurobiol 17:120–127. [DOI] [PubMed] [Google Scholar]
- 9. Clatch RJ, Lipton HL, Miller SD (1986) Characterization of Theiler's murine encephalomyelitis virus (TMEV)‐specific delayed‐type hypersensitivity responses in TMEV‐induced demyelinating disease: correlation with clinical signs. J Immunol 136:920–927. [PubMed] [Google Scholar]
- 10. Constantine VS, Mowry RW (1968) Selective staining of human dermal collagen. II. The use of picrosirius red F3BA with polarization microscopy. J Invest Dermatol 50:419–423. [DOI] [PubMed] [Google Scholar]
- 11. Davies JE, Tang X, Denning JW, Archibald SJ, Davies SJ (2004) Decorin suppresses neurocan, brevican, phosphacan and NG2 expression and promotes axon growth across adult rat spinal cord injuries. Eur J Neurosci 19:1226–1242. [DOI] [PubMed] [Google Scholar]
- 12. de Mestre AM, Staykova MA, Hornby JR, Willenborg DO, Hulett MD (2007) Expression of the heparan sulfate‐degrading enzyme heparanase is induced in infiltrating CD4+ T cells in experimental autoimmune encephalomyelitis and regulated at the level of transcription by early growth response gene 1. J Leukoc Biol 82:1289–1300. [DOI] [PubMed] [Google Scholar]
- 13. Faulkner JR, Herrmann JE, Woo MJ, Tansey KE, Doan NB, Sofroniew MV (2004) Reactive astrocytes protect tissue and preserve function after spinal cord injury. J Neurosci 24:2143–2155. [DOI] [PMC free article] [PubMed] [Google Scholar]
- 14. Fawcett JW, Asher RA (1999) The glial scar and central nervous system repair. Brain Res Bull 49:377–391. [DOI] [PubMed] [Google Scholar]
- 15. Gruber HE, Ingram J, Hanley EN Jr (2002) An improved staining method for intervertebral disc tissue. Biotech Histochem 77:81–83. [PubMed] [Google Scholar]
- 16. Gutowski NJ, Newcombe J, Cuzner ML (1999) Tenascin‐R and C in multiple sclerosis lesions: relevance to extracellular matrix remodelling. Neuropathol Appl Neurobiol 25:207–214. [DOI] [PubMed] [Google Scholar]
- 17. Hermanns S, Klapka N, Muller HW (2001) The collagenous lesion scar—an obstacle for axonal regeneration in brain and spinal cord injury. Restor Neurol Neurosci 19:139–148. [PubMed] [Google Scholar]
- 18. Hermanns S, Reiprich P, Muller HW (2001) A reliable method to reduce collagen scar formation in the lesioned rat spinal cord. J Neurosci Methods 110:141–146. [DOI] [PubMed] [Google Scholar]
- 19. Ibrahim SM, Mix E, Bottcher T, Koczan D, Gold R, Rolfs A, Thiesen HJ (2001) Gene expression profiling of the nervous system in murine experimental autoimmune encephalomyelitis. Brain 124:1927–1938. [DOI] [PubMed] [Google Scholar]
- 20. Jones LL, Margolis RU, Tuszynski MH (2003) The chondroitin sulfate proteoglycans neurocan, brevican, phosphacan, and versican are differentially regulated following spinal cord injury. Exp Neurol 182:399–411. [DOI] [PubMed] [Google Scholar]
- 21. Kanehisa M, Goto S (2000) KEGG: Kyoto encyclopedia of genes and genomes. Nucleic Acids Res 28:27–30. [DOI] [PMC free article] [PubMed] [Google Scholar]
- 22. Klapka N, Hermanns S, Straten G, Masanneck C, Duis S, Hamers FP et al (2005) Suppression of fibrous scarring in spinal cord injury of rat promotes long‐distance regeneration of corticospinal tract axons, rescue of primary motoneurons in somatosensory cortex and significant functional recovery. Eur J Neurosci 22:3047–3058. [DOI] [PubMed] [Google Scholar]
- 23. Leek JT, Monsen E, Dabney AR, Storey JD (2006) EDGE: extraction and analysis of differential gene expression. Bioinformatics 22:507–508. [DOI] [PubMed] [Google Scholar]
- 24. Liesi P, Kauppila T (2002) Induction of type IV collagen and other basement‐membrane‐associated proteins after spinal cord injury of the adult rat may participate in formation of the glial scar. Exp Neurol 173:31–45. [DOI] [PubMed] [Google Scholar]
- 25. Lindberg RL, De Groot CJ, Montagne L, Freitag P, van der Valk P, Kappos L, Leppert D (2001) The expression profile of matrix metalloproteinases (MMPs) and their inhibitors (TIMPs) in lesions and normal appearing white matter of multiple sclerosis. Brain 124:1743–1753. [DOI] [PubMed] [Google Scholar]
- 26. Lindberg RL, De Groot CJ, Certa U, Ravid R, Hoffmann F, Kappos L, Leppert D (2004) Multiple sclerosis as a generalized CNS disease–comparative microarray analysis of normal appearing white matter and lesions in secondary progressive MS. J Neuroimmunol 152:154–167. [DOI] [PubMed] [Google Scholar]
- 27. Luna LG (1968) Manual of Histologic Staining Methods of the Armed Forces Institute of Pathology, 3rd edn. McGraw‐Hill Book Company: New York. [Google Scholar]
- 28. McKeon RJ, Jurynec MJ, Buck CR (1999) The chondroitin sulfate proteoglycans neurocan and phosphacan are expressed by reactive astrocytes in the chronic CNS glial scar. J Neurosci 19:10778–10788. [DOI] [PMC free article] [PubMed] [Google Scholar]
- 29. Miao Q, Baumgärtner W, Failing K, Alldinger S (2003) Phase‐dependent expression of matrix metalloproteinases and their inhibitors in demyelinating canine distemper encephalitis. Acta Neuropathol 106:486–494. [DOI] [PubMed] [Google Scholar]
- 30. Mohan H, Krumbholz M, Sharma R, Eisele S, Junker A, Sixt M et al (2010) Extracellular matrix in multiple sclerosis lesions: Fibrillar collagens, biglycan and decorin are upregulated and associated with infiltrating immune cells. Brain Pathol 20:966–975. [DOI] [PMC free article] [PubMed] [Google Scholar]
- 31. Moore BB, Kolodsick JE, Thannickal VJ, Cooke K, Moore TA, Hogaboam C et al (2005) CCR2‐mediated recruitment of fibrocytes to the alveolar space after fibrotic injury. Am J Pathol 166:675–684. [DOI] [PMC free article] [PubMed] [Google Scholar]
- 32. Navarrete‐Talloni MJ, Kalkuhl A, Deschl U, Ulrich R, Kummerfeld M, Rohn K et al (2010) Transient peripheral immune response and central nervous system leaky compartmentalization in a viral model for multiple sclerosis. Brain Pathol 20:890–901. [DOI] [PMC free article] [PubMed] [Google Scholar]
- 33. Parish CR, Hindmarsh EJ, Bartlett MR, Staykova MA, Cowden WB, Willenborg DO (1998) Treatment of central nervous system inflammation with inhibitors of basement membrane degradation. Immunol Cell Biol 76:104–113. [DOI] [PubMed] [Google Scholar]
- 34. Prydz K, Dalen KT (2000) Synthesis and sorting of proteoglycans. J Cell Sci 113:193–205. [DOI] [PubMed] [Google Scholar]
- 35. Puchtler H, Waldrop FS, Valentine LS (1973) Polarization microscopic studies of connective tissue stained with picro‐sirius red FBA. Beitr Pathol 150:174–187. [DOI] [PubMed] [Google Scholar]
- 36. Schwab JM, Beschorner R, Nguyen TD, Meyermann R, Schluesener HJ (2001) Differential cellular accumulation of connective tissue growth factor defines a subset of reactive astrocytes, invading fibroblasts, and endothelial cells following central nervous system injury in rats and humans. J Neurotrauma 18:377–388. [DOI] [PubMed] [Google Scholar]
- 37. Sixt M, Engelhardt B, Pausch F, Hallmann R, Wendler O, Sorokin LM (2001) Endothelial cell laminin isoforms, laminins 8 and 10, play decisive roles in T cell recruitment across the blood‐brain barrier in experimental autoimmune encephalomyelitis. J Cell Biol 153:933–946. [DOI] [PMC free article] [PubMed] [Google Scholar]
- 38. Smith GM, Strunz C (2005) Growth factor and cytokine regulation of chondroitin sulfate proteoglycans by astrocytes. Glia 52:209–218. [DOI] [PubMed] [Google Scholar]
- 39. Smith RE, Strieter RM, Zhang K, Phan SH, Standiford TJ, Lukacs NW, Kunkel SL (1995) A role for C‐C chemokines in fibrotic lung disease. J Leukoc Biol 57:782–787. [DOI] [PubMed] [Google Scholar]
- 40. Sobel RA, Ahmed AS (2001) White matter extracellular matrix chondroitin sulfate/dermatan sulfate proteoglycans in multiple sclerosis. J Neuropathol Exp Neurol 60:1198–1207. [DOI] [PubMed] [Google Scholar]
- 41. Sobel RA, Mitchell ME (1989) Fibronectin in multiple sclerosis lesions. Am J Pathol 135:161–168. [PMC free article] [PubMed] [Google Scholar]
- 42. Stamenkovic I (2003) Extracellular matrix remodelling: the role of matrix metalloproteinases. J Pathol 200:448–464. [DOI] [PubMed] [Google Scholar]
- 43. Stichel CC, Hermanns S, Luhmann HJ, Lausberg F, Niermann H, D'Urso D et al (1999) Inhibition of collagen IV deposition promotes regeneration of injured CNS axons. Eur J Neurosci 11:632–646. [DOI] [PubMed] [Google Scholar]
- 44. Stohlman SA, Hinton DR (2001) Viral induced demyelination. Brain Pathol 11:92–106. [DOI] [PMC free article] [PubMed] [Google Scholar]
- 45. Takahashi H, Matsumoto H, Kumon Y, Ohnishi T, Freeman C, Imai Y, Tanaka J (2007) Expression of heparanase in nestin‐positive reactive astrocytes in ischemic lesions of rat brain after transient middle cerebral artery occlusion. Neurosci Lett 417:250–254. [DOI] [PubMed] [Google Scholar]
- 46. Tang X, Davies JE, Davies SJ (2003) Changes in distribution, cell associations, and protein expression levels of NG2, neurocan, phosphacan, brevican, versican V2, and tenascin‐C during acute to chronic maturation of spinal cord scar tissue. J Neurosci Res 71:427–444. [DOI] [PubMed] [Google Scholar]
- 47. Tanuma N, Sakuma H, Sasaki A, Matsumoto Y (2006) Chemokine expression by astrocytes plays a role in microglia/macrophage activation and subsequent neurodegeneration in secondary progressive multiple sclerosis. Acta Neuropathol 112:195–204. [DOI] [PubMed] [Google Scholar]
- 48. Toft‐Hansen H, Nuttall RK, Edwards DR, Owens T (2004) Key metalloproteinases are expressed by specific cell types in experimental autoimmune encephalomyelitis. J Immunol 173:5209–5218. [DOI] [PubMed] [Google Scholar]
- 49. Toft‐Hansen H, Fuchtbauer L, Owens T (2011) Inhibition of reactive astrocytosis in established experimental autoimmune encephalomyelitis favors infiltration by myeloid cells over T cells and enhances severity of disease. Glia 59:166–176. [DOI] [PubMed] [Google Scholar]
- 50. Tsunoda I, Fujinami RS (1996) Two models for multiple sclerosis: experimental allergic encephalomyelitis and Theiler's murine encephalomyelitis virus. J Neuropathol Exp Neurol 55:673–686. [DOI] [PubMed] [Google Scholar]
- 51. Tsunoda I, Libbey JE, Fujinami RS (2007) TGF‐beta1 suppresses T cell infiltration and VP2 puff B mutation enhances apoptosis in acute polioencephalitis induced by Theiler's virus. J Neuroimmunol 190:80–89. [DOI] [PMC free article] [PubMed] [Google Scholar]
- 52. Ulrich R, Baumgärtner W, Gerhauser I, Seeliger F, Haist V, Deschl U, Alldinger S (2006) MMP‐12, MMP‐3, and TIMP‐1 are markedly upregulated in chronic demyelinating theiler murine encephalomyelitis. J Neuropathol Exp Neurol 65:783–793. [DOI] [PubMed] [Google Scholar]
- 53. Ulrich R, Seeliger F, Kreutzer M, Germann PG, Baumgärtner W (2008) Limited remyelination in Theiler's murine encephalomyelitis due to insufficient oligodendroglial differentiation of nerve/glial antigen 2 (NG2)‐positive putative oligodendroglial progenitor cells. Neuropathol Appl Neurobiol 34:603–620. [DOI] [PubMed] [Google Scholar]
- 54. Ulrich R, Kalkuhl A, Deschl U, Baumgärtner W (2010) Machine learning approach identifies new pathways associated with demyelination in a viral model of multiple sclerosis. J Cell Mol Med 14:434–448. [DOI] [PMC free article] [PubMed] [Google Scholar]
- 55. van Horssen J, Bo L, Vos CM, Virtanen I, de Vries HE (2005) Basement membrane proteins in multiple sclerosis‐associated inflammatory cuffs: potential role in influx and transport of leukocytes. J Neuropathol Exp Neurol 64:722–729. [DOI] [PubMed] [Google Scholar]
- 56. van Horssen J, Bo L, Dijkstra CD, de Vries HE (2006) Extensive extracellular matrix depositions in active multiple sclerosis lesions. Neurobiol Dis 24:484–491. [DOI] [PubMed] [Google Scholar]
- 57. van Horssen J, Vos CM, Admiraal L, van Haastert ES, Montagne L, van der Valk P, de Vries HE (2006) Matrix metalloproteinase‐19 is highly expressed in active multiple sclerosis lesions. Neuropathol Appl Neurobiol 32:585–593. [DOI] [PubMed] [Google Scholar]
- 58. van Horssen J, Dijkstra CD, de Vries HE (2007) The extracellular matrix in multiple sclerosis pathology. J Neurochem 103:1293–1301. [DOI] [PubMed] [Google Scholar]
- 59. Wang X, Messing A, David S (1997) Axonal and nonneuronal cell responses to spinal cord injury in mice lacking glial fibrillary acidic protein. Exp Neurol 148:568–576. [DOI] [PubMed] [Google Scholar]
- 60. Wolswijk G (2000) Oligodendrocyte survival, loss and birth in lesions of chronic‐stage multiple sclerosis. Brain 123:105–115. [DOI] [PubMed] [Google Scholar]
- 61. Wynn TA (2008) Cellular and molecular mechanisms of fibrosis. J Pathol 214:199–210. [DOI] [PMC free article] [PubMed] [Google Scholar]
- 62. Zoecklein LJ, Pavelko KD, Gamez J, Papke L, McGavern DB, Ure DR et al (2003) Direct comparison of demyelinating disease induced by the Daniel's strain and BeAn strain of Theiler's murine encephalomyelitis virus. Brain Pathol 13:291–308. [DOI] [PMC free article] [PubMed] [Google Scholar]
Associated Data
This section collects any data citations, data availability statements, or supplementary materials included in this article.
Supplementary Materials
Table S1. Probe set IDs of the Affymetrix mouse genome 430 2.0 array, official gene symbols and titles, and relative fold changes with respective p‐values of all 350 probe sets manually selected for further analysis.
Table S2. Probe set IDs of the Affymetrix mouse genome 430 2.0 array, official gene symbols and titles, and relative fold changes with respective P‐values for probe sets related to chondroitin sulfate biosynthesis, heparan sulfate biosynthesis, keratan sulfate biosynthesis and fibrosis, and differentially expressed between TMEV‐infected and mock‐infected mice in the time course of TME.
Supporting info item
Supporting info item