

Abstract
Epidemiological studies reveal that metabolic disorders, and specifically type 2 diabetes (T2D), are relevant risk factors to develop Alzheimer's disease (AD) and vascular dementia (VaD), the most common causes of dementia. AD patients are in a tremendous need of new therapeutic options because of the limited success of available treatments. Natural polyphenols, and concretely Mangifera indica Linn extract (MGF), have been reported to have antiinflammatory, antioxidant and antidiabetic activities. The role of MGF in central complications associated with T2D, after long‐term treatment of db/db mice with MGF was analyzed. Metabolic parameters (body weight, glucose and insulin levels) as well as central complications including brain atrophy, inflammatory processes, spontaneous bleeding, tau phosphorylation and cognitive function in db/db mice treated with MGF for 22 weeks were assessed. MGF limits body weight gain in obese db/db mice. Insulin and C‐peptide levels, indicative of pancreatic function, were longer maintained in MGF‐treated animals. MGF reduced central inflammation by lowering microglia burden, both in the cortex and the hippocampus. Likewise, central spontaneous bleeding was significantly reduced in db/db mice. Cortical and hippocampal atrophy was reduced in db/db mice and tau hyperphosphorylation was lower after MGF treatment, resulting in partial recovery of learning and memory disabilities. Altogether, the data suggested that MGF treatment may provide a useful tool to target different aspects of AD and VaD pathology, and could lead to more effective clinical therapies for the prevention of metabolic related central complications associated with AD and VaD.
Keywords: Alzheimer's disease, diabetes, hemorrhage, inflammation, mango leaf extract, vascular dementia
Introduction
Diabetes mellitus is one of the most prevalent diseases in western countries. The total number of people with diabetes is projected to rise up to 366 million in 2030 57, and about 90% of all the cases are type 2 diabetes (T2D) patients 20. Also, T2D is a relevant risk factor to suffer Alzheimer's disease (AD) and vascular dementia (VaD) 6, 35. AD and VaD are the most common causes of dementia among elderly people 42. AD pathological features include amyloid plaques, neurofibrillary tangles mainly formed by abnormally phosphorylated tau protein and neuronal and synaptic loss 48. VaD is a heterogeneous disease that can range from multiple microinfarcts to small vessel ischemic disease and microvascular injury 6. Also, the borderlines between AD and VaD are blurred in many cases and markers of vascular disease coexist with AD neuropathological features. It has been suggested that T2D associated inflammation and vascular damage may explain its implication in the development of AD and VaD. Also, insulin and Aβ are degraded by insulin degrading enzyme and neprilisin, and it is feasible that substrates are competing at this level, contributing both to AD and T2D pathogenesis 20. Insulin receptors localize in the cortex and hippocampus, explaining its role in learning and memory. Also, insulin may contribute to abnormal tau phosphorylation in the central nervous system, leading to AD 46. Additionally, T2D animal models present increased tau phosphorylation, brain atrophy, enlarged central inflammation or spontaneous bleeding, responsible for cognitive alterations 40, in a similar way to that observed in AD and VaD. Moreover, these effects are synergistically worsened when both AD and T2D coexist 25, 41, 52.
At present, AD has no successful treatment. Current pharmacological approaches are limited to anticholinesterase drugs or memantin. Therefore, additional treatment options are urgently needed for AD patients [for review see 45]. Although T2D treatment has evident limitations, therapeutic alternatives are increasing, including metformin, sulphonylureas, insulin and its analogs or glucagon‐like peptide‐1 agonists among others 12. Also, natural extracts have been widely reported 16, 56 to effectively treat complex diseases 29, and it is noteworthy that natural products contribute to more than one‐third of all FDA‐approved new molecular entities 37. Following this idea, Mangifera indica Linn extract (MGF) and derivatives have been recently shown to dramatically control metabolic alterations in diabetes models 1, 21, improving glycemic control, insulin resistance or reducing diabetes associated inflammation and oxidative stress. Therefore it is feasible that potent MGF extract may also ameliorate central alterations associated to T2D. In our hands, chronic MGF treatment not only improves metabolic control in db/db mice, it also limits central atrophy, tau hyperphosphorylation, inflammation and spontaneous bleeding. MGF treatment also improves learning and memory function. Therefore, this approach opens the door to new therapeutic options, that may significantly improve central pathology in dementia processes.
Material and Methods
Animals and treatments
We used the leptin receptor KO mouse db/db as a model of obesity and T2D. The introduction of an RsaI site by the Leprdb mutation in the leptin receptor gene was detected by 126 PCR as previously described 26. C57BL/KsJ heterozygous db/+ mice were purchased from Harlan Laboratories (Boxmeer, The Netherlands). Wild type, db/db and db/+ mice were generated from crosses between heterozygous db/+ mice and all mice were genotyped as previously described 13. As heterozygous (db/+) mice do not show specific phenotype at central or peripheral level 26, 38, wild type and db/+ mice were included in the control group.
Mango leaf extract was obtained by subcritical water extraction as previously described 14. Briefly, extractions were carried out with subcritical water as extracting solvent at a pressure of 20 MPa, a temperature of 60°C and a flow rate of 10 g/min for 3 h to guarantee high phenolic content and avoid degradation of the phenolic compounds 14. While MGF water solubility is limited, this extraction procedure avoids any potentially toxic solvent. The extraction procedure was as follows: (i) the sample (150 g of dried mango leaves) was loaded into the extraction vessel, which was fitted with metal filters at top and bottom; (ii) the cell containing the sample was pre‐heated; (iii) dynamic extraction was performed under the appropriated conditions; (iv), extracts were recovered in a cyclonic separator, collected in amber flasks, filtered and stored in their respective solvent in darkness. Presence of phenolic compounds in 100 g of MGF was as follows (in g): iriflophenone 3‐C‐β‐D‐glucoside (11.70 ± 0.10), iriflophenone 3‐C‐(2‐O‐p‐hydroxybenzoyl) (2.13 ± 0.07), mangiferin (7.62 ± 0.16), quercetin 3‐D‐galactoside (2.23 ± 0.15), quercetin 3‐β‐D‐glucoside (7.34 ± 0.12), quercetin‐3‐O‐xyloside (1.50 ± 0.14), quercetin 3‐O‐α‐L‐arabinopyranoside (1.09 ± 0.02) and 1,2,3,4,6‐penta‐O‐galloyl‐β‐D‐glucose (1.09 ± 0.02) 14.
Offspring were randomly divided in groups and received MGF or control diet starting at 6 weeks of age. Treatment continued up to 26 weeks of age. MGF was included in food pellets. Regular powder diet (SAFE A04, France) was mixed with aqueous MGF extract (28.6 mg/mL). Initial assessment of food intake revealed and average intake or 4 g/day in case of nondiabetic mice and 6 g/day in case of diabetic mice. Dosage was adjusted to 50 mg/kg/day, in the range of previous studies 18, 28, and the mixture was pelletized at 37°C overnight before administered to the animals. Untreated animals followed the same approach without receiving MGF in the diet. We included 9–12 mice per group (Control = 12, Control‐MGF = 11, db/db = 10 and db/db‐MGF = 9) for in vivo studies and 7–9 mice were analyzed in postmortem studies (Control = 7, Control‐MGF = 7, db/db = 7 and db/db‐MGF = 7). All experimental procedures were approved by the Animal Care and Use Committee (University of Cadiz), in accordance with the Guidelines for Care and Use of experimental animals (European Commission Directive 2010/63/UE; Spanish Royal Decree 53/2013).
Metabolic determinations
Body weight, postprandial blood glucose and insulin levels were determined immediately before commencing the treatment, at 6 weeks of age, and at 10, 14 and 26 weeks of age as described 39. C‐peptide levels were detected in plasma from all groups by ELISA (ALPCO Diagnostic, Salem, NH) following manufacturer's indications.
Actimetry and new object discrimination (NOD) task
Spontaneous locomotor activity was evaluated as previously described 40. Habituation to the environment (a transparent rectangular box: 22 cm long × 44 cm width × 40 cm high) on day 1, was followed by habituation to objects on day 2, that were no longer used on trial day. On day 3 each mouse received two sample trials and a test trial. On the first sample trial the box contained four copies of a novel object (blue balls) arranged in a triangle‐shaped spatial configuration and mice were allowed to explore for 5 min. After 30 min, the mice received a second sample trial with four novel objects (red cones), arranged in a quadratic‐shaped spatial configuration, for 5 min. After 30 min, the mice performed a test trial with two copies of the object from sample trial two (“recent” objects) placed at the same position, and two copies of “familiar” objects from sample trial 1 (placed one of them at the same position as “old non‐displaced” object and the another in a new position as “familiar displaced” object). Integrated episodic memory was analyzed for “what,” “where” and “when” was analyzed as previously described 11.
Morris water maze t (MWM) test
Spatial memory was evaluated as previously described 40. Experiments commenced the day after concluding the NOD test for all the groups. Along the acquisition phase animals performed four trials/day (60 s/trial) for 4 days, with the platform submerged in the quadrant 2. The retention phase consisted in a single trial with the platform removed. Retention 1 took place 24 h after completing the acquisition phase and retention 2, 72 h after the acquisition phase. Time required to locate the platform in the acquisition phase, percentage of time spent in quadrant 2 during the retention phase and swim speed were analyzed using Smart software (Panlab, Spain).
Cresyl violet and Prussian blue staining
Brain morphology was analyzed after cresyl violet staining in sections selected 1 mm apart from each other (from 1–5 to −3.5 mm from Bregma). Cortical and hippocampal thickness were measured using Image J software as previously described 40.
Prussian blue iron staining was used to stain spontaneous hemorrhages followed by neutral red counterstaining. Consecutive sections to the ones used for cresyl violet staining were processed as previously described 25. Images were acquired with an optical Olympus Bx60 microscope with an attached Olympus DP71 camera and Cell F software (Olympus, Hamburg, Germany). Number of hemorrhages, individual hemorrhage size and hemorrhage burden (percentage of area affected) in the cortex and hippocampus were analyzed using Image J software.
Caspase activation
Caspases 3/7 activity was analyzed in cortical homogenates using the Caspase‐Glo 3/7 assay (Promega, Madrid, Spain), following manufacturer's indications. Luminescence signal was measured in the Biotek Synergy Mx Microplate Reader and data were expressed as percentage of control values.
Total tau and phospho‐tau levels
Western blot for phospho‐tau and total‐tau levels were performed in fresh tissue as previously described 38. Briefly, 50 µg of protein from cortex and hippocampus were loaded and separated on 10% acrylamide‐bisacrylamide gels. Proteins were transferred to PVDF membranes and then immersed in blocking buffer (Invitrogen) for 1 h. Membranes were incubated at 4°C with primary antibodies: anti‐phospho‐tau (1:1000, clone AT8; Fisher Scientific, Waltham, MA), anti‐total tau (1:1000; DAKO, Glostrup, Denmark) and anti‐β‐actin (1:2,500,000, Sigma, The United States). Signal was detected using Novex AP Chemiluminescent Substrate (Invitrogen, Carls‐bad, The United States) and Kodak Biomax Light Film (Sigma, The United States). Subsequent primary antibodies incubations were preceded by stripping, using Western Blot Stripping Buffer (Fisher Scientific, Waltham, MA). Optical density of each protein band was quantified using the Image J software. Data were represented as percentage of Control values.
Microglia and neuron immunohistochemistry
Inflammation was analyzed by microglia immunohistochemistry as previously described 38. Briefly, PFA‐fixed 30 µm sections were immunostained with anti‐IBA1 antibody (1:1000; Wako, Japan) followed by secondary goat anti‐rabbit conjugated to Alexa 488 (1:1000; Invitrogen, The United States). Images were acquired using a Laser Olympus U‐RFL‐T fluorescent microscope (Olympus, Japan) and MMIcellTools software and analyzed with ImageJ software to quantify microglia burden (percentage of area affected) as well as number and size of individual microglial cells in the cortex and hippocampus.
Contiguous sections were used for neuron inmunostaining. Sections were incubated in anti‐NeuN antibody (1:200; Chemicon, The United States), and conjugated goat anti‐mouse Alexa 594 (1:1000; Invitrogen, The United States) was used as secondary antibody. Sections were washed and stained with DAPI 1 mg/mL (1:3000; Sigma, St. Louis, MO). The percentage of NeuN‐positive cells (normalized by total cells stained with DAPI) was quantified in the cortex and hippocampus of all groups under study.
Statistical analysis
One‐way ANOVA for independent samples, followed by Tukey b or Tamhane tests, was used. Two‐way ANOVA (group × day) was used to analyze the MWM and metabolic evolution (group × week). Correlation studies between metabolic parameters and central observations were performed by Pearson's correlation studies. SPSS v.13 software was used for all statistical analysis.
Results
Improvement of metabolic parameters after long‐term MGF treatment
We detected a significant group × week effect when body weight was compared among groups [F(9,121) = 3.59, **P < 0.01]. Individual weekly assessment revealed that before commencement of the treatment, body weight was significantly increased in db/db and db/db‐MGF treated mice [F(3,37) = 19.12, ††P < 0.0.1 vs. Control and Control‐MGF]. A similar trend was observed by 10 weeks of age [F(3,37) = 53.03, ††P < 0.01 vs. Control and Control‐MGF]. By 14 weeks of age body weight was slightly higher in db/db mice than in db/db‐MFG treated animals, although differences did not reach statistical significance [F(3,37) = 30.46, ††P < 0.0.1 vs. Control and Control‐MGF]. However, by 26 weeks of age body weight was significantly lower in db/db‐MGF treated mice when compared with db/db animals [F(3,35) = 16.54, **P < 0.01 vs. rest of the groups, ††P < 0.01 vs. Control and Control‐MGF] (Figure 1A). We also detected a significant group × week effect when we analyzed postprandial glucose levels [F(9,116) = 3.43, **P < 0.01]. By 6 weeks of age glucose levels were significantly higher in db/db mice [F(3,37) = 29.21, ††P < 0.0.1 vs. Control and Control‐MGF], and this differences were maintained along the experiment (10 weeks [F(3,36) = 74.17, ††P < 0.01 vs. Control and Control‐MGF], 14 weeks [F(3,39) = 174.56, ††P < 0.0.1 vs. Control and Control‐MGF], 26 weeks [F(3,38) = 377.00, ††P < 0.0.1 vs. Control and Control‐MGF] (Figure 1B). Insulin levels were progressively reduced in db/db mice, as pancreas became exhausted, however db/db‐MGF treated mice maintained high insulin levels longer when compared with db/db mice. We detected a group × week effect when insulin levels were compared [F(9,113) = 6.10, **P < 0.01]. By 6 weeks of age insulin levels were significantly higher in db/db groups [F(3,34) = 20.73, ††P < 0.01 vs. Control and Control‐MGF]. By 10 weeks of age (4 under treatment) we observed that insulin levels were longer maintained in db/db‐MGF treated mice, although differences did not reach statistical significance [F(3,36) = 3.45, †P < 0.01 vs. Control and Control‐MGF]. Differences reached statistical significance after 8 weeks under treatment (14 weeks of age) and insulin levels were significantly higher in db/db‐MGF treated mice ([F(3,38) = 33.59, **P < 0.01 vs. rest of the groups, ††P < 0.01 vs. Control and Control‐MGF]). A significant reduction of insulin levels was observed in all db/db mice by 26 weeks of age [F(3,39) = 52.86, ††P < 0.01 vs. Control and Control‐MGF] (Figure 1C). C‐peptide levels followed a similar profile and an overall treatment × group effect was detected [F(9,113) = 6.10, **P < 0.01]. C‐peptide was already increased by 6 weeks of age [F(3,18) = 7.38, ††P = 0.002 vs. Control and Control‐MGF]. Pancreas was longer preserved in db/db‐MGF treated mice, as observed by 10 weeks of age in diabetic mice [F(3,17) = 6.46, ††P < 0.01 vs. Control and Control‐MGF] and differences reached statistical significance by 14 weeks of age [F(3,17) = 20.88, **P < 0.01 vs. rest of the groups, ††P < 0.01 vs. Control and Control‐MGF], whereas differences were no longer detected by 26 weeks of age [F(3,18) = 1.91, P = 0.164]) (Figure 1D).
Figure 1.
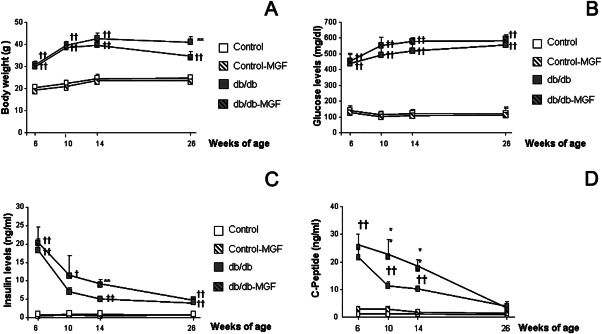
MGF treatment improves metabolic state in db/db mice. (A) Body weight increase in db/db mice is partially controlled by MGF treatment (6, 10, 14 and 26 weeks: **p < 0.01 vs. rest of the groups, ††P < 0.0.1 vs. Control and Control‐MGF). (B) Glucose levels are not affected by MGF treatment (6, 10, 14 and 26 weeks of age ††P < 0.0.1 vs. Control and Control‐MGF). (C) Insulin levels are longer maintained in db/db mice when treated with MGF (6, 10, 14 and 26 weeks: **P < 0.01 vs. rest of the groups, ††P < 0.0.1 vs. Control and Control‐MGF). (D) A similar trend is observed for C‐peptide levels (6, 10 and 14 weeks: **P < 0.01 vs. rest of the groups, ††P < 0.0.1 vs. Control and Control‐MGF; 26 weeks: P = 0.191).
MGF treatment improves cognitive alterations in db/db mice
Episodic memory was significantly impaired in 6 months old db/db mice as previously described 40. In the NOD, long‐term MGF treatment had a limited effect on “where” paradigm [F(3,107) = 20.752, ††P < 0.01 vs. Control and Control‐MGF]. However “what” [F(3,104) = 41.043, **P < 0.01 vs. rest of the groups, ††P < 0.01 vs. Control and control‐MFG78] and “when” [F(3,100) = 17.451, **P < 0.01 vs. rest of the groups, ††P < 0.01 vs. Control and Control‐MGF] paradigms were significantly improved after MGF treatment (Figure 2A). Also, spatial memory was improved after MGF treatment in db/db mice. We detected a significant group × day effect [F(9,571) = 1.999, *P = 0.037] during the acquisition phase in the MWM test. Further daily assessment revealed that learning impairment observed in db/db mice partially recovered after MGF treatment (day 1 [F(7,156) = 2.319, P = 0.078], day 2 [F(3,153) = 13.155, ††P < 0.01 vs. Control and Control‐MGF, ‡‡P < 0.01 vs. Control], day 3 [F(3,145) = 20.5262, **P < 0.01 vs. rest of the groups, ††P < 0.01 vs. Control and Control‐MGF], day 4 [F(3,153) = 24.062, **P < 0.01 vs. rest of the groups, ††P < 0.01 vs. Control and Control‐MGF]) (Figure 2B). MGF treatment also improved spatial memory in the retention phase: db/db‐MGF mice spent significantly longer times in quadrant 2, where the platform used to be located (retention 1 [F(7,37) = 3.13, P = 0.037, †P = 0.037 vs. Control and Control‐MGF]; retention 2 [F(3,34) = 3.29, *P = 0.032 vs. rest of the groups]) (Figure 2C).
Figure 2.
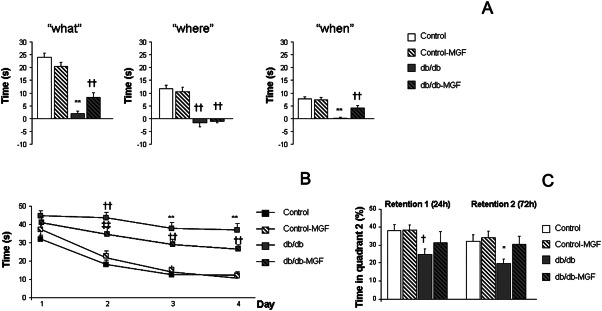
Long‐term MGF treatment rescues cognitive impairment. (A) While MGF treatment has a limited effect on “where” paradigm (††P < 0.01 vs. Control and Control‐MGF) a significant improvement is observed in “what” and “when” paradigms (**P < 0.01 vs. rest of the groups, ††P < 0.01 vs. Control and Control‐MGF). (B) Spatial learning impairment in the Morris water maze test is partially reverted after MGF treatment (day 1: P = 0.078, days 2, 3 and 4: **P < 0.01 vs. rest of the groups, ††P < 0.01 vs. Control and Control‐MGF, ‡‡P < 0.01 vs. Control). (C) A similar profile is observed in the retention phase of the Morris water maze test (retention 1: †P = 0.037 vs. Control and Control‐MGF); retention 2: *P = 0.032 vs. rest of the groups).
As db/db mice are severely overweight, motor activity was also evaluated in all groups. Although diabetic mice showed reduced motor activity, differences did not reach statistical significance when distance travelled was analyzed (Control: 30 289.95 ± 1382.33 cm, Control‐MGF: 27 741.43 ± 1132.91 cm; db/db: 23 704.14 ± 2811.74 cm, db/db‐MGF: 22 989.76 ± 809.36 cm/s, [F(3,16) = 2–30, P = 0.116]). Swimming velocity in the MWM test was significantly reduced in diabetic animals, although no differences were observed between db/db and db/db‐MGF mice (Control: 22.18 ± 1.59 cm/s, Control‐MGF: 23.60 ± 0.42 cm/s; db/db: 10.26 ± 1.00†† cm/s, db/db‐MGF: 10.53 ± 0.75†† cm/s, [F(3,38) = 42.61, ††P < 0.01 vs. Control and Control‐MGF]), suggesting that observed cognitive improvement in db/db‐MGF mice was not because of the motor activity alterations.
MGF treatment ameliorates central atrophy and caspase activation in db/db mice
Cortical thickness was significantly reduced in db/db mice, as previously shown 39 while MGF treatment preserved cortical integrity [F(3,612) = 9.63, **P < 0.01 vs. rest of the groups] (Figure 3A and B). A similar profile was observed in the hippocampus and MGF treatment significantly improved hippocampal thinning in db/db animals [F(3,317) = 4.29, ‡‡P = 0.06 vs. Control] (Figure 3A). When we analyzed NeuN‐positive cells, we detected a significant decrease in the proportion of neurons in db/db mice, while MGF significantly improved this ratio [F(3,1844) = 6.58, ††P < 0.06 vs. Control and Control‐MGF] (Figure 3C and D). Caspase activity was significantly increased in the cortex from db/db mice and this effect was reversed by MGF [F(3,22) = 4.24, *P = 0.016 vs. rest of the groups] (Figure 3E). A similar profile was observed in the hippocampus, although differences did not reach statistical significance [F(3,22) = 1.52, P = 0.23] (Figure 3E). Moreover, we also observed that central atrophy (as final brain weight) could be predicted by metabolic parameters (body weight, glucose, insulin and C‐peptide levels) and significant correlations were detected (Figure 3F).
Figure 3.
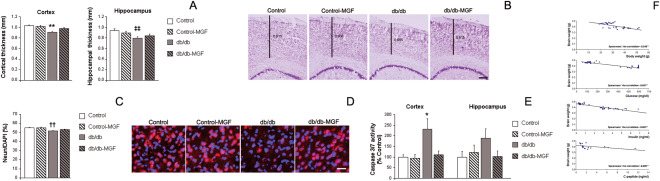
MGF treatment improves central atrophy in db/db mice. (A) Cortical thinning in db/db mice is limited by long‐term MGF treatment (**P < 0.01 vs. rest of the groups). A similar profile was observed in the hippocampus (P = 0.06 vs. Control). (B) Illustrative example of cresyl violet staining where cortical thinning can be observed in db/db mice while cortex is preserved in db/db‐MGF treated mice. Scale bar = 150 µm. (C) NeuN‐possitive cells are reduced in db/db mice and this effect is limited in db/db‐MGF treated mice (††P < 0.06 vs. Control and Control‐MGF). (D) Illustrative example of NeuN (red) immunostaining and DAPI (blue) counterstain: neurons are reduced in db/db mice and MGF restores this effect. Scale bar: 25 µm. (E) Caspase activation is significantly increased in the cortex from db/db mice while MGF treatment reduces this activation (*P = 0.016 vs. rest of the groups). A similar profile is observed in the hippocampus although differences do not reach statistical significance (P = 0.23). (F) Central atrophy (as final brain weight) could be predicted by metabolic parameters and significant correlations are observed (body weight: −0.548, **P < 0.01; glucose levels: −0.697, **P < 0.01; insulin levels: −0.863, **P < 0.01; C‐peptide levels: −0.689, **P < 0.01).
MGF treatment reduces tau hyperphosphorylation in db/db mice
Increased tau phosphorylation was detected in db/db mice as previously described 40. We observed that MGF treatment significantly reduced cortical phospho‐tau/total tau ratio [F(3,20) = 4.37, †P = 0.016 vs. Control and Control‐MGF] (Figure 4A and C) and a similar profile was observed in the hippocampus [F(3,19) = 3.65, ‡P = 0.031 vs. Control] (Figure 4B).
Figure 4.

MGF treatment reduces tau hyperphosphorylation and central bleeding in db/db mice. (A) Cortical phospho‐tau/total tau ratio is increased in db/db mice and this effect is reduced after MGF treatment (†P = 0.016 vs. Control and Control‐MGF]. (B) A similar profile is observed in the hippocampus (‡P = 0.031 vs. Control). (C) Illustrative example of cortical tau phosphorylation in all groups under study. (D) Cortical hemorrhage burden is significantly increased in db/db mice and this effect is reversed after MGF treatment (**P < 0.01 vs. rest of the groups) because of a reduction in the number of hemorrhages (**P < 0.01 vs. rest of the groups), while hemorrhage size is not affected (P = 0.654). (E) Illustrative example of cortical hemorrhages stained with Prussian blue. Green arrows point at individual hemorrhages. Scale bar= 250 µm. (F) Increased hemorrhage burden in db/db hippocampus is slightly reduced after MGF treatment, although differences do not reach statistical significance (P = 0.087). Hemorrhage density is significantly reduced after treatment (**P = 0.009 vs. rest of the groups), whereas hemorrhage size is not affected (P = 0262).
Spontaneous bleeding in db/db mice is reversed by long‐term MGF treatment
Hemorrhage burden was significantly increased in the cortex from db/db mice, as previously shown 25 and this effect was completely reversed by long‐term MGF treatment [F(3,114) = 12.70, **P < 0.01 vs. rest of the groups]. We also observed that increased hemorrhage burden was because of the larger hemorrhage densities (number of hemorrhages/mm2) in db/db mice, while MGF ameliorated this effect [F(3,112) = 12.48, **P < 0.01 vs. rest of the groups]. Individual hemorrhage size was similar among groups [F(3,3147) = 0.541, P = 0.654] (Figure 4D and E). A similar profile was detected in the hippocampus, although more subtle changes were observed. Individual hemorrhage size was not affected [F(3,489) = 0.541, P = 0.262]. Hemorrhage densities were reduced after MGF treatment [F(3,55) = 4.23, **P = 0.009 vs. rest of the groups], although these differences were not enough to reduce hemorrhage burden [F(3,52) = 12.70, P = 0.087] (Figure 4F).
Inflammatory response is reduced in db/db mice after MGF treatment
Microglia burden was significantly increased in the cortex from db/db mice, while a partial reduction of the inflammatory process was observed after MGF treatment [F(3,1585) = 12.06, **P < 0.01 vs. rest of the groups, ††P < 0.01 vs. Control and Control‐MFG]. This effect was mediated by both, a reduction of microglia size [F(3,8123) = 12.06, **P < 0.01 vs. rest of the groups, ††P < 0.01 vs. Control and Control‐MFG] and a reduction in microglia density (number of microglia cells/mm2) [F(3,1561) = 43.03, ††P < 0.01 vs. Control and Control‐MFG] (Figure 5A and B). Same profile was observed in the hippocampus where microglia burden was reduced in db/db‐MGF mice [F(3,312) = 7.19, **P < 0.01 vs. rest of the groups] because of a reduction of individual microglia size [F(3,1767) = 5.87, **P < 0.01 vs. rest of the groups] and microglia density [F(3,1313) = 14.60, **P < 0.01 vs. rest of the groups, ‡‡P < 0.01 vs. Control] (Figure 5C).
Figure 5.
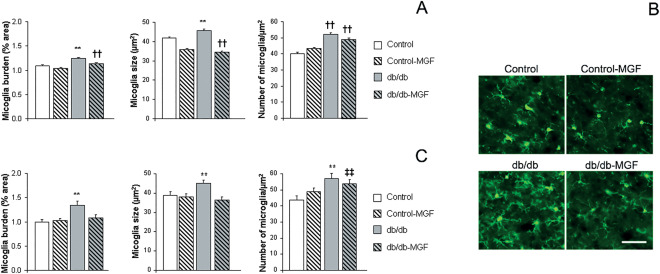
Inflammation is reduced after MGF treatment in db/db mice. (A) Increased cortical microglia burden in db/db mice is reduced after MGF treatment (**P < 0.01 vs. rest of the groups, †† P < 0.01 vs. Control and Control‐MFG) because of a reduction of individual microglia size and density (**P < 0.01 vs. rest of the groups, †† P < 0.01 vs. Control and Control‐MFG].B) Illustrative example of cortical microglia immunostaining with anti‐IBA1 antibody (green). Scale bar= 50 µm. (C) Microglia burden in db/db mice is also reduced in the hippocampus after MGF treatment (**P < 0.01 vs. rest of the groups). Microglia size and density is also reduced (**P < 0.01 vs. rest of the groups, ‡‡ P < 0.01 vs. Control).
Discussion
AD, followed by VaD, is the most common cause of dementia and has not successful treatment. While aging remains the main risk factor to develop AD, epidemiological and clinical studies reveal that T2D also increases the risk to develop dementia 35. AD patients are still in a tremendous need of new therapeutic options and previous attempts have been made to slow down the dementia process by controlling altered metabolism, both in patients and animal models 7, 24. Natural polyphenols, and concretely Mangifera Indica Linn extract has been shown to have antioxidant, antidiabetic and anti‐inflammatory activities [for review see 33, 54]. Therefore it is feasible that potent MGF extract may also significantly improve central alterations associated to T2D. Also, no evidence of adverse side effects, at estimated dietary intake levels, have been reported for phenolic compounds in our extract [44, for review 22, 54], and we did not detect any obvious differences in treated animals. However, as we did not specifically assess this aspect, we cannot exclude adverse side effects after long term treatments with MFG.
Metabolic assessment revealed that MGF treatment limited body weight gain. While we cannot point toward a single phenolic compound, responsible for observed beneficial effects, previous studies have shown that mangiferin may control glucose levels in high fat diet treated mice 1, and mangiferin extracts or derivatives also reduce glycemia in db/db mice 21, 53. In our hands, glucose levels were not significantly affected by MGF treatment. However, as our animals were aged up to 26 weeks of age, it is feasibly that severe hyperglycemia can no longer be counterbalanced by MGF treatment. On the other hand MGF treatment longer sustained insulin and C‐peptide levels, supporting the role of MGF in maintaining β‐pancreatic activity and metabolic control, as previously described 1, 55.
MGF improves cognition in normal rats 36 as well as in different models with learning and memory disabilities 3, 19, 27. However, to our knowledge spatial and episodic memory have not been assessed in db/db mice treated with MGF. T2D mice are cognitively impaired 25, 40 and long‐term MGF treatment significantly improved their performance both in the MWM and the NOD tests, supporting a role for MGF in central cognition problems associated with metabolic disease. Further assessment of central pathology revealed severe brain atrophy, affecting both cortex and hippocampus in db/db mice 40, while MGF treatment significantly reduced cortical and hippocampal atrophy. MRI studies in T2D patients have shown similar central complications 5, that may associate with cognitive decline 31. We also detected that NeuN/DAPI ratios were improved after MGF treatment and caspases 3/7 activation was reduced. Whereas we cannot point toward a single mechanism, it is feasible that cell death is reduced while neuronal population is protected by MGF treatment. As previously described, tau pathology was increased in the cortex and hippocampus from db/db mice 39, 40 and hyperphosphorylated tau has also been detected in the pancreas from T2D patients 34. At central level, tau hyperphosphorylation is a marker of neuropil dysfunction observed in neurodegenerative diseases, including AD and VaD 10, 48. Early alterations, and not necessarily tangles, may contribute to cognitive malfunction 23. In this line, it has been suggested that misfolded tau at synapses may represent early signs of neuronal degeneration and mediate synaptotoxicity 51. Also, autopsy studies have reported brains with neurofibrillary tangles that are indistinguishable from those of AD, in the absence of amyloid plaques, usually associated with mild cognitive impairment 8. Therefore it is feasible that reduced tau phosphorylation in db/db‐MGF treated mice is, at least partially, responsible of observed cognitive recovery. Our data are in accordance with previous studies showing that reduced tau phosphorylation, without affecting amyloid burden, might be enough to restore cognitive deficits in AD animal models 17, 43.
Both T1D and T2D mice 39, 40, as well as epidemiological studies, link diabetes with vascular disease 2, 4. Moreover, people with diabetes have more than double the risk of ischemic stroke and prolonged hyperglycemia is associated with microvascular complications [for review see 30]. In our hands, long‐term MGF treatment significantly improved spontaneous bleeding in db/db mice by controlling the appearance of new microbleeds. Inflammation is exacerbated in diabetic mice 9, 25, as well as in T2D patients 49, and it may underlie observed vascular damage 47, 50. Central neuroinflammation, accompanied by spontaneous bleeding, may interfere with proper blood brain barrier function and contribute to learning and memory disabilities. MGF has been previously characterized as an anti‐inflammatory and antioxidant agent, with utility in different models of brain injury 15, 32, and we also observed that long‐term MGF reduced microglia mediated inflammation in db/db. Altogether our data show that MGF improves metabolic control and reduces central inflammation and vascular damage in T2D mice. MGF also lowers tau hyperphosphorylation and limits cortical and hippocampal atrophy, rescuing severe learning and memory disabilities. It is, therefore, possible that MGF treatment may provide a useful tool to target metabolic related central pathology associated with AD and VaD.
Author Contributions
CI‐G and JJR‐R carried out the behavioural, metabolic and postmortem studies and analyzed the data. YM‐Z performed and analyzed inflammation studies. MTF‐P, LC and CM synthesized, analyzed and obtained MGF. MG‐A conceived the study, analyzed data and wrote the manuscript. All authors read and approved the final manuscript.
Acknowledgements
Fundacion Eugenio Rodriguez Pascual (2015). Proyectos de Excelencia, Consejería de Economía, Innovación, Ciencia y Empleo. Junta de Andalucia (P11‐CTS‐7847), ISCIII–Subdirección General de Evaluación y Fomento de la Investigación and cofinanced by the European Union (Fondo Europeo de Desarrollo Regional, FEDER) “Una manera de hacer Europa” PI12/00675 (Monica Garcia‐Alloza). The authors declare that they have no competing interests.
References
- 1. Apontes P, Liu Z, Su K, Benard O, Youn DY, Li X et al (2014) Mangiferin stimulates carbohydrate oxidation and protects against metabolic disorders induced by high‐fat diets. Diabetes 63:3626–3636. [DOI] [PMC free article] [PubMed] [Google Scholar]
- 2. Biessels GJ, Reijmer YD (2014) Brain changes underlying cognitive dysfunction in diabetes: what can we learn from MRI? Diabetes 63:2244–2252. [DOI] [PubMed] [Google Scholar]
- 3. Biradar SM, Joshi H, Chheda TK (2012) Neuropharmacological effect of Mangiferin on brain cholinesterase and brain biogenic amines in the management of Alzheimer's disease. Eur J Pharmacol 683:140–147. [DOI] [PubMed] [Google Scholar]
- 4. Brundel M, Reijmer YD, van Veluw SJ, Kuijf HJ, Luijten PR, Kappelle LJ, Biessels GJ (2014) Cerebral microvascular lesions on high‐resolution 7‐Tesla MRI in patients with type 2 diabetes. Diabetes 63:3523–3529. [DOI] [PubMed] [Google Scholar]
- 5. Brundel M, van den Heuvel M, de Bresser J, Kappelle LJ, Biessels GJ (2010) Cerebral cortical thickness in patients with type 2 diabetes. J Neurol Sci 299:126–130. [DOI] [PubMed] [Google Scholar]
- 6. Craft S (2009) The role of metabolic disorders in Alzheimer disease and vascular dementia: two roads converged. Arch Neurol 66:300–305. [DOI] [PMC free article] [PubMed] [Google Scholar]
- 7. Craft S, Baker LD, Montine TJ, Minoshima S, Watson GS, Claxton A et al (2012) Intranasal insulin therapy for Alzheimer disease and amnestic mild cognitive impairment: a pilot clinical trial. Arch Neurol 69:29–38. [DOI] [PMC free article] [PubMed] [Google Scholar]
- 8. Crary JF, Trojanowski JQ, Schneider JA, Abisambra JF, Abner EL, Alafuzoff I et al (2014) Primary age‐related tauopathy (PART): a common pathology associated with human aging. Acta Neuropathol 128:755–766. [DOI] [PMC free article] [PubMed] [Google Scholar]
- 9. Cheng ST, Chen L, Li SY, Mayoux E, Leung PS (2016) The Effects of Empagliflozin, an SGLT2 Inhibitor, on Pancreatic beta‐Cell Mass and Glucose Homeostasis in Type 1 Diabetes. PLoS One 11:e0147391. [DOI] [PMC free article] [PubMed] [Google Scholar]
- 10. Day RJ, Mason MJ, Thomas C, Poon WW, Rohn TT (2015) Caspase‐cleaved tau co‐localizes with early tangle markers in the human vascular dementia brain. PLoS One 10:e0132637. [DOI] [PMC free article] [PubMed] [Google Scholar]
- 11. Dere E, Huston JP, De Souza Silva MA (2005) Episodic‐like memory in mice: simultaneous assessment of object, place and temporal order memory. Brain Res Brain Res Protoc 16:10–19. [DOI] [PubMed] [Google Scholar]
- 12. El‐Kaissi S, Sherbeeni S (2011) Pharmacological management of type 2 diabetes mellitus: an update. Curr Diabetes Rev 7:392–405. [DOI] [PubMed] [Google Scholar]
- 13. Fernandez‐Ponce MT, Casas L, Mantell C, Martinez de la Ossa EJ (2015) Use of high pressure techniques to produce Mangifera indica L. leaf extracts enriched in potent antioxidant phenolic compounds. Innov Food Sci Emerg Technol 29:94–106. [Google Scholar]
- 14. Fernandez‐Ponce MT, Casas L, Mantell C, Rodriguez M, Martinez de la Ossa EJ (2015) Extraction of antioxidant compounds from different varieties of Mangifera indicaleaves using green technologies. J Supercrit Fluids 72:168–175. [Google Scholar]
- 15. Fu YY, Zhang F, Zhang L, Liu HZ, Zhao ZM, Wen XR et al (2014) Mangiferin regulates interleukin‐6 and cystathionine‐b‐synthase in lipopolysaccharide‐induced brain injury. Cell Mol Neurobiol 34:651–657. [DOI] [PMC free article] [PubMed] [Google Scholar]
- 16. Garcia‐Alloza M, Dodwell SA, Meyer‐Luehmann M, Hyman BT, Bacskai BJ (2006) Plaque‐derived oxidative stress mediates distorted neurite trajectories in the Alzheimer mouse model. J Neuropathol Exp Neurol 65:1082–1089. [DOI] [PubMed] [Google Scholar]
- 17. Garcia‐Barroso C, Ricobaraza A, Pascual‐Lucas M, Unceta N, Rico AJ, Goicolea MA et al (2013) Tadalafil crosses the blood‐brain barrier and reverses cognitive dysfunction in a mouse model of AD. Neuropharmacology 64:114–123. [DOI] [PubMed] [Google Scholar]
- 18. Garrido G, Gonzalez D, Lemus Y, Garcia D, Lodeiro L, Quintero G et al (2004) In vivo and in vitro anti‐inflammatory activity of Mangifera indica L. extract (VIMANG). Pharmacol Res 50:143–149. [DOI] [PubMed] [Google Scholar]
- 19. Gottlieb M, Leal‐Campanario R, Campos‐Esparza MR, Sanchez‐Gomez MV, Alberdi E, Arranz A et al (2006) Neuroprotection by two polyphenols following excitotoxicity and experimental ischemia. Neurobiol Dis 23:374–386. [DOI] [PubMed] [Google Scholar]
- 20. Gotz J, Ittner LM, Lim YA (2009) Common features between diabetes mellitus and Alzheimer's disease. Cell Mol Life Sci 66:1321–1325. [DOI] [PMC free article] [PubMed] [Google Scholar]
- 21. Han J, Yi J, Liang F, Jiang B, Xiao Y, Gao S et al (2015) X‐3, a mangiferin derivative, stimulates AMP‐activated protein kinase and reduces hyperglycemia and obesity in db/db mice. Mol Cell Endocrinol 405:63–73. [DOI] [PubMed] [Google Scholar]
- 22. Harwood M, Danielewska‐Nikiel B, Borzelleca JF, Flamm GW, Williams GM, Lines TC (2007) A critical review of the data related to the safety of quercetin and lack of evidence of in vivo toxicity, including lack of genotoxic/carcinogenic properties. Food Chem Toxicol 45:2179–2205. [DOI] [PubMed] [Google Scholar]
- 23. Hochgrafe K, Sydow A, Mandelkow EM (2013) Regulatable transgenic mouse models of Alzheimer disease: onset, reversibility and spreading of Tau pathology. Febs J 280:4371–4381. [DOI] [PubMed] [Google Scholar]
- 24. Holscher C (2014) Central effects of GLP‐1: new opportunities for treatments of neurodegenerative diseases. J Endocrinol 221:T31–T41. [DOI] [PubMed] [Google Scholar]
- 25. Infante‐Garcia C, Ramos‐Rodriguez JJ, Galindo‐Gonzalez L, Garcia‐Alloza M (2016) Long‐term central pathology and cognitive impairment are exacerbated in a mixed model of Alzheimer's disease and type 2 diabetes. Psychoneuroendocrinology 65:15–25. [DOI] [PubMed] [Google Scholar]
- 26. Jimenez‐Palomares M, Ramos‐Rodriguez JJ, Lopez‐Acosta JF, Pacheco‐Herrero M, Lechuga‐Sancho AM, Perdomo G et al (2012) Increased Abeta production prompts the onset of glucose intolerance and insulin resistance. Am J Physiol Endocrinol Metab 11:1373–1380. [DOI] [PubMed] [Google Scholar]
- 27. Jung K, Lee B, Han SJ, Ryu JH, Kim DH (2009) Mangiferin ameliorates scopolamine‐induced learning deficits in mice. Biol Pharm Bull 32:242–246. [DOI] [PubMed] [Google Scholar]
- 28. Kasbe P, Jangra A, Lahkar M (2015) Mangiferin ameliorates aluminium chloride‐induced cognitive dysfunction via alleviation of hippocampal oxido‐nitrosative stress, proinflammatory cytokines and acetylcholinesterase level. J Trace Elem Med Biol 31:107–112. [DOI] [PubMed] [Google Scholar]
- 29. Kumar S, Khan SA, Bhakuni L, Singh P, Singh A, Sharma P, Kumar A (2013) Global burden of Alzheimeŕs disease and promissing potential of herbal medicines. Indian J Drugs 1:55–62. [Google Scholar]
- 30. Luitse MJ, Biessels GJ, Rutten GE, Kappelle LJ (2012) Diabetes, hyperglycaemia, and acute ischaemic stroke. Lancet Neurol 11:261–271. [DOI] [PubMed] [Google Scholar]
- 31. Manschot SM, Brands AM, van der Grond J, Kessels RP, Algra A, Kappelle LJ, Biessels GJ (2006) Brain magnetic resonance imaging correlates of impaired cognition in patients with type 2 diabetes. Diabetes 55:1106–1113. [DOI] [PubMed] [Google Scholar]
- 32. Marquez L, Garcia‐Bueno B, Madrigal JL, Leza JC (2012) Mangiferin decreases inflammation and oxidative damage in rat brain after stress. Eur J Nutr 51:729–739. [DOI] [PubMed] [Google Scholar]
- 33. Matkowski A, Kus P, Goralska E, Wozniak D (2013) Mangiferin ‐ a bioactive xanthonoid, not only from mango and not just antioxidant. Mini Rev Med Chem 13:439–455. [PubMed] [Google Scholar]
- 34. Miklossy J, Qing H, Radenovic A, Kis A, Vileno B, Làszló F, Miller L, Martins RN, Waeber G, Mooser V, Bosman F, Khalili K, Darbinian N, McGeer PL. (2010) Beta amyloid and hyperphosphorylated tau deposits in the pancreas in type 2 diabetes. Neurobiol Aging 31(9):1503–1515. [DOI] [PMC free article] [PubMed] [Google Scholar]
- 35. Ott A, Stolk RP, Hofman A, van Harskamp F, Grobbee DE, Breteler MM (1996) Association of diabetes mellitus and dementia: the Rotterdam Study. Diabetologia 39:1392–1397. [DOI] [PubMed] [Google Scholar]
- 36. PardoAndreu GL, Maurmann N, Reolon GK, de Farias CB, Schwartsmann G, Delgado R, Roesler R. (2010) Mangiferin, a naturally occurring glucoxilxanthone improves long‐term object recognition memory in rats. Eur J Pharmacol 10;635(1‐3):124–128. [DOI] [PubMed] [Google Scholar]
- 37. Patridge E, Gareiss P, Kinch MS, Hoyer D (2015) An analysis of FDA‐approved drugs: natural products and their derivatives. Drug Discov Today 21:204–207. [DOI] [PubMed] [Google Scholar]
- 38. Ramos‐Rodriguez JJ, Infante‐Garcia C, Galindo‐Gonzalez L, Garcia‐Molina Y, Lechuga‐Sancho A, Garcia‐Alloza M (2016) Increased spontaneous central bleeding and cognition impairment in app/ps1 mice with poorly controlled diabetes mellitus. Mol Neurobiol 53:2685–2697. [DOI] [PMC free article] [PubMed] [Google Scholar]
- 39. Ramos‐Rodriguez JJ, Jimenez‐Palomares M, Murillo‐Carretero MI, Infante‐Garcia C, Berrocoso E, Hernandez‐Pacho F et al (2015) Central vascular disease and exacerbated pathology in a mixed model of type 2 diabetes and Alzheimer's disease. Psychoneuroendocrinology 62:69–79. [DOI] [PubMed] [Google Scholar]
- 40. Ramos‐Rodriguez JJ, Ortiz O, Jimenez‐Palomares M, Kay KR, Berrocoso E, Murillo‐Carretero MI et al (2013) Differential central pathology and cognitive impairment in pre‐diabetic and diabetic mice. Psychoneuroendocrinology 38:2462–2475. [DOI] [PubMed] [Google Scholar]
- 41. Ramos‐Rodriguez JJ, Spires‐Jones T, Pooler AM, Lechuga‐Sancho AM, Bacskai BJ, Garcia‐Alloza M (2016) Progressive Neuronal Pathology and Synaptic Loss Induced by Prediabetes and Type 2 Diabetes in a Mouse Model of Alzheimer's Disease (in press). [DOI] [PubMed]
- 42. Raz L, Knoefel J, Bhaskar K (2016) The neuropathology and cerebrovascular mechanisms of dementia. J Cereb Blood Flow Metab 36:172–86. [DOI] [PMC free article] [PubMed] [Google Scholar]
- 43. Ricobaraza A, Cuadrado‐Tejedor M, Perez‐Mediavilla A, Frechilla D, Del Rio J, Garcia‐Osta A (2009) Phenylbutyrate ameliorates cognitive deficit and reduces tau pathology in an Alzheimer's disease mouse model. Neuropsychopharmacology 34:1721–1732. [DOI] [PubMed] [Google Scholar]
- 44. Rodeiro I, Hernandez S, Morffi J, Herrera JA, Gomez‐Lechon MJ, Delgado R, Espinosa‐Aguirre JJ (2012) Evaluation of genotoxicity and DNA protective effects of mangiferin, a glucosylxanthone isolated from Mangifera indica L. stem bark extract. Food Chem Toxicol 50:3360–3366. [DOI] [PubMed] [Google Scholar]
- 45. Sabbagh M, Cummings J (2011) Progressive cholinergic decline in Alzheimer's Disease: consideration for treatment with donepezil 23 mg in patients with moderate to severe symptomatology. BMC Neurol 11:21. [DOI] [PMC free article] [PubMed] [Google Scholar]
- 46. Sato N, Takeda S, Uchio‐Yamada K, Ueda H, Fujisawa T, Rakugi H, Morishita R (2011) Role of insulin signaling in the interaction between Alzheimer disease and diabetes mellitus: a missing link to therapeutic potential. Curr Aging Sci 4:118–127. [DOI] [PubMed] [Google Scholar]
- 47. Sena CM, Pereira AM, Seica R (2013) Endothelial dysfunction ‐ a major mediator of diabetic vascular disease. Biochim Biophys Acta 1832:2216–2231. [DOI] [PubMed] [Google Scholar]
- 48. Serrano‐Pozo A, Frosch MP, Masliah E, Hyman BT (2011) Neuropathological alterations in Alzheimer disease. Cold Spring Harb Perspect Med 1:a006189. [DOI] [PMC free article] [PubMed] [Google Scholar]
- 49. Srodulski S, Sharma S, Bachstetter AB, Brelsfoard JM, Pascual C, Xie XS et al (2014) Neuroinflammation and neurologic deficits in diabetes linked to brain accumulation of amylin. Mol Neurodegener 9:30. [DOI] [PMC free article] [PubMed] [Google Scholar]
- 50. Stirban A, Gawlowski T, Roden M (2014) Vascular effects of advanced glycation endproducts: Clinical effects and molecular mechanisms. Mol Metab 3:94–108. [DOI] [PMC free article] [PubMed] [Google Scholar]
- 51. Tai HC, Wang BY, Serrano‐Pozo A, Frosch MP, Spires‐Jones TL, Hyman BT (2014) Frequent and symmetric deposition of misfolded tau oligomers within presynaptic and postsynaptic terminals in Alzheimer's disease. Acta Neuropathol Commun 2:146. [DOI] [PMC free article] [PubMed] [Google Scholar]
- 52. Takeda S, Sato N, Uchio‐Yamada K, Sawada K, Kunieda T, Takeuchi D et al (2010) Diabetes‐accelerated memory dysfunction via cerebrovascular inflammation and Abeta deposition in an Alzheimer mouse model with diabetes. Proc Natl Acad Sci U S A 107:7036–7041. [DOI] [PMC free article] [PubMed] [Google Scholar]
- 53. Tang YH, Sun ZL, Fan MS, Li ZX, Huang CG (2012) Anti‐diabetic effects of TongGuanWan, a Chinese traditional herbal formula, in C57BL/KsJ‐db/db mice. Planta Med 78:18–23. [DOI] [PubMed] [Google Scholar]
- 54. Telang M, Dhulap S, Mandhare A, Hirwani R (2013) Therapeutic and cosmetic applications of mangiferin: a patent review. Expert Opin Ther Pat 23:1561–1580. [DOI] [PubMed] [Google Scholar]
- 55. Wang HL, Li CY, Zhang B, Liu YD, Lu BM, Shi Z et al (2014) Mangiferin facilitates islet regeneration and beta‐cell proliferation through upregulation of cell cycle and beta‐cell regeneration regulators. Int J Mol Sci 15:9016–9035. [DOI] [PMC free article] [PubMed] [Google Scholar]
- 56. Wang J, Varghese M, Ono K, Yamada M, Levine S, Tzavaras N et al (2014) Cocoa extracts reduce oligomerization of amyloid‐beta: implications for cognitive improvement in Alzheimer's disease. J Alzheimers Dis 41:643–650. [DOI] [PubMed] [Google Scholar]
- 57. Wild S, Roglic G, Green A, Sicree R, King H (2004) Global prevalence of diabetes: estimates for the year 2000 and projections for 2030. Diabetes Care 27:1047–1053. [DOI] [PubMed] [Google Scholar]