

Abstract
Pediatric high‐grade gliomas are considered to be different when compared to adult high‐grade gliomas in their pathogenesis and biological behavior. Recently, common genetic alterations, including mutations in the H3F3A / ATRX / DAXX pathway, have been described in approximately 30% of the pediatric cases. However, only few cases of infant high‐grade gliomas have been analyzed so far. We investigated the molecular features of 35 infants with diffuse high‐grade astrocytomas, including 8 anaplastic astrocytomas [World Health Organization (WHO) grade III] and 27 glioblastomas (WHO grade IV) by immunohistochemistry, multiplex ligation probe‐dependent amplification (MLPA), pyrosequencing of glioma‐associated genes and molecular inversion probe (MIP) assay. MIP and MLPA analyses showed that chromosomal alterations are significantly less frequent in infants compared with high‐grade gliomas in older children and adults. We only identified H3F3A K27M in 2 of 34 cases (5.9%), with both tumors located in the posterior fossa. PDGFRA amplifications were absent, and CDKN2A loss could be observed only in two cases. Conversely, 1q gain (22.7%) and 6q loss (18.2%) were identified in a subgroup of tumors. Loss of SNORD located on chromosome 14q32 was observed in 27.3% of the infant tumors, a focal copy number change not previously described in gliomas. Our findings indicate that infant high‐grade gliomas appear to represent a distinct genetic entity suggesting a different pathogenesis and biological behavior.
Keywords: ALT, ATRX, glioblastoma, H3F3A, high‐grade glioma, infants, molecular inversion probe analysis, multiplex ligation probe‐dependent amplification, pediatric brain tumors, SNORD
Introduction
Diffuse high‐grade astrocytomas, that is, anaplastic astrocytoma [AA; World Health Organization (WHO) grade III] and glioblastoma multiforme (GBM; WHO grade IV) represent approximately 8%–12% of all primary central nervous system (CNS) tumors in childhood 6. Although pediatric cases do not differ histopathologically from their adult counterparts, significant differences concerning their clinical features have been observed. Although curative therapy options are still absent and long‐term survivors are an exception in adults as well as in children 29, 34, infants (<3 years of age) with high‐grade gliomas (iHGGs) appear to have a better clinical outcome 2, 3, 17, 25, 28 and long‐term survival over 20 years after diagnosis was described 13, 32. In the past few years, integrated molecular genetic profiling of pediatric high‐grade gliomas (pHGGs) improved the understanding of obviously significant differences concerning the pathogenetic mechanisms of these tumors as well as their putative cell of origin. PDGFRA amplification and chromosome 1q gain have been described as the most common genetic alterations in childhood HGG, whereas adult high‐grade gliomas (aHGGs) showed significantly higher frequencies of EGFR amplification, chromosome 7q gain and chromosome 10q loss 27, 30. Furthermore, mutations in the H3F3A/ATRX/DAXX chromatin remodeling pathway have been reported as driver mutations in approximately 30% of pHGGs 12, 33. These findings may lead to the conclusion that aHGGs and pHGGs are molecularly different, and specific therapeutic strategies may have to be applied to pediatric patients. Given their low frequency, diffuse iHGGs have still not been studied in detail regarding their genomic alterations so far 2, 27, 30, 33. Recently, genomic fusions of the NTRK gene family were identified in few cases of iHGGs 39. Deciphering the crucial pathways involved in the biology of such tumors may lead to the identification of new therapeutic targets and options for iHGG patients whose main treatment strategy is characterized by employing chemotherapy or any other cytostatic treatment to postpone or even omit radiotherapy. In this study, we investigated a cohort of 35 diffuse iHGGs by genome‐wide analysis of copy number changes by molecular inversion probe (MIP) profiling and by focused mutation analysis of candidate genes, comparing our findings with a control group of 16 pHGGs.
Materials and Methods
Tumor tissues and immunohistochemistry (IHC)
Formalin‐fixed paraffin‐embedded (FFPE) tissue specimens from 35 infant primary diffuse high‐grade astrocytomas were analyzed. The series included 27 GBM (WHO grade IV) and 8 AA (WHO grade III), retrieved from the archive of the Institute of Neuropathology, University of Bonn Medical Center, the DGNN German Brain Tumor Reference Center, Bonn, Germany, and from the Department of Pathology, Catholic University, Rome, Italy. All tumors were classified according to the WHO classification of tumors of the CNS 22 using standard histological and immunohistochemical methods. No stereotactic biopsy material was included in this study. Immunohistochemical analysis (IHC) was performed on a Ventana Benchmark XT Immunostainer (Roche Ventana, Darmstadt, Germany) with antibodies against glial fibrillary acidic protein (GFAP; Dako, Glostrup, Denmark), microtubule‐associated protein 2 (Map2; Sigma, St. Louis, MO, USA), p53 protein (Dako), Olig‐2 (R&D Systems, Abingdon, UK), alpha thalassemia/mental retardation syndrome X‐linked protein (ATRX; Sigma) and Ki67 (MIB‐1; Dako). Cases with ≤15% of stained tumor cell nuclei were considered suggestive to harbor an ATRX mutation.
DNA extraction
DNA from 35 FFPE tumors was purified using the QIAamp DNA Mini Tissue Kit (Qiagen GmbH, Düsseldorf, Germany) according to manufacturer's instructions after proteinase K digestion. Hematoxylin–eosin (H&E) stained sections of each case were reviewed carefully by two independent neuropathologists before they were selected for DNA extraction. All samples selected contained at least 80% of vital tumor.
MIP assay
To identify copy number gains and losses, we used an MIP array including approximately 330 000 inversion probes (Affymetrix, Santa Clara, CA, USA). The MIP assay was performed as described previously 38. The raw MIP data file was analyzed using the Nexus Copy Number 7.0 Discovery Edition software (BioDiscovery, El Segundo, CA, USA). BioDiscovery's SNP‐FASST2‐Segmentation algorithm was used to make copy number and loss of heterozygosity (LOH) calls. GISTIC (Genomic Identification of Significant Targets in Cancer) analysis was used to distinguish significant chromosomal aberrations from random background 5.
Multiplex ligation‐dependent probe amplification (MLPA)
For MLPA analyses of BRAF V600E mutational status and homozygous deletion of CDKN2A, the SALSA MLPA (MRC Holland, Amsterdam, The Netherlands) P105 (glioma 2 probemix) and P175 (tumor gain probemix) assay were used in accordance with manufacturer's instruction 15. Briefly, 100 ng of tumor DNA was heat‐denatured for 5 minutes and cooled down to 25°C. Hybridization of the sample to probemix was performed for 16 h at 60°C. After ligation, polymerase chain reaction (PCR) was carried out in a total volume of 50 μL containing 10 μL of the ligation mix in a thermocycler (Biometra, Göttingen, Germany). A LIZ‐labeled internal size standard was added to the tumor samples. Fragments were separated and quantified on an ABI 3730 capillary sequencer after denaturation (Applied Bioscience, Darmstadt, Germany) and afterward analyzed with the GeneMapper software (Applied Bioscience). After normalization of the assay against normal cerebellar tissue (FFPE material), a difference of minus threefold standard deviation from the mean was considered as significant loss regarding CDKN2A. Homozygosity of CDKN2A deletion was verified with MIP analysis.
Pyrosequencing analysis for mutation hot spots of H3F3A, TERT and FGFR1
For pyrosequencing analysis, single‐stranded DNA templates were immobilized on streptavidin‐coated Sepharose high‐performance beads (GE Healthcare, Uppsala, Sweden) using the PSQ Vacuum Prep Tool and Vacuum Prep Worktable (Biotage, Uppsala, Sweden), according to manufacturer's instructions, then incubated at 80°C for 2 minutes and allowed to anneal to 0.4 mM sequencing primer at room temperature (RT). Pyrosequencing was performed using PyroGold Reagents (Biotage) on the Pyromark Q24 instrument (Biotage), according to manufacturer's instructions. Controls in which the sequencing primer or template were omitted were used to detect background signal. Pyrograms were analyzed using the PyroMark Q24 software (Biotage), using the allele quantification (AQ) software to determine the percentage of mutant vs. wild‐type alleles according to percentage relative peak height. A mutational screening of H3F3A (hot spot codons 27 and 34), TERT promoter (hot spots C228 and C250) and FGFR1 (hot spot codons 546 and 656) were carried out as previously reported 10, 11, 12.
Telomere‐specific fluorescence in situ hybridization (ALT‐FISH)
The presence of an alternative mechanism of telomere elongation (ALT) has been investigated on consecutive sections, analyzing telomere length performed with FISH with FITC‐PNA (peptide nucleic acid) probes (Dako, K532511) complementary to the telomeric repeated sequences. The PNA probe does not recognize subtelomeric sequences, allowing an exact measurement of the telomere length. Staining has been compared with endothelial cell nuclei as normal internal control. Five micrometer sections were cut from the FFPE tissues for FISH analysis. Slides were deparaffinized in an oven at 60°C for 60 minutes and incubated in xylene. Slides were then dehydrated in 100% ethanol for 5 minutes at RT and treated for 20 minutes at RT in 0.2 M HCl, then with pretreatment solution (1 M sodium thiocyanate) for 30 minutes at 80°C. Slides were then incubated with 1 mg/mL pepsin in 0.01 M HCl for 20 minutes at 37°C. The sample DNA was denatured at 80°C for 5 minutes together with fluorescein‐conjugated PNA probe. The hybridization (30 minutes, RT) was followed by a brief wash with a stringent solution at 65°C for 5 minutes. Coverslips were mounted with 2 × 10 μL antifade reagent containing DAPI as counterstain. FISH sections were examined with an AxioImager M1 microscope (Carl Zeiss, Jena, Germany), using a 100× oil immersion objective and analyzed by two investigators. Signals were counted for at least 100 tumor cells and evaluated with a telomere‐specific image analysis software (ISIS, MetaSystems, Milan, Italy).
Results
Clinical and histopathological features
Our cohort of 35 iHGGs comprised 8 AA (WHO grade III) and 27 GBM (WHO grade IV), affecting 15 male and 20 female patients with a median age at surgery of 9 months (range: 30th gestational week to 35 months, mean age 11.7 months; Figure 1). Eight cases represented congenital high‐grade gliomas (cHGGs). Five cases were midline tumors. A randomly chosen cohort of 16 non‐infant pHGG cases (6 male; 10 female; age range 4–15 years; median 11 years; mean 10.6 years) was also included in the study. Infants younger than 9 months had exclusively supratentorial tumors, whereas infants older than 9 months showed different tumor localizations including supratentorial, infratentorial and spinal sites (Figure 1).
Figure 1.
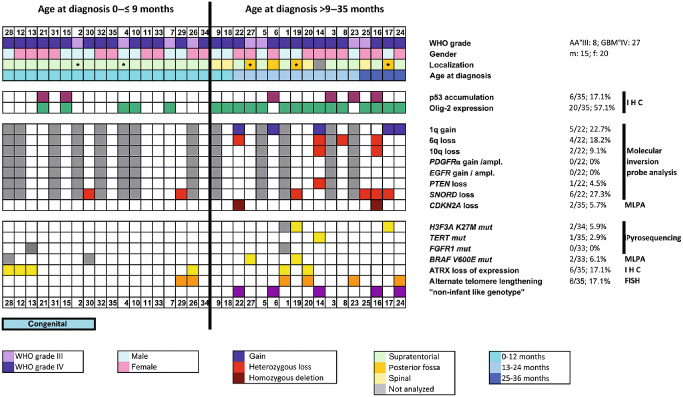
Clinical data and molecular features of 35 infant high‐grade gliomas (iHGGs). The figure summarizes the clinical, histopathological and molecular features of the cases of iHGGs included in our study. Copy number alteration was analyzed by molecular inversion probe (MIP) analysis; genomic alteration and mutational status of candidate genes were analyzed by multiplex ligation‐dependent probe amplification (MLPA) and pyrosequencing; nuclear expression of p53 and Olig‐2 was studied by immunohistochemistry (IHC); alternative telomere lengthening (ALT) was investigated by fluorescence in situ hybridization (FISH). The patients are sorted by age (from the youngest patient, #28 on the left, to the oldest patient, #24 on the right). Median age at diagnosis was 9 months. Midline tumors are indicated by an asterisk (*). AA°III = anaplastic astrocytoma WHO grade III; ampl. = amplification; GBM°IV = glioblastoma multiforme WHO grade IV; WHO = World Health Organization.
Typical histopathological features of AA or GBM became visible by H&E staining: the tumors showed high cellularity and increased mitotic activity, with microvascular proliferation and/or areas of necrosis in GBM cases (Figure 2). All tumors were positively stained with one or more glial markers such as GFAP, Map2 and Olig‐2. Proliferation activity evaluated with Ki67 antibody varied between 5% and 30% of the positively labeled tumor cell nuclei. Expression of Olig‐2 could be detected in 57.1% of all cases (Figure 1), and appeared to be more consistently expressed in patients older than 9 months (15/17; 88.2%). In infants younger than 9 months, nuclear expression of Olig‐2 was found in 5 of 18 cases (27.8%).
Figure 2.
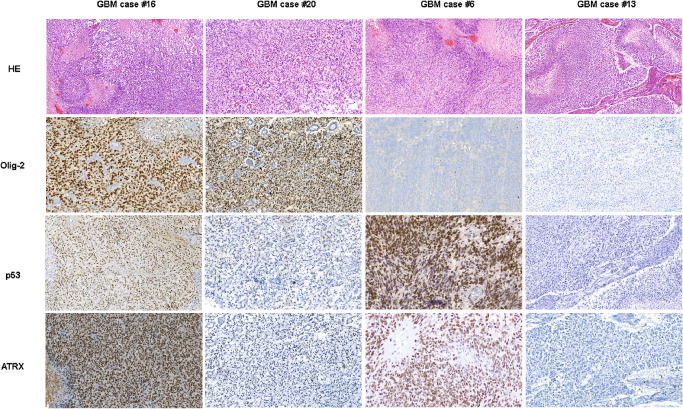
Histopathological and immunohistochemical features (p53, Olig‐2 and ATRX) of four representative cases of infant glioblastoma patients. Glioblastomas [glioblastoma multiforme (GBM)] show microvascular proliferation and tumor necrosis with pseudopalisading of the vital tumor cells.
Genomic alterations in iHGGs
MLPA and MIP analyses showed that infant HGG had a stable genome with very few copy number changes, restricted to few recurrent alterations (Figure 1). Notably, the frequency of genetic alterations was higher in children older than 9 months, suggesting an increase of genetic instability in correlation to the age at diagnosis. Figure 3 shows the virtual karyogram of 22 iHGGs analyzed by MIP arrays. Gains of chromosome 1q (22.7%) and loss of chromosome 6q (18.2%) as well as chromosome 10q (9.1%) were observed in some cases (Figure 1), whereas other genomic alterations including large losses of chromosome 13q and chromosome 14q were absent. No iHGG cases showed EGFR or PDGFRA amplifications. We found only two tumors with CDKN2A loss and one case with loss of PTEN. Both GBM harboring a homozygous deletion of CDKN2A were located supratentorially and affected the 12‐ and 33‐month‐old children, respectively.
Figure 3.
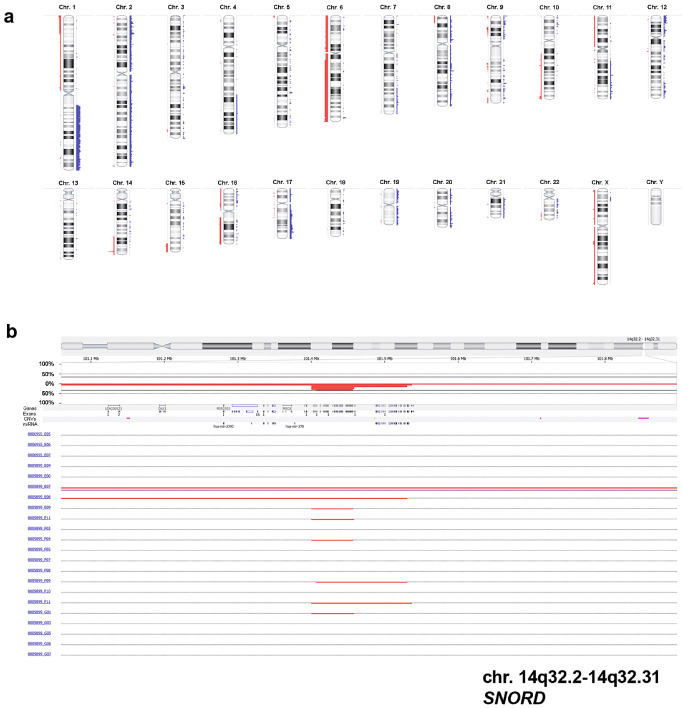
Virtual karyogram and loss of SNORD in 22 tumors analyzed by molecular inversion probe (MIP) arrays. Gains of chromosome 1q or losses of chromosome 6q become obvious (A). Losses are indicated in red and gains in blue. As a focal genetic alteration, a heterozygous loss of SNORD on chromosome region 14q32, a known tumor‐suppressor region, could be detected in six cases (B).
In addition to these copy number alterations, a few focal genetic changes could be detected by MIP profiling and GISTIC (Supporting Information Table S1). Six cases (27.3%) showed heterozygous loss of SNORD113 and SNORD114 genes encoding for small nucleolar RNA (snoRNA) in the chromosomal region 14q32 (Figure 3B).
H3F3A, TERT and FGFR1 mutational status, ATRX and p53 expression and ALT‐FISH
Using pyrosequencing‐based analyses, point mutations of H3F3A, TERT and FGFR1 were detected in only a few tumors. While all cases showed FGFR1 wild‐type sequences, we identified one sample with TERT C250T mutation (1/35; 2.9%) and two cases with H3F3A K27M mutation (2/34; 5.9%). Moreover, BRAF V600E mutations were detected in two cases using MLPA (2/33; 6.1%), affecting 15‐ and 17‐month‐old children, respectively (Figure 1). Interestingly, the four tumors showing H3F3A K27M and/or BRAF V600E mutations were localized in the posterior fossa (Figure 1).
Nuclear accumulation of p53 (Figure 1) and expression of ATRX were investigated immunohistochemically. Six cases (6/35, 17.1%) showed a nuclear accumulation of p53, suggesting the presence of an underlying TP53 mutation. Loss of nuclear expression of ATRX was found in six cases (6/35; 17.1%) (Figures 1 and 2). This finding was not associated with patients' age. Fourteen cases (40%) showed either ATRX loss or H3F3A mutation or nuclear accumulation of p53 protein. Notably, ATRX loss, H3F3A K27M mutation and nuclear accumulation of p53 were mutually exclusive. Out of 35 cases, 6 (17.1%) showed significantly increased fluorescence signals indicative of ALT (Supporting Information Figure S1).
Comparison of molecular features between iHGGs and pHGGs
The low frequency of genomic alterations in iHGGs became even more evident by comparison to pHGG cases. While the virtual karyograms of infant cases showed a stable genome with few changes in most tumors (Figures 3A and 4), the non‐infant cohort displayed frequent chromosomal changes (Figure 4). A statistic analysis using a Mann–Whitney rank sum test showed that iHGGs demonstrated significant lower number of gains or losses of whole chromosomes compared with pHGGs (P‐value 0.017; Figure 5A). The difference was also significant when the number of chromosomal arms with gains or losses spanning the entire chromosome arm (P‐value < 0.001) and the number of chromosomal arms with focal copy number aberrations (P‐value 0.001) were analyzed (Figure 5B,C). Notably, by looking at individual karyograms in detail, it was evident that five infant cases (#6, #14, #16, #22 and #24) showed genomic alterations, which are more common in non‐infant HGG. Interestingly, all of these cases were found in children older than 9 months; four of them displayed also chromosome 1q gain. Vice versa, two of pHGGs (2/16, 12.5%) exhibited a typical “infant‐like” aberration pattern and these patients were 12 and 13 years old, respectively.
Figure 4.
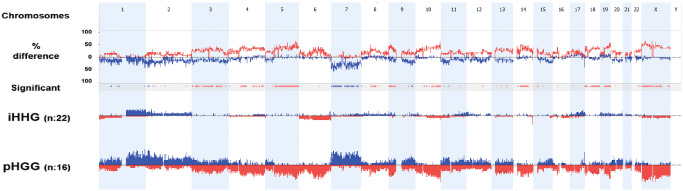
Cumulative chromosomal aberrations of 22 infant cases in comparison to 16 non‐infant pediatric high‐grade gliomas. Molecular inversion probe (MIP) analysis shows that chromosomal alterations are significantly less frequent in diffuse infant high‐grade gliomas (iHGGs) compared to pediatric high‐grade gliomas (pHGGs). The comparison plot is obtained by subtracting the genomic alterations of groups. The difference is expressed in percentage for the gains and losses for each location (gain and loss are shown as up and down, respectively) and tracked in the upper part of the figure. Bars in the track “Significant” indicate regions where there is a significant difference of the copy number changes between the compared groups (P < 0.05). The profile of copy number changes (losses in red, gains in blue) for each group is displayed in the lower track of the plot.
Figure 5.
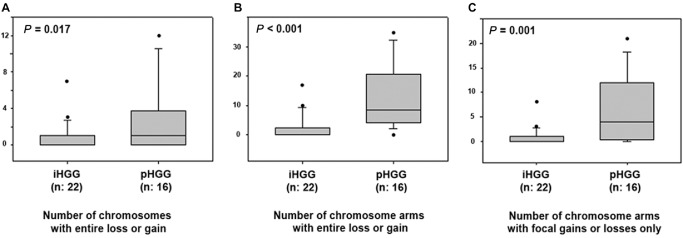
Box plot diagrams of the comparison of infants vs. non‐infant high‐grade gliomas (HGGs) using a Mann–Whitney rank sum test. The graphs show the number of chromosomes with cytogenetic alterations (gain/losses) affecting the whole chromosomes (A), the number of chromosome arms with cytogenetic alterations (gains/losses) affecting the entire chromosome arm (B) and number of chromosome arms with focal copy number aberrations (C) in infant high‐grade gliomas (iHGGs) compared to pediatric high‐grade gliomas (pHGGs). The iHGGs presented a significantly lower frequency of chromosomal alterations when compared to their non‐infant counterparts. The horizontal line represents the median value; the lower and upper limits of the box represent the interquartile range. Focal copy number aberrations are defined as gains or losses spanning from 10% to 50% of a chromosome arm.
Discussion
In the last few years, several reports highlighted the significant differences between pHGGs and aHGGs, but only a limited number of iHGGs were included and investigated in larger case series of pHGGs 27, 30. In particular, no dedicated studies have been performed specifically in order to decipher the molecular features of iHGGs, although these tumors represent a challenge in terms of therapeutic management.
The results of our study showed that iHGGs may represent a distinct molecular entity among pHGGs defined by its stable genome. In particular, they are characterized by a low rate of copy number variations (CNVs) and by low incidence of mutations such as H3F3A or focal genomic alterations such as PDGFRA amplification. Basically, iHGGs do not appear to share any of the molecular features that are considered to date as highly characteristic of pHGGs.
cHGG cases in our study seem not to present significant differences in terms of cytogenetics or mutational status when compared to iHGGs of older infants. In a gene expression profile study, Macy et al reported similarities of cGBM to both pediatric and adult GBM 23. In particular, although chromosome 10q loss was found in two of six cHGGs investigated by Brat et al 7, we did not observe any chromosome 10q loss in the eight cHGGs included in our series.
In accordance with previous studies 4, 27, we found that the frequency of cytogenetic alterations in terms of the number of gains or losses of whole chromosomes, the number of gains or losses of whole chromosome arms and the number of chromosomal arms with focal alterations (Figure 4) was significantly lower in iHGGs when compared to pHGGs. Notably, iHGGs showed a very low incidence of chromosomal loss of 10q, 13q and 14q, gains of chromosome 1q or chromosome 7 which are among the most common cytogenetic alterations in pHGGs 27. Conversely, the frequency of other alterations such as gain of chromosome 1q and loss of 6q and 10q appeared to increase with age, thus, becoming obviously more frequent in older infants. This observation is also supported by the data reported by Paugh et al 27: in 11 infants investigated, they found no 1q gain and only one case showed a loss of chromosome 10q 27. Moreover, high copy gain of PDGFRA or homozygous deletion of CDKN2A seems to be rare in iHGGs. In accordance with previously published data 27, we found only two tumors with CDKN2A loss but no PDGFRA or EGFR amplification. In 2010, Verhaak et al proposed a biological classification of GBM subtypes characterized by abnormalities in PDGFRA, IDH1, EGFR and NF1 based on integrated genomic analyses of adult GBM 37. Our findings indicate that iHGGs do not fit into these suggested subtypes. Even more focused subtyping based on IDH mutational status and epigenetic profiles are also not helpful to appraise iHGGs 31, 35.
iHGG cases of our cohort did not present a significant incidence of H3F3A mutations, which are considered a driving oncogenetic event in a significant subgroup of pHGGs 33, 35. Whereas H3F3A K27M mutation occurs in 22%–30% of pHGGs 12, 33, we only found two mutated cases (6%) in our series of iHGGs. Notably, ATRX protein expression was absent in 17.1% (6/35) of our cases, which is similar to the usual incidence found in pHGG series 33. The discrepancy in the H3F3A K27M mutation rate between iHGGs and pHGGs could potentially be explained by the different statistical distribution of the tumor localizations in these subgroups (midline vs. hemispheric). Both lesions showing the H3F3A K27M mutation in our series were midline tumors localized infratentorially, that is, in the posterior fossa. However, as ATRX loss of expression or H3F3A mutation or p53 accumulation occurred in about 40% of the cases, it can be hypothesized that the derangement of the H3F3A/ATRX/DAXX pathway may play some role in a subgroup of iHGGs. Unfortunately, a direct comparison with previous studies is not possible due to the absence of iHGG cases in the more recently published pHGG series with H3F3A/ATRX/DAXX pathway analysis 33, and vice versa, such alterations had not been investigated in detail in previous cytogenetic and molecular studies including iHGGs 4, 7, 23, 27, 30.
Telomere‐specific FISH analysis was performed to gain a more detailed insight in the correlation of ATRX loss of expression and alternative telomere lengthening (ALT) which had been previously described in a limited number of pHGGs. While Schwartzentruber et al found ALT to be strongly associated with loss of ATRX expression (approximately 79%) in pediatric GBM 1, 14, 33, Liu et al could not detect a significant association between both features 21. In our own cohort, we identified six cases with ATRX loss and six cases with ALT but only three cases harboring both alterations. Given the limited number of altered cases in our cohort, we cannot draw any firm conclusion concerning a correlation of ALT and ATRX loss of expression. Moreover, other mechanisms alternative to ATRX mutation may be responsible for ALT in iHGGs as it was previously suggested for pHGGs 33.
BRAF V600E and TERT promoter mutations appear to be rare in iHGGs 19. We identified only one single case harboring a TERT C250T mutation. As expected, FGFR1 mutations described in pediatric pilocytic astrocytomas and rare aGBM 16 were absent in our own iHGG series, suggesting a limited incidence of such alterations in iHGGs.
From a diagnostic point of view, the relatively low frequency of mutations and genomic alterations commonly observed in pHGGs (eg, H3F3A mutations and PDGFRA amplification) limits the potential utility of such markers for the differential diagnosis of gliomas affecting infants. Accordingly, a cytogenetic analysis showing a relative lack of genomic alterations and stable cytogenetic profile in a glial tumor arising in this age group does not exclude the presence of a malignant tumor. Because this specific “iHGG genotype” could be also, even rarely, observed in older children (>3 years of age), particular attention must be taken in the interpretation of cytogenetic data of gliomas affecting older children.
Notably, GISTIC analysis yielded only a limited number of significant focal copy number changes (see Supporting Information Table S1). In six cases (27.3%), a loss of SNORD genes encoding for C/D box snoRNAs on chromosome 2 and chromosome 14 could be detected. These snoRNAs are considered to play a crucial role in post‐transcriptional modifications of ribosomal and also spliceosomal RNAs in identifying the correct sites for 2′‐O‐ribose methylation of target RNA. While snoRNAs were thought to act mainly in cellular housekeeping for a long time, in the past few years, evidence has augmented that snoRNAs and their dysfunction are involved in oncogenesis, for example, in diffuse large B‐cell lymphoma 36, breast and prostate cancer 8, 9, 26, and non‐small‐cell lung cancer 20. Moreover, snoRNAs seem to have oncogenic as well as tumor‐suppressor functions in tumorigenesis 24. Interestingly, the genes SNORD113 and SNORD114 are located on chromosome 14 in the 14q32 region mapped as tumor‐suppressor locus in esophageal cancer 18. Loss of SNORD therefore may represent a driving oncogenic event in the development of diffuse iHGGs not previously described in glioma. However, such a role has to be validated in functional studies.
In conclusion, our findings indicate that iHGGs constitute a distinct genetic entity suggesting a different pathogenesis and biological behavior. Loss of SNORD may represent an important step in the molecular pathogenesis as a potential deregulation of tumor‐suppressive functions and subsequent tumor development. As an alteration specific for iHGGs, it may represent a marker supporting the diagnosis of this tumor entity as well as novel target of therapy for these patients.
Conflict of interest
The authors declare no conflict of interest.
Supporting information
Figure S1. FISH analysis of ALT in infant HGG. Representative images of telomere‐specific fluorescence in situ hybridization (FISH) show alternative lengthening of the telomeres (ALT) in tumour cells (A) vs. tumour cells without telomere lengthening (B).
Table S1. GISTIC analysis of infants HGG.
References
- 1. Abedalthagafi M, Phillips JJ, Kim GE, Mueller S, Haas‐Kogen DA, Marshall RE et al (2013) The alternative lengthening of telomere phenotype is significantly associated with loss of ATRX expression in high‐grade pediatric and adult astrocytomas: a multi‐institutional study of 214 astrocytomas. Mod Pathol 26:1425–1432. [DOI] [PMC free article] [PubMed] [Google Scholar]
- 2. Antonelli M, Buttarelli FR, Arcella A, Nobusawa S, Donofrio V, Oghaki H, Giangaspero F (2010) Prognostic significance of histological grading, p53 status, YKL‐40 expression, and IDH1 mutations in pediatric high‐grade gliomas. J Neurooncol 5:209–215. [DOI] [PubMed] [Google Scholar]
- 3. Batra V, Sands SA, Holmes E, Russell Geyer J, Yates A, Becker L et al (2014) Long‐term survival of children less than six years of age enrolled on the CCG‐945 phase III trial for newly‐diagnosed high‐grade glioma: a report from the Children's Oncology Group. Pediatr Blood Cancer 61:151–157. [DOI] [PMC free article] [PubMed] [Google Scholar]
- 4. Bax DA, Mackay A, Little SE, Carvalho D, Viana‐Pereira M, Tamber N et al (2010) A distinct spectrum of copy number aberrations in pediatric high‐grade gliomas. Clin Cancer Res 16:3368–3377. [DOI] [PMC free article] [PubMed] [Google Scholar]
- 5. Beroukhim R, Getz G, Nghiemphu L, Barretina J, Hsueh T, Linhart D et al (2007) Assessing the significance of chromosomal aberrations in cancer: methodology and application to glioma. Proc Natl Acad Sci U S A 104:20007–20012. [DOI] [PMC free article] [PubMed] [Google Scholar]
- 6. Bondy ML, Scheurer ME, Malmer B, Barnholtz‐Sloan JS, Davis FG, Il'yasova D et al (2008) Brain tumor epidemiology: consensus from the Brain Tumor Epidemiology Consortium. Cancer 113:1953–1968. [DOI] [PMC free article] [PubMed] [Google Scholar]
- 7. Brat DJ, Shehata BM, Castellano‐Sanchez A, Hawkins C, Yost RB, Greco C et al (2007) Congenital glioblastoma: a clinicopathologic and genetic analysis. Brain Pathol 17:276–281. [DOI] [PMC free article] [PubMed] [Google Scholar]
- 8. Dong XY, Guo P, Boyd J, Sun X, Li Q, Zhou W, Dong JT (2009) Implication of snoRNA U50 in human breast cancer. J Genet Genomics 36:447–454. [DOI] [PMC free article] [PubMed] [Google Scholar]
- 9. Dong XY, Rodriguez C, Guo P, Sun X, Talbot JT, Zhou W et al (2008) SnoRNA U50 is a candidate tumor‐suppressor gene at 6q14.3 with a mutation associated with clinically significant prostate cancer. Hum Mol Genet 17:1031–1042. [DOI] [PMC free article] [PubMed] [Google Scholar]
- 10. Gessi M, Abdel Moneim Y, Hammes J, Waha A, Pietsch T (2014) FGFR1 N546K mutation in a case of papillary glioneuronal tumor (PGNT). Acta Neuropathol 127:935–936. [DOI] [PubMed] [Google Scholar]
- 11. Gessi M, van de Nes J, Griewank K, Barresi V, Buckland ME, Kirfel J et al (2014) Absence of TERT promoter mutations in primary melanocytic tumors of the central nervous system. Neuropathol Appl Neurobiol 40:794–797. [DOI] [PubMed] [Google Scholar]
- 12. Gielen GH, Gessi M, Hammes J, Kramm CM, Waha A, Pietsch T (2013) H3F3A K27M mutation in pediatric CNS tumors: a marker for diffuse high‐grade astrocytomas. Am J Clin Pathol 139:345–349. [DOI] [PubMed] [Google Scholar]
- 13. Grundy RG, Wilne SH, Robinson KJ, Ironside JW, Cox T, Chong WK et al (2010) Primary postoperative chemotherapy without radiotherapy for treatment of brain tumours other than ependymoma in children under 3 years: results of the first UKCCSG/SIOP CNS 9204 trial. Eur J Cancer 46:120–133. [DOI] [PubMed] [Google Scholar]
- 14. Heaphy CM, de Wilde RF, Jiao Y, Klein AP, Edil BH, Shi C et al (2011) Altered telomeres in tumors with ATRX and DAXX mutations. Science 333:425. [DOI] [PMC free article] [PubMed] [Google Scholar]
- 15. Homig‐Holzel C, Savola S (2012) Multiplex ligation‐dependent probe amplification (MLPA) in tumor diagnostics and prognostics. Diagn Mol Pathol 21:189–206. [DOI] [PubMed] [Google Scholar]
- 16. Jones DT, Hutter B, Jager N, Korshunov A, Kool M, Warnatz HJ et al (2013) Recurrent somatic alterations of FGFR1 and NTRK2 in pilocytic astrocytoma. Nat Genet 45:927–932. [DOI] [PMC free article] [PubMed] [Google Scholar]
- 17. Karremann M, Rausche U, Roth D, Kühn A, Pietsch T, Gielen GH et al (2013) Cerebellar location may predict an unfavourable prognosis in paediatric high‐grade glioma. Br J Cancer 109:844–851. [DOI] [PMC free article] [PubMed] [Google Scholar]
- 18. Ko JM, Yau WL, Chan PL, Lung HL, Yang L, Lo PH et al (2005) Functional evidence of decreased tumorigenicity associated with monochromosome transfer of chromosome 14 in esophageal cancer and the mapping of tumor‐suppressive regions to 14q32. Genes Chromosomes Cancer 43:284–293. [DOI] [PubMed] [Google Scholar]
- 19. Koelsche C, Sahm F, Capper D, Reuss D, Sturm D, Jones DT et al (2013) Distribution of TERT promoter mutations in pediatric and adult tumors of the nervous system. Acta Neuropathol 126:907–915. [DOI] [PubMed] [Google Scholar]
- 20. Liao J, Yu L, Mei Y, Guarnera M, Shen J, Li R et al (2010) Small nucleolar RNA signatures as biomarkers for non‐small‐cell lung cancer. Mol Cancer 9:198. [DOI] [PMC free article] [PubMed] [Google Scholar]
- 21. Liu XY, Gerges N, Korshunov A, Sabha N, Khuong‐Quang DA, Fontebasso AM et al (2012) Frequent ATRX mutations and loss of expression in adult diffuse astrocytic tumors carrying IDH1/IDH2 and TP53 mutations. Acta Neuropathol 124:615–625. [DOI] [PubMed] [Google Scholar]
- 22. Louis DN, Ohgaki H, Wiestler OD, Cavenee WK (2007) WHO Classification of Tumours of the Central Nervous System, 4th edn. IARC Press: Lyon. [DOI] [PMC free article] [PubMed] [Google Scholar]
- 23. Macy ME, Birks DK, Barton VN, Chan MH, Donson AM, Kleinschmidt‐Demasters BK et al (2012) Clinical and molecular characteristics of congenital glioblastoma. Neuro‐Oncol 14:931–941. [DOI] [PMC free article] [PubMed] [Google Scholar]
- 24. Mannoor K, Liao J, Jiang F (2012) Small nucleolar RNAs in cancer. Biochim Biophys Acta 1826:121–128. [DOI] [PMC free article] [PubMed] [Google Scholar]
- 25. Merchant TE, Pollack IF, Loeffler JS (2010) Brain tumors across the age spectrum: biology, therapy, and late effects. Semin Radiat Oncol 20:58–66. [DOI] [PMC free article] [PubMed] [Google Scholar]
- 26. Mourtada‐Maarabouni M, Pickard MR, Hedge VL, Farzaneh F, Williams GT (2009) GAS5, a non‐protein‐coding RNA, controls apoptosis and is downregulated in breast cancer. Oncogene 28:195–208. [DOI] [PubMed] [Google Scholar]
- 27. Paugh BS, Qu C, Jones C, Liu Z, Adamowicz‐Brice M, Zhang J et al (2010) Integrated molecular genetic profiling of pediatric high‐grade gliomas reveals key differences with the adult disease. J Clin Oncol 28:3061–3068. [DOI] [PMC free article] [PubMed] [Google Scholar]
- 28. Pollack IF, Hamilton RL, Finkelstein SD, Campbell JW, Martinez AJ, Sherwin RN et al (1997) The relationship between TP53 mutations and overexpression of p53 and prognosis in malignant gliomas of childhood. Cancer Res 57:304–309. [PubMed] [Google Scholar]
- 29. Reifenberger G, Weber RG, Riehmer V, Kaulich K, Willscher E, Wirth H et al (2014) Molecular characterization of long‐term survivors of glioblastoma using genome‐ and transcriptome‐wide profiling. Int J Cancer 135:1822–1831. [DOI] [PubMed] [Google Scholar]
- 30. Rickert CH, Sträter R, Kaatsch P, Wassmann H, Jürgens H, Dockhorn‐Dworniczak B, Paulus W (2001) Pediatric high‐grade astrocytomas show chromosomal imbalances distinct from adult cases. Am J Pathol 158:1525–1532. [DOI] [PMC free article] [PubMed] [Google Scholar]
- 31. Riehmer V, Gietzelt J, Beyer U, Hentschel B, Westphal M, Schackert G et al (2014) Genomic profiling reveals distinctive molecular relapse patterns in IDH1/2 wild‐type glioblastoma. Genes Chromosomes Cancer 53:589–605. [DOI] [PubMed] [Google Scholar]
- 32. Sanders RP, Kocak M, Burger PC, Merchant TE, Gajjar A, Broniscer A (2007) High‐grade astrocytoma in very young children. Pediatr Blood Cancer 49:888–893. [DOI] [PubMed] [Google Scholar]
- 33. Schwartzentruber J, Korshunov A, Liu X‐Y, Jones DT, Pfaff E, Jacob K et al (2012) Driver mutations in histone H3.3 and chromatin remodelling genes in paediatric glioblastoma. Nature 482:226–231. [DOI] [PubMed] [Google Scholar]
- 34. Song KS, Phi JH, Cho B‐K, Wang KC, Lee JY, Kim DG et al (2010) Long‐term outcomes in children with glioblastoma. J Neurosurg Pediatr 6:145–149. [DOI] [PubMed] [Google Scholar]
- 35. Sturm D, Witt H, Hovestadt V, Khuong‐Quang DA, Jones DT, Konermann C et al (2012) Hotspot mutations in H3F3A and IDH1 define distinct epigenetic and biological subgroups of glioblastoma. Cancer Cell 22:425–437. [DOI] [PubMed] [Google Scholar]
- 36. Tanaka R, Satoh H, Moriyama M, Satoh K, Morishita Y, Yoshida S et al (2000) Intronic U50 small‐nucleolar‐RNA (snoRNA) host gene of no protein‐coding potential is mapped at the chromosome breakpoint t(3;6)(q27;q15) of human B‐cell lymphoma. Genes Cells 5:277–287. [DOI] [PubMed] [Google Scholar]
- 37. Verhaak RG, Hoadley KA, Purdom E, Wang V, Qi Y, Wilkerson MD et al (2010) Integrated genomic analysis identifies clinically relevant subtypes of glioblastoma characterized by abnormalities in PDGFRA, IDH1, EGFR, and NF1. Cancer Cell 17:98–9110. [DOI] [PMC free article] [PubMed] [Google Scholar]
- 38. Wang Y, Cottman M, Schiffman JD (2012) Molecular inversion probes: a novel microarray technology and its application in cancer research. Cancer Genet 205:341–355. [DOI] [PubMed] [Google Scholar]
- 39. Wu G, Diaz AK, Paugh BS, Rankin SL, Ju B, Li Y et al (2014) The genomic landscape of diffuse intrinsic pontine glioma and pediatric non‐brainstem high‐grade glioma. Nat Genet 46:444–450. [DOI] [PMC free article] [PubMed] [Google Scholar]
Associated Data
This section collects any data citations, data availability statements, or supplementary materials included in this article.
Supplementary Materials
Figure S1. FISH analysis of ALT in infant HGG. Representative images of telomere‐specific fluorescence in situ hybridization (FISH) show alternative lengthening of the telomeres (ALT) in tumour cells (A) vs. tumour cells without telomere lengthening (B).
Table S1. GISTIC analysis of infants HGG.