

Abstract
Medulloblastoma (MB) is composed of four molecular subgroups viz. WNT, SHH, groups 3 and 4, identified using various high‐throughput methods. Translation of this molecular data into pathologist‐friendly techniques that would be applicable in laboratories all over the world is a major challenge. Ninety‐two MBs were analyzed using a panel of 10 IHC markers, real‐time PCR for mRNA and miRNA expression, and FISH for MYC amplification. β‐catenin, GAB1 and YAP1 were the only IHC markers of utility in classification of MBs into three subgroups viz. WNT (9.8%), SHH (45.6%) and non‐WNT/SHH (44.6%). mRNA expression could further classify some non‐WNT/SHH tumors into groups 3 and 4. This, however, was dependent on integrity of RNA extracted from FFPE tissue. MYC amplification was seen in 20% of non‐WNT/SHH cases and was associated with the worst prognosis. For routine diagnostic practice, we recommend classification of MBs into three subgroups: WNT, SHH and non‐WNT/SHH, with supplementation by prognostic markers like MYC for non‐WNT/SHH tumors. Using this panel, we propose a new three‐tier risk stratification system for MBs. Molecular subgrouping with this limited panel is rapid, economical, works well on FFPE tissue and is reliable as it correlates significantly with clinicopathological parameters and patient survival.
Keywords: FISH, immunohistochemistry, medulloblastoma, molecular, subgroups
Introduction
Medulloblastoma (MB) is the commonest malignant brain tumor in children, accounting for approximately 20% of all pediatric CNS tumors 10. Although therapeutic advances have led to improved survival rates for MB patients 6, 9, 24, 25, survivors often suffer from long‐term side effects of therapy 1, 10, 14, 21. With the advent of high‐throughput techniques, there has been a virtual explosion of molecular data in recent years, which has established that MB is a heterogenous disease composed of four distinct subgroups, viz. WNT (Wingless), SHH (Sonic Hedgehog), group 3 and group 4, which differ in their patient demographics, tumor histology, genetic alterations, transcriptional profiles and, most importantly, in their clinical outcomes 18, 23, 29. The current consensus, therefore, is that this subgrouping should be applied routinely to MB cases, as it appears to be the best available predictor of patient outcome at this time. As alluded to in the ISN‐Haarlem consensus guidelines, it is extremely likely that this subgrouping will make its way into the upcoming edition of the WHO classification for tumors of the CNS 12, 17, thus necessitating the translation of the vast amount of research data into laboratory techniques that are easily applicable in routine clinical practice the world over, including in developing countries.
The International Medulloblastoma Working Group, in 2014, suggested an algorithm for molecular classification of MBs into four subgroups, which is based primarily on sequencing, gene expression profiling and methylation profiling 12. However, these techniques are laborious, expensive and do not always give reliable and reproducible results on formalin‐fixed paraffin‐embedded (FFPE) tissue, making them difficult to incorporate into routine pathological evaluation of MBs, especially in developing countries. Based on this premise, a few recent studies have attempted to classify MBs into three molecular subgroups using pathologist‐friendly techniques like immunohistochemistry (IHC) and fluorescence in situ hybridization (FISH), which provide rapid and reproducible results on FFPE tissue 7. These methods are economical, robust and are available in most diagnostic pathology laboratories all over the world. Others have tried to develop techniques that are rapid and applicable to FFPE tissue, such as the Nanostring‐based assay developed by Northcott et al, and the limited panel miRNA‐based real‐time PCR assay reported by Kunder et al, but these are again expensive as well as time consuming, and it is therefore not feasible to make these methods routine practice for classification of MBs 15, 20. With this background, we attempted to define the best protocol for subgrouping of MBs, which would be rapid, economical, feasible on FFPE tissue and also robust, giving results similar to those of high‐throughput techniques, and would therefore be applicable to most laboratories all over the world. For this, expression of IHC markers proposed by Taylor et al and Ellison et al, and of some subgroup‐specific mRNAs and miRNAs selected from those analyzed by Kunder et al was studied 6, 15, 29.
A number of molecular alterations have been documented as subgroup‐specific prognostic markers. Of these, MYC amplification is a universally accepted marker of poor outcome, and is particularly enriched in group 3 MBs 8, 22, 29. Similarly, isochromosome 17q is a marker of poor prognosis, but only in group 3 and not in group 4 MBs 28. TP53 mutations, on the other hand, are enriched in WNT and SHH tumors, but their prognostic value is restricted to SHH MBs 31. SHH MBs have also been stratified into low‐, standard‐ and high‐risk groups based on GLI2 amplification, 14q loss and leptomeningeal dissemination 28. Additionally, novel prognostic markers have come to the fore, such as the histone modifiers H3K27me3 and H3K4me3, staining patterns of which were associated with differences in survival in groups 3 and 4 but not in WNT or SHH MBs 4. Therefore, we also selectively analyzed some of these FISH and IHC markers reported to have prognostic significance in MBs, to evaluate if their addition to the subgrouping protocol could further enhance risk stratification of MB patients.
Materials and Methods
All cases of MB diagnosed over a period of 10 years (2003–2012) in the Neuropathology Laboratory of the Department of Pathology, All India Institute of Medical Sciences, New Delhi, were retrieved. The study cohort consisted of cases with adequate tumor tissue in FFPE blocks, for which treatment and follow‐up data were obtained.
Histopathology
Hematoxylin and eosin (H and E)‐stained slides of all cases were reviewed and a concordant agreement was established for the confirmation of the diagnosis between three pathologists (VS, MCS and CS), based on the WHO 2007 classification 10. Cases were classified as classic MB, desmoplastic/nodular (D/N) MB, MB with extensive nodularity (MBEN), large cell MB and anaplastic MB. Large cell and anaplastic tumors were grouped together in study datasets as LC/A tumors.
Immunohistochemistry
IHC was performed by the labeled streptavidin‐biotin immunoperoxidase technique (LSAB). The antibody panel recommended by Taylor et al 29 was performed, including β‐catenin, DKK1, GAB1, GLI1, SFRP1, YAP1, NPR3, and KCNA1 antibodies. Filamin A was, however, excluded as its immunoexpression was similar to YAP1 in the three subgroups. We also performed IHC for GRM8 for group 4 used by Cho et al 3, and Notch1 as Notch signaling pathway genes have been found to be upregulated in WNT and SHH subgroup tumors 14. In addition, IHC for H3K4me3, H3K27me3 and p53 was performed to analyze their utility as prognostic markers (Table 1).
Table 1.
Panel of antibodies used for immunohistochemistry
| Antibody | Company (catalog no.) | Dilution | Localization | MB subgroup |
|---|---|---|---|---|
| β‐catenin/CTNNB1 | BD Transduction Laboratories (ab610154) | 1:200 | Nuclear | WNT |
| DKK1 | Abcam (ab109416) | 1:200 | Nuclear | WNT |
| GAB1 | Abcam (ab133486) | 1:100 | Cytoplasmic | SHH |
| GLI1 | Abcam (ab92611) | 1:50 | Nuclear | SHH |
| SFRP1 | Abcam (ab4193) | 1:25 | Membranous | SHH |
| NOTCH1 | Abcam (ab52627) | 1:200 | Membranous | WNT and SHH |
| YAP1 | Santa Cruz (sc‐101199) | 1:200 | Nuclear | WNT and SHH |
| NPR3 | Abcam (ab123957) | 1:200 | Membranous and cytoplasmic | Group 3 |
| Sigma (HPA031065) | 1:25 | Membranous and cytoplasmic | ||
| GRM8 | Abcam (ab53094) | 1:50 | Cytoplasmic | Group 4 |
| KCNA1 | Abcam (ab32433) | 1:750 | Nuclear and cytoplasmic | Group 4 |
| H3K4me3 | Abcam (ab8580) | 1:800 | Nuclear | Prognostic marker |
| H3K27me3 | Abcam (ab6002) | 1:200 | Nuclear | Prognostic marker |
| p53 | Santa Cruz sc126 (DO‐1 clone) | 1:1000 | Nuclear | Prognostic marker |
Fluorescence in situ hybridization
Dual‐color FISH was performed on 5 micron thick paraffin‐embedded sections, with locus‐specific probe for MYC on 8q24 (Spectrum green) paired with a reference probe CEP 8 (Spectrum orange) (ZytoVision GmbH, Fischkai, Germany).
Sections were deparaffinized with three 10‐minute immersions in xylene, followed by two 3‐minute immersions in 100% ethanol. Target retrieval was achieved by immersing the slides in citrate buffer (pH 6.0) and boiling in a pressure cooker for 20 minutes. Slides were then exposed to 0.04% pepsin digestion (P‐7000; Sigma‐ Aldrich, St. Louis, MO, USA) for 30 minutes at 37°C, and then fixed in solution B for 10 min, followed by dehydration in ascending grades of alcohol (70%, 90%, 100%) for 3 minutes each. Probe mixture (10 μL) was applied on each section. Simultaneous probe/specimen denaturation was performed at 73°C for 5 minutes with subsequent overnight incubation at 37°C in Thermobrite TM hybridization chamber (Vysis, Downers Grove, IL, USA). Sections were washed the next day in 2X SSC for 2 minutes at 73°C, and then in 0.5X SSC for 2 minutes at room temperature. Sections were counterstained with 4, 6‐diamidino‐ 2‐phenylindole (DAPI) and visualized under a fluorescence microscope.
MYC amplification was considered in tumors with ≥8 signals (and ≤2 CEP8 control signals), or innumerable tight clusters of signals, in more than 10% of nuclei. Double minute patterns or homogeneously staining regions were also taken as amplification.
Real‐time PCR
Real‐time PCR was performed on FFPE tissue. A panel of mRNA and miRNA previously reported to be useful for identifying groups 3 and 4 15, 20 was selected for analysis: (i) protein‐coding genes IMPG2 and NPR3 specific for group 3, and UNC5D and GRM8 specific for group 4; (ii) miRNAs mir‐135b specific for groups 3 and 4, and mir‐592 specific for group 4. Briefly, 10‐μm sections were deparaffinized using xylene followed by absolute ethanol washes and subsequent digestion with proteinase K overnight at 55°C. Total RNA was isolated using Total Nucleic acid isolation kit (Ambion, Life Technologies, CA, USA). The differential expression of the protein‐coding genes and miRNAs was analyzed by real‐time quantitative PCR. For gene expression analysis, total RNA (1 μg) was reverse transcribed to cDNA using SuperScript® VILO™ cDNA Synthesis Kit (Life Technologies). For miRNA expression analysis, total RNA (1 μg) was reverse transcribed to cDNA using NCode™ VILO™ miRNA cDNA Synthesis Kit (Life Technologies, California, USA). The primer lists and their sequences used for real‐time PCR analysis are listed in Table 2. Expression was analyzed by SYBR Green PCR amplification assay on Light cycler (Roche Diagnostics Ltd, Lewes, UK) using 20 ng of cDNA per reaction. Tissue from normal cerebellum was used as control. Cerebellar RNA was used to determine the normal range of expression for the miRNAs. Relative changes in gene and miRNA expression from real‐time quantitative PCR experiments were analyzed by 2−ΔΔCt method. GAPDH and RNU6 were used as internal control for protein‐coding gene and miRNA expression, respectively.
Table 2.
Sequence of primers used for RT‐PCR
| Forward primer | Reverse primer | |
|---|---|---|
| Gene | ||
| NPR3 | CTAGGAGCTGGCTTGCTAAT | GGGTTCGCCTCTCAATGGTTAT |
| IMPG2 | TGTACTTGAATTTAGGTCCCCC | CCTCACCATTGAAGGTAACTGC |
| GRM8 | ACTGGACCAATCAGCCTTCATCTAA | CGGGTGAGTATGTTCTCTATGAG |
| UNC5D | CAACCAAGGTGAACCCAGCC | CCACAGGTGACTTCAGGACTC |
| miRNA | ||
| has‐miR‐135b | TATGGCTTTTCATTCCTATGT | Universal reverse primer |
| has‐miR‐592 | TTGTGTCAATATGCGATGATG | Universal reverse primer |
Statistical analysis
SPSS version 15 software (SPSS Inc., Chicago, IL, USA) was used for statistical analysis. Descriptive statistics, that is, mean and frequency distributions were calculated for all variables. chi‐square test and Fisher's exact test were applied to determine association between categorized variables. Kaplan–Meier survival curves were plotted for survival analysis. A P‐value of 0.05 was considered as the level of statistical significance.
Results
Study group
MBs constituted 5% of all intracranial, 18% of posterior fossa and 78% of all embryonal tumors diagnosed during the study period. Ninety‐two cases (52 pediatric [≤18 years] and 40 adult) with adequate tumor tissue in FFPE tissue blocks were identified. Patients ranged in age from 1 to 65 years (median age = 13 years). Majority of childhood tumors (26/52, 50%) occurred in the 7–10 year age group, while adult MBs were seen predominantly (18/40, 45%) in the 19–25 year age group. There was an overall male preponderance with a male: female ratio of 2.7:1. The male preponderance was significantly higher in children (sex ratio 3.3:1) as compared with that in adults (sex ratio 2.1:1). Two‐thirds of cases (65%) were vermian (midline) in location, while one‐third (35%) were located laterally in the cerebellar hemispheres. While majority (38/48; 79.2%) of pediatric tumors were located in the midline, most adult tumors (20/38; 52.6%) were located laterally (P = 0.002). Follow‐up period ranged from 1.8 to 506.6 weeks, with a median of 97.3 weeks. Forty patients (57%) had no evidence of disease at last follow‐up; 22 patients (32%) had progressive disease and 8 (11%) had died because of disease. Follow‐up of 2–5 years duration was available in 87% (61/70) of patients, and of more than 5 years in 13% (9/70) patients.
Histopathology
Majority of tumors (63 cases, 68.5%) were classic MB, followed by D/N MB (19 cases, 20.6%); a small percentage were LC/A MB (8 cases, 8.7%) and the least common was MBEN (2 cases, 2.2%). Classic MBs were distributed across all age groups, but were significantly more frequent in childhood (84.6%; 44/52) as compared with adults (50%; 20/40) (P < 0.001). Most of of D/N MBs (78%) were seen in adults. Conversely, D/N accounted for 35% (14/40) of adult MBs while they were seen in only 7.7% (4/52) of children (P < 0.001). There were two MBEN cases, both of which were seen under the age of 4 years. LC/A MBs were seen in children (2/8; 25%) and young adults, that is, 19 to ≤40 years (6/8; 75%) but were absent in infants and older adults (>40 years).
Molecular subgrouping of MB: immunohistochemistry
Of the antibody panel performed, only three antibodies, viz. β‐catenin, GAB1 and YAP1 proved to be of utility in categorization of MBs into molecular subgroups. Based on the results of immunohistochemical staining, tumors were classified into WNT (β‐catenin and YAP1 positive; GAB1 negative), SHH (GAB1 and YAP1 positive, β‐catenin negative) or non‐WNT/SHH (β‐catenin, GAB1 and YAP1 negative) groups (Figure 1).The other antibodies showed non‐specific immunoexpression and cross‐reactivity, thus lacked in sensitivity and specificity, and there was no correlation with subgroups as defined by β‐catenin, GAB1 and YAP1. DKK‐1 was positive in 70%, GLI‐1 in 85% and GRM8 in 35% of MBs. NPR3 showed cytoplasmic positivity in all cases (100%); however, membranous staining was present in only 7.5% of cases. Diffuse, strong nuclear and cytoplasmic positivity for KCNA‐1 was not identified in any of the cases, while 50% showed focal, faint nuclear and cytoplasmic positivity. There was extensive overlap in the immunoexpression of all these antibodies and meaningful subgroups could not be identified using them. SFRP‐1 and Notch‐1 could not be standardized even after employing various methods.
Figure 1.
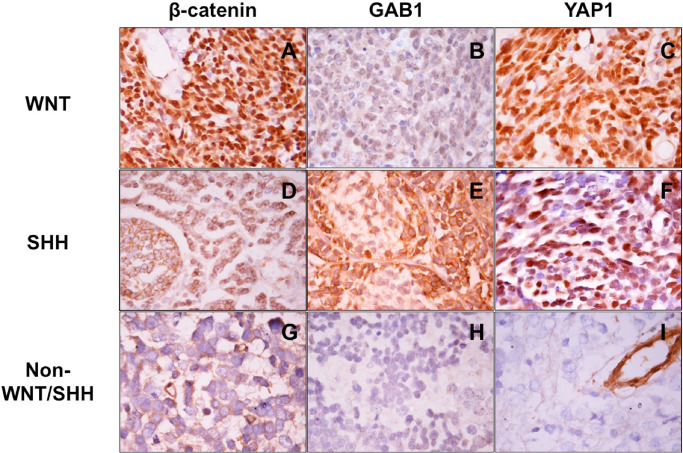
Immunohistochemical panel for subclassification of medulloblastomas: WNT tumor (A–C) showing nuclear β‐catenin and YAP1 positivity while GAB1 is negative; SHH tumor (D–F) immunopositive for GAB1 and YAP1 but lacking β‐catenin nucleopositivity; non‐WNT/SHH tumor (G–I) negative for all three markers.
On IHC, WNT, SHH and non‐WNT/SHH tumors contributed 9.8% (nine cases), 45.6% (42 cases) and 44.6% (41 cases), respectively, to the study group. These subgroups differed significantly in age, gender and site distribution, histopathological variants and in patient outcome (Figure 2; Table 3).
Figure 2.
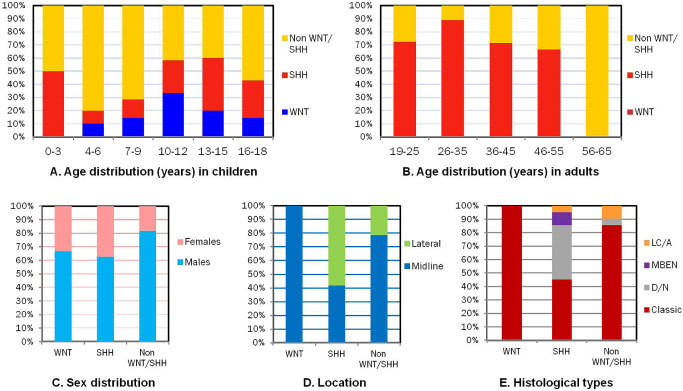
Clinicopathological characteristics of medulloblastoma subgroups: comparison of molecular subgroups with age in children (A) and adults (B), sex (C), tumor location (D) and histopathological variants (E).
Table 3.
Summary of molecular subgroups of medulloblastoma
| WNT number (%) | SHH number (%) | Non‐WNT/SHH number (%) | P‐value | |
|---|---|---|---|---|
| Number of patients | 9 (9.8) | 42 (45.6) | 41 (44.6) | |
| Pediatric | 9 (100) | 12 (28.6) | 31 (75.6) |
WNT vs. others 0.009* SHH vs. others <0.0001* Non‐WNT/SHH vs. others <0.001* |
| Adult | — | 30 (71.4) | 10 (24.4) | |
| Age (years) | ||||
| Range | 6–16 | 1–55 | 3–65 | |
| Median | 10 | 22 | 11 | |
| Mean | 10.2 | 24.2 | 16.1 | |
| Sex | ||||
| Males | 6 (66.7) | 27 (64.3) | 34 (82.9) |
WNT vs. others 0.49 SHH vs. others 0.08 Non‐WNT/SHH vs. others 0.05* |
| Females | 3 (33.3) | 15 (35.7) | 7 (17.1) | |
| M : F ratio | 2:1 | 1.8:1 | 4.8:1 | |
| Location | ||||
| Midline | 8 (100) | 15 (41.7) | 33 (80.5) |
WNT vs. others 0.04* SHH vs. others <0.001* Non‐WNT/SHH vs. others 0.01* |
| Lateral | 0 (0) | 21 (58.3) | 8 (19.5) | |
| Not available | 1 | 06 | 0 | |
| Clinical staging | ||||
| High risk | 3 (60) | 19 (76) | 24 (80) |
WNT vs. others 0.5 SHH vs. others 0.5 Non‐WNT/SHH vs. others 0.7 |
| Average risk | 2 (40) | 6 (24) | 6 (20) | |
| Not available | 4 | 17 | 11 | |
| Histological type | ||||
| Classical | 9 (100) | 19 (45.2) | 36 (87.8) |
WNT vs. SHH < 0.002* Non‐WNT/SHH vs. SHH < 0.0001* SHH vs. others <0.0001* |
| D/N | Nil | 17 (40.5) | 1 (2.4) | |
| LC/A | Nil | 4 (9.5) | 4 (9.8) | |
| MBEN | Nil | 2 (4.8) | 0 (0) | |
| Treatment | ||||
| Complete | 4 (57.1) | 14 (51.9) | 29 (82.9) | |
| Incomplete | 3 (42.9) | 13 (48.1) | 6 (17.1) | |
| Not available | 2 | 15 | 6 | |
| Follow‐up (weeks) | ||||
| Available | 7 (77.8) | 28 (66.7) | 35 (85.4) |
WNT vs. SHH < 0.05* WNT vs. Non‐WNT/SHH < 0.001* SHH vs. Non‐WNT/SHH 0.06 |
| Range | 138.1–369.4 | 1.8–319.4 | 4.6–506.6 | |
| Mean | 125.2 | 96.2 | 103.4 | |
| No evidence of disease | 7 (100) | 18 (64.3) | 15 (42.9) | |
| Range | 138.1–369.4 | 1.8–319.4 | 6.2–506.6 | |
| Mean | 125.2 | 111.2 | 86.2 | |
| Progressive disease | — | 6 (21.4) | 16 (45.7) | |
| Range | — | 4.4–63.3 | 4.57–505 | |
| Mean | — | 36.2 | 122.5 | |
| Death | — | 4 (14.3) | 4 (11.4) | |
| Range | — | 71–161 | 62–148.2 | |
| Mean | — | 118.5 | 104.2 |
*Statistically significant.
WNT MBs
Nuclear β‐catenin immunopositivity in ≥5% of tumor cells, similar to the cutoff recommended by Goschzik et al 11, and YAP1 immunopositivity robustly identified this group. WNT tumors were seen predominantly in the age range of 6–10 years (5/9, 55.6%), and were not seen in infants or adults. They were all located in the midline and were uniformly classic MBs on histology.
SHH MBs
Combined immunoreactivity for GAB1 and YAP1 indicated a SHH profile, and was seen in 45.6% cases. SHH MBs were predominantly seen in infants and in adults (32/42; 76.2%). Most laterally located MBs (21/29; 72.4%) belonged to this subgroup. Almost all nodular MBs (17/20; 85%), that is, both MBEN and D/N MBs, were seen in this group.
Non‐WNT/SHH MBs
MBs, which displayed only cytoplasmic staining for β‐catenin, and were immunonegative for GAB1 and YAP1, belonged to this group. Half of all LC/A MBs (4/8; 50%) were seen in this subgroup. Majority of non‐WNT/SHH MBs were seen in pediatric patients (31/41; 75.6%), with only 24.4% cases among adults. Although there was a male preponderance in all groups, this group had a significantly high M : F ratio of 4.8:1 (P = 0.05). NPR3 and KCNA1 were found to be neither sensitive nor specific for subgrouping these tumors into groups 3 and 4.
Molecular subgrouping of MB: real‐time PCR
As no IHC marker could reliably differentiate non‐WNT/SHH tumors into groups 3 and 4, we analyzed expression of group‐specific mRNA and miRNA (Figure 3). Real‐time PCR for expression of protein‐coding genes (NPR3 and IMPG2 specific to group 3; UNC5D and GRM8 specific to group 4), and miRNAs (mir‐135b specific for groups 3 and 4, and mir‐592 specific for group 4) was performed in 30 cases, including 6 WNT, 5 SHH and 19 non‐WNT/SHH MBs. Cases with high expression of IMPG2 and NPR3 were considered as group 3 and cases with high expression of UNC5D and GRM8 were taken as group 4 15.
Figure 3.
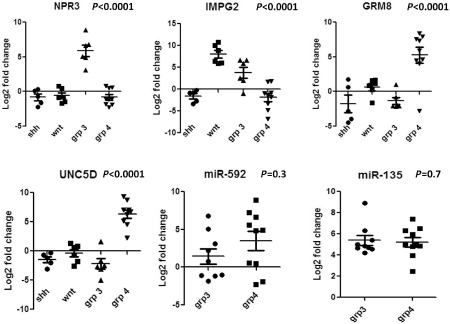
Scatter plots showing results of real‐time PCR for NPR3, IMPG2, GRM8, UNC5D, miR‐592 and miR‐135b.
High expression of IMPG2 and NPR3 was found in five cases of non‐WNT/SHH MBs, while one case each showed upregulation of either one of these markers; these were classified as group 3 (6/19; 31.6%). Eight cases showed upregulation of both UNC5D and GRM8 while one case showed upregulation of UNC5D alone; these cases were classified as group 4 (9/19; 47.4%). In all WNT tumors (6/6), high expression of IMPG2 alone was observed; none of the SHH tumors showed upregulation of any of the four markers. In the remaining non‐WNT/SHH MBs (4/19; 21%), RNA isolated was of poor quality and it was not possible to separate them into groups 3 and 4 based on mRNA expression.
MicroRNA expression analysis showed high expression of mir‐592 in 10 and its downregulation in eight non‐WNT/SHH cases. All 19 non‐WNT/SHH MBs showed high expression of mir‐135. Expression of microRNA mir‐592 (P > 0.3) and mir‐135 (P > 0.69) was not significantly different between groups 3 and 4, and thus did not help to differentiate between them.
Prognostic markers: FISH and IHC
FISH for MYC amplication was performed in 62 cases, of which 41 were non‐WNT/SHH. MYC amplification (Figure 4) was seen in 11% of cases (7/62), all of which were non‐WNT/SHH MBs. Clinicopathological characteristics of tumors showing amplification were not significantly different from the remaining cases of non‐WNT/SHH MBs. Results for mRNA expression were available for four of the seven cases showing MYC amplification, all of which had been identified as group 3 MBs.
Figure 4.
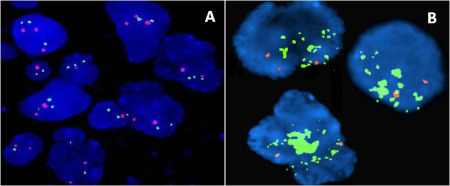
MYC amplification by FISH: Control showing two red and two green signals (A); MYC‐amplified medulloblastoma showing numerous green signals singly as well as in tight clusters (B).
IHC for H3K4me3 and H3K27me3 was performed in 35 cases, including 7 WNT (20%), 9 SHH (25.7%) and 19 non‐WNT/SHH (54.3%). None of the cases from any of the subgroups showed loss of H3K4me3 immunoexpression, while loss of H3K27me3 was identified in 40% (14/35) of cases (1 WNT, 5 SHH and 8 non‐WNT/SHH). Both markers were retained in 60% cases; while H3K27me3 loss with retained H3K4me3 expression was seen in 40% cases. However, there was neither a difference in distribution among the three molecular subgroups identified, nor was there an association with patient outcome. Immunopositivity for p53 in these 35 MBs was distributed almost equally across all subgroups and did not show any correlation with survival.
Survival analysis
Histopathological variants and molecular subgroups had a significant correlation with clinical outcome. Nodular MBs (MBEN and D/N) had the best prognosis, while LC/A had the worst outcome, with all patients having progressive disease (P < 0.001). Among the molecular subgroups, WNT had the best outcome with excellent PFS, non‐WNT/SHH had the worst, and SHH had an intermediate prognosis (P = 0.008). Within the non‐WNT/SHH group, MYC‐amplified cases had a significantly worse outcome (P = 0.001). Overall, WNT MBs had the best, while MYC‐amplified non‐WNT/SHH MBs had the worst outcome (P = 0.002; Figure 5). IHC for p53, H3K4me3 and H3K27me3 did not correlate with survival, nor did age or tumor location.
Figure 5.
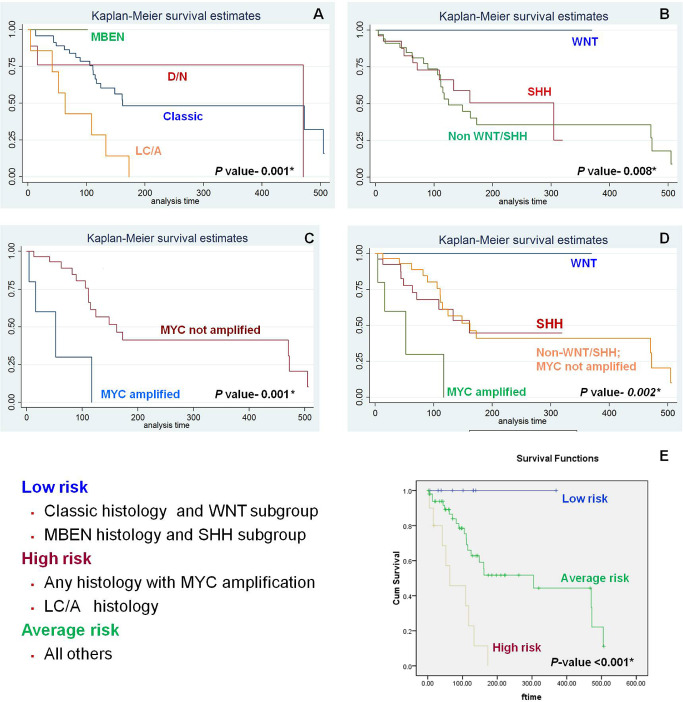
Survival curves for histopathological variants (A), molecular subgroups (B), MYC amplification status (C) and molecular subgroups with MYC amplification status (D); E shows the proposed three‐tier risk stratification system and the survival curves obtained by using this system to stratify patients into low‐, average‐ and high‐risk groups.
Three‐tier risk stratification system
As histopathology, molecular subgroup and MYC amplification were the variables that correlated most significantly with outcome, we stratified patients based on a combination of these. As WNT subgroup and MBEN histology have an excellent prognosis, we clubbed them as low‐risk parameters. MYC amplification and LC/A histology have a grim outcome, and were considered as high‐risk parameters. All the remaining MBs formed the intermediate risk group. Using this system, we were able to stratify patients into three groups, which differed significantly in their survival (<0.01; Figure 5E), and this risk stratification system is similar to that being used in recent clinical trials 12.
Discussion
In recent years, studies based on various high‐throughput methods have firmly established that MB is not a single tumor but a heterogeneous entity with four distinct molecular subgroups 3, 13, 14, 19, 29, 30. While this classification continues to evolve, with evidence of further hierarchical subtypes within these subgroups, the main challenge at present in neuro‐oncology practice is the application of this molecular classification system in routine diagnostics. Transcription profiling, requiring high‐quality RNA, is impractical and not feasible on a day‐to‐day basis, necessitating identification of methods that are cost‐effective, rapid, robust, reproducible, can be performed on FFPE tissue, and are available universally. In 2011, Northcott et al reported that a panel of four antibodies viz. DKK1, SFRP1, NPR and KCNA1, could reliably classify most MBs into one of the four subgroups 19. However, since then, their results have been proven to be irreproducible by other groups 2, 18. Subsequently, they described a Nanostring‐based assay analyzing 22 subgroup‐specific signature genes, which effectively assigned MBs to the molecular subgroups using FFPE tissue 20. More recently, Schwalbe et al 27 described DNA methylation profiling on FFPE tissue as a method for subclassification of MBs. However, these assays remain impractical in routine practice especially in developing countries, as they are laborious and, more importantly, extremely expensive and hence, unaffordable.
WNT and SHH tumors are each typically associated with molecular alterations in a defined signaling pathway. On the other hand, no specific driver mutations or affected cell signaling pathways have been identified for groups 3 and 4, making it an uphill task to allocate non‐WNT/SHH MBs to either of them. A number of studies have therefore restricted MB classification into three subgroups viz. WNT, SHH and non‐WNT/SHH 7, 18, 26. Schwalbe et al validated a minimal mRNA expression signature assay for classification of MBs into WNT, SHH and WNT/SHH‐independent subgroups 26. This method was more rapid and cost‐effective as compared with expression microarrays. An immunohistochemical panel of four antibodies viz. β‐catenin, GAB1, YAP1 and filamin A was proposed by Ellison et al, which robustly identified these three subgroups, validated by gene expression profiling using Affymetrix U133Av2 arrays 7. Min et al, in the only other study from Asia, performed IHC with eight antibodies, FISH for MYC, MYCN, RARA and MYB, sequencing for β‐catenin mutation and array‐based comparative genomic hybridization (aCGH). As chromosomal aberrations identified by aCGH failed to divide MBs into the four subgroups, they classified MBs into WNT, SHH and non‐WNT/SHH subgroups on the basis of β‐catenin and GAB1 IHC, β‐catenin mutation and FISH results 18. The remaining antibodies showed results similar to our findings. DKK1, SFRP1, filamin A and YAP1 immunoexpression lacked specificity for each molecular subgroup. GLI1, CRX and GRM8 IHC also could not be optimized for subgrouping. They also reported that KCNA1 and NPR3 were neither specific nor sensitive markers for the subgroups, which was similar to the results of Bien‐Willner et al 2. In our study, we successfully utilized a three‐antibody immunohistochemical panel to identify WNT, SHH and non‐WNT/SHH subgroups that were similar to those of Ellison et al 7. The frequency, age distribution, tumor location, histopathological variants within each subgroup and relationship to outcome were similar to findings reported in literature, including those by high‐throughput techniques 8, 14, 19. The frequency of SHH MBs, however, was higher in our cohort as compared with previous reports, which may be due to the higher proportion of adults included. Similar to Bien‐Willner et al and Min et al 2, 18, we found that the remaining antibodies were not mutually exclusive and could not be used to subdivide MBs into the three subgroups. There was no correlation of expression of these antibodies with histopathology or with clinical parameters and patient outcome.
None of the immunohistochemical markers utilized in our study could further separate non‐WNT/SHH tumors into groups 3 and 4. We therefore analyzed mRNA and miRNA expression of a limited panel of four protein‐coding genes demonstrated to have subgroup‐specific expression patterns and two miRNAs with differential expression within these subgroups for allocating MB cases to groups 3 and 4 15, 20. Using combinatorial gene expression data of the four protein coding genes, majority of non‐WNT/SHH MBs could be segregated into groups 3 and 4. However, the crux of the matter lies in addressing the necessity for expensive techniques like real‐time PCR for classification of non‐WNT/SHH MBs. Results of real‐time PCR are highly dependent on the quality of RNA isolated, which is not always optimal from FFPE tissue, and also requires a certain level of technical expertise. We therefore propose that non‐WNT/SHH MBs be further stratified according to risk, based on cytogenetic alterations such as MYC amplification, rather than into groups 3 and 4, which is difficult in routine clinical practice.
Currently, risk stratification is performed using Chang's criteria, which is based entirely on clinical features, and leaves much to be desired in predicting patient outcome. It is likely that patients belonging to subgroups with good prognosis, for example, WNT MBs could benefit from downscaling of treatment, while those subgroups associated with worse outcome require more intensive therapy 7. In addition, a number of molecular markers are reported to have subgroup‐specific prognostic connotations. Zhukova et al showed that TP53 mutations are seen in WNT and SHH MBs, but are rare in groups 3 and 4 31. There was a significant difference in overall survival between SHH tumors with and without mutated TP53 in their study. MYC amplification, which is enriched in group 3 MBs, has consistently been associated with shorter survival periods, and has served as a high‐risk factor for outcome prediction in various studies 5, 8, 16, 22. In the present study, MYC amplification was associated with a worse outcome among non‐WNT/SHH MBs, consistent with findings in literature. In addition, on comparison with WNT and SHH, MYC‐amplified non‐WNT/SHH tumors had the worst survival among all groups. p53 IHC, a surrogate marker for TP53 mutation, on the other hand, had no such association with survival. However, this could be attributed to lack of complete concordance between p53 IHC and TP53 mutation status, as has been shown in other tumors.
Histone modifiers, the new kid on the block, have lately been demonstrated to affect outcome of MB patients. Dubuc et al showed that H3K4me3 + /H3K27me3− MBs were likely to have the best outcome, while H3K4me3‐/ H3K27me3‐ MBs have the worst survival 4. They identified isolated or combined loss of H3K4me3/H3K27me3 in 24% of cases. In our study, loss of either one of these chromatin marks was seen in a higher proportion of cases (40%), which was irrespective of subgroup. Combined loss was, however, not identified. These alterations in histone code did not confer any prognostic value on our study.
Our study describes a minimal panel to classify MBs into three subgroups viz. WNT, SHH and non‐WNT/SHH using IHC and FISH, which are two rapid, economical, pathologist‐friendly techniques that give reproducible results on FFPE tissue, and also provides data on association between clinical, pathological and molecular variables. Using three antibodies for classification complemented by one FISH assay for further prognostication, this method for subdividing MBs can easily be incorporated into routine clinical practice, including in developing countries. Unlike expensive microarray techniques, this panel is practical, can be easily performed over 1–2 days, even on a single case on a day‐to‐day basis, and is cost‐effective [$150–$250 (9000–15 000 INR)/case]. Using this panel, patients can be easily classified using the three‐tier risk stratification system proposed by us, and this system can be used to supplement clinical staging and modify therapeutic regimens.
Conflict of Interest
None of the authors has any conflict of interest to declare.
References
- 1. Armstrong GT, Liu Q, Yasui Y, Huang S, Ness KK, Leisenring W et al (2009) Long‐term outcomes among adult survivors of childhood central nervous system malignancies in the Childhood Cancer Survivor Study. J Natl Cancer Inst 101:946–958. [DOI] [PMC free article] [PubMed] [Google Scholar]
- 2. Bien‐Willner GA, Lopez‐Terrada D, Bhattacharjee MB, Patel KU, Stankiewicz P, Lupski JR et al (2012) Early recurrence in standard‐risk medulloblastoma patients with the common idic(17)(p11.2) rearrangement. Neuro‐Oncol 14:831–840. [DOI] [PMC free article] [PubMed] [Google Scholar]
- 3. Cho YJ, Tsherniak A, Tamayo P, Santagata S, Ligon A, Greulich H et al (2011) Integrative genomic analysis of medulloblastoma identifies a molecular subgroup that drives poor clinical outcome. J Clin Oncol 29:1424–1430. [DOI] [PMC free article] [PubMed] [Google Scholar]
- 4. Dubuc AM, Remke M, Korshunov A, Northcott PA, Zhan SH, Mendez‐Lago M et al (2013) Aberrant patterns of H3K4 and H3K27 histone lysine methylation occur across subgroups in medulloblastoma. Acta Neuropathol 125:373–384. [DOI] [PMC free article] [PubMed] [Google Scholar]
- 5. Eberhart CG, Kratz J, Wang Y, Summers K, Stearns D, Cohen K et al (2004) Histopathological and molecular prognostic markers in medulloblastoma: C‐myc, N‐myc, TrkC, and anaplasia. J Neuropathol Exp Neurol 63:441–449. [DOI] [PubMed] [Google Scholar]
- 6. Ellison DW, Onilude OE, Lindsey JC, Lusher ME, Weston CL, Taylor RE et al (2005) United Kingdom Children's Cancer Study Group Brain Tumour Committee. beta‐Catenin status predicts a favorable outcome in childhood medulloblastoma: the United Kingdom Children's Cancer Study Group Brain Tumor Committee. J Clin Oncol 23:7951–7957. [DOI] [PubMed] [Google Scholar]
- 7. Ellison DW, Dalton J, Kocak M, Nicholson SL, Fraga C, Neale G et al (2011) Medulloblastoma: clinicopathological correlates of SHH, WNT, and non‐SHH/WNT molecular subgroups. Acta Neuropathol 121:381–396. [DOI] [PMC free article] [PubMed] [Google Scholar]
- 8. Ellison DW, Kocak M, Dalton J, Megahed H, Lusher ME, Ryan SL et al (2011) Definition of disease—risk stratification groups in childhood medulloblastomas using combined clinical, pathological, and molecular variables. J Clin Oncol 29:1400–1407. [DOI] [PMC free article] [PubMed] [Google Scholar]
- 9. Gajjar A, Chintagumpala M, Ashley D, Kellie S, Kun LE, Merchant TE et al (2006) Risk‐adapted craniospinal radiotherapy followed by high‐dose chemotherapy and stem‐cell rescue in children with newly diagnosed medulloblastoma (St. Jude Medulloblastoma‐96): long‐term results from a prospective, multicentre trial. Lancet Oncol 7:813–820. [DOI] [PubMed] [Google Scholar]
- 10. Giangaspero F, Ebehart CG, Haapasalo H, Pietsch T, Wiestler OD, Ellison DW (2007) Medulloblastoma (Chapter 8). In: WHO Classification of Tumors of the Central Nervous System. Louis DN, Ohgaki H, Wiestler OD, Cavenee WK (eds), pp. 132–140. IARC: Lyon. [Google Scholar]
- 11. Goschzik T, Zur Mühlen A, Kristiansen G, Haberler C, Stefanits H, Friedrich C et al (2015) Molecular stratification of medulloblastoma: comparison of histological and genetic methods to detect Wnt activated tumours. Neuropathol Appl Neurobiol 41:135–144. [DOI] [PubMed] [Google Scholar]
- 12. Gottardo NG, Hansford JR, McGlade JP, Alvaro F, Ashley DM, Bailey S et al (2014) Medulloblastoma Down Under 2013: a report from the third annual meeting of the International Medulloblastoma Working Group. Acta Neuropathol 127:189–201. [DOI] [PMC free article] [PubMed] [Google Scholar]
- 13. Kool M, Koster J, Bunt J, Hasselt NE, Lakeman A, van Sluis P et al (2008) Integrated genomics identifies five medulloblastoma subtypes with distinct genetic profiles, pathway signatures and clinicopathological features. PLoS ONE 3:e3088. [DOI] [PMC free article] [PubMed] [Google Scholar]
- 14. Kool M, Korshunov A, Remke M, Jones DT, Schlanstein M, Northcott PA et al (2012) Molecular subgroups of medulloblastoma: an international meta‐analysis of transcriptome, genetic aberrations, and clinical data of WNT, SHH, Group 3, and Group 4 medulloblastomas. Acta Neuropathol 123:473–484. [DOI] [PMC free article] [PubMed] [Google Scholar]
- 15. Kunder R, Jalali R, Sridhar E, Moiyadi A, Goel N, Goel A et al (2013) Real‐time PCR assay based on the differential expression of microRNAs and protein‐coding genes for molecular classification of formalin‐fixed paraffin embedded medulloblastomas. Neuro‐Oncol 15:1644–1651. [DOI] [PMC free article] [PubMed] [Google Scholar]
- 16. Lamont JM, McManamy CS, Pearson AD, Clifford SC, Ellison DW (2004) Combined histopathological and molecular cytogenetic stratification of medulloblastoma patients. Clin Cancer Res 10:5482–5493. [DOI] [PubMed] [Google Scholar]
- 17. Louis DN, Perry A, Burger P, Ellison DW, Reifenberger G, von Deimling A et al (2014) International Society Of Neuropathology–Haarlem consensus guidelines for nervous system tumor classification and grading. Brain Pathol 24:429–435. [DOI] [PMC free article] [PubMed] [Google Scholar]
- 18. Min HS, Lee JY, Kim SK, Park SH (2013) Genetic grouping of medulloblastomas by representative markers in pathologic diagnosis. Transl Oncol 6:265–272. [DOI] [PMC free article] [PubMed] [Google Scholar]
- 19. Northcott AP, Korshunov A, Witt H, Hielscher T, Eberhart CG, Mack S et al (2011) Medulloblastoma comprises four distinct molecular variants. J Clin Oncol 29:1408–1414. [DOI] [PMC free article] [PubMed] [Google Scholar]
- 20. Northcott PA, Shih DJH, Remke M, Cho YJ, Kool M, Hawkins C et al (2012) Rapid, reliable, and reproducible molecular sub‐grouping of clinical medulloblastoma samples. Acta Neuropathol 123:615–626. [DOI] [PMC free article] [PubMed] [Google Scholar]
- 21. Packer RJ, Gurney JG, Punyko JA, Donaldson SS, Inskip PD, Stovall M et al (2003) Long‐term neurologic and neurosensory sequelae in adult survivors of a childhood brain tumor: childhood cancer survivor study. J Clin Oncol 21:3255–3261. [DOI] [PubMed] [Google Scholar]
- 22. Pfister S, Remke M, Benner A, Mendrzyk F, Toedt G, Felsberg J et al (2009) Outcome prediction in pediatric medulloblastoma based on DNA copy‐number aberrations of chromosomes 6q and 17q and the MYC and MYCN loci. J Clin Oncol 27:1627–1636. [DOI] [PubMed] [Google Scholar]
- 23. Remke M, Hielscher T, Northcott PA, Witt H, Ryzhova M, Wittmann A et al (2011) Adult medulloblastoma comprises three major molecular variants. J Clin Oncol 29:2717–2723. [DOI] [PubMed] [Google Scholar]
- 24. Rutkowski S, Bode U, Deinlein F, Ottensmeier H, Warmuth‐Metz M, Soerensen N et al (2005) Treatment of early childhood medulloblastoma by postoperative chemotherapy alone. N Engl J Med 352:978–986. [DOI] [PubMed] [Google Scholar]
- 25. Rutkowski S, von Hoff K, Emser A, Zwiener I, Pietsch T, Figarella‐Branger D et al (2010) Survival and prognostic factors of early childhood medulloblastoma: an international meta‐analysis. J Clin Oncol 28:4961–4968. [DOI] [PubMed] [Google Scholar]
- 26. Schwalbe EC, Lindsey JC, Straughton D, Hogg TL, Cole M, Megahed H et al (2011) Rapid diagnosis of medulloblastoma molecular subgroups. Clin Cancer Res 17:1883–1894. [DOI] [PMC free article] [PubMed] [Google Scholar]
- 27. Schwalbe EC, Williamson D, Lindsey JC, Hamilton D, Ryan SL, Megahed H et al (2013) DNA methylation profiling of medulloblastoma allows robust subclassification and improved outcome prediction using formalin‐fixed biopsies. Acta Neuropathol 125:359–371. [DOI] [PMC free article] [PubMed] [Google Scholar]
- 28. Shih DJH, Northcott PA, Remke M, Korshunov A, Ramaswamy V, Kool M et al (2014) Cytogenetic prognostication within medulloblastoma subgroups. Clin Oncol 32:886–896. [DOI] [PMC free article] [PubMed] [Google Scholar]
- 29. Taylor MD, Northcott PA, Korshunov A, Remke M, Cho YJ, Clifford S et al (2012) Molecular subgroups of medulloblastoma: the current consensus. Acta Neuropathol 123:465–472. [DOI] [PMC free article] [PubMed] [Google Scholar]
- 30. Thompson MC, Fuller C, Hogg TL, Dalton J, Finkelstein D, Lau CC et al (2006) Genomics identifies medulloblastoma subgroups that are enriched for specific genetic alterations. J Clin Oncol 24:1924–1931. [DOI] [PubMed] [Google Scholar]
- 31. Zhukova N, Ramaswamy V, Remke M, Pfaff E, Shih DJ, Martin DC et al (2013) Subgroup‐specific prognostic implications of TP53 mutation in medulloblastoma. J Clin Oncol 31:2927–2935. [DOI] [PMC free article] [PubMed] [Google Scholar]