

Abstract
Accumulating evidence suggests that microRNAs (miRNAs) are over‐ or under‐expressed in tumors, and abnormalities in miRNA expression may contribute to carcinogenesis. MiR‐383 was previously identified as one of the under‐expresssed miRNAs in medulloblastoma (MB) by miRNA expression profiling. Quantitative reverse transcription polymerase chain reaction (RT‐PCR)‐based miRNA assays showed an enrichment of miR‐383 in normal brain. Based on these data, we speculated that miR‐383 is important in MB pathogenesis. In this study, we demonstrated significant downregulation of miR‐383 in 23/29 (79%) MB samples and 7/7 (100%) MB cells lines. Ectopic expression of miR‐383 in MB cells led to suppression of cell growth, cell accumulation at sub‐G1 phase and alteration of apoptosis‐related proteins. By transcriptomic analysis and computational algorithms, we identified peroxiredoxin 3 (PRDX3) as a target gene of miR‐383. Luciferase reporter assay confirmed that miR‐383 negatively regulated PRDX3 by interaction between miR‐383 and complementary sequences in the 3′ UTR of PRDX3. MiR‐383 repressed PRDX3 at transcriptional and translational levels as revealed by quantitative RT‐PCR and Western blot analysis. Furthermore, depletion of PRDX3 by siRNAs resulted in similar effects as observed in miR‐383‐transfected cells. In conclusion, miR‐383 acts as a regulator controlling cell growth of MB, at least in part, through targeting PRDX3.
Keywords: cell growth, medulloblastoma, microRNA, PRDX3
Introduction
Medulloblastoma (MB) is the most common brain tumor in children, though about 30% of MB tumors are found in adults 48. At present, risk stratification based on patient age, metastatic stage at diagnosis and extent of surgical resection, and pathological variants are the standard prognostic factors 14, 27, 41. With recent advances in multimodal treatment, the survival rate has significantly improved, but approximately one‐third of patients remain incurable because of recurrence or dissemination within the central nervous system (CNS) 36. Recent studies on transcriptional and DNA copy number profilings and mutation analysis have categorized different molecular subgroups with distinct clinical, demographic and biological features and this information vastly enhances the understanding of this disease 7, 24, 39, 53, 54. And, an increasingly comprehensive knowledge on the molecular pathogenesis of MB may lead to clues for the development of novel therapies.
MicroRNAs (miRNAs) are a group of endogenously expressed, small noncoding RNAs of ∼22–25 nucleotides (nts). They function to negatively regulate gene expression by complementary base‐pairing interactions between the miRNAs and usually the 3'UTRs of their target mRNAs to induce transcript degradation or translational repression 2. It has been estimated that miRNAs regulate more than one‐third of human genes 28. MiRNAs are involved in the regulation of diverse biological processes, including cell growth, apoptosis, metabolism and transformation 5, 35, 49. Accumulating evidence has suggested that miRNAs participate in carcinogenesis 37. Expression profilings have revealed that many miRNAs are under‐expressed in cancer samples compared to their corresponding normal tissues, while some are over‐expressed 34, 42, 56.
We speculated that aberrant miRNA expression might contribute to MB development. This is supported by several reports demonstrating that miRNAs are differentially expressed in MB and they are involved in controlling cell proliferation of MB cells. For example, we and others have found that miR‐124, a brain‐enriched miRNA, is under‐expressed in MB. Ectopic expression of miR‐124 results in suppression of cell proliferation of MB cells 29, 45. Another brain‐enriched miRNA, miR‐128a, is also downregulated in MB. Transfection of miR‐128a leads to reduction of cell growth and induction of senescence in MB cells 55.
Our objectives in this study are to determine expression profile of miR‐383 and delineate functional roles of miR‐383 in MB. We are particularly interested in the characterization of miR‐383 in MB for the following reasons. Global miRNA profiling revealed that expression of miR‐383 was under‐expressed in MB 13. Quantitative reverse transcription polymerase chain reaction (RT‐PCR) showed that miR‐383 was also preferably expressed in brain, suggesting a functional role in brain. Analysis of the dataset of Liang et al study, in which the expression of 345 miRNAs were studied in 40 normal tissues, revealed high abundance of miR‐383 in brain tissue 31. Normal brain tissue displayed the highest level of miR‐383 among all normal samples, and miR‐383 was absent in 34 normal tissues. The level of miR‐383 in the remaining five normal tissues with detectable miR‐383 expression was at least two times lower than that in normal brain. Taken together, we hypothesized that miR‐383 might be a critical player in MB pathogenesis. In the present study, we demonstrated that downregulation of miR‐383 is a common event in MB. Ectopic expression of miR‐383 resulted in cell growth suppression, alteration of cell cycle distribution, enhancement of apoptotic cells and change of apoptosis‐related proteins expression. We also identified peroxiredoxin 3 (PRDX3) as a target gene of miR‐383. Knockdown of PRDX3 led to results similar to restoration of miR‐383. Our findings enhance the understanding of MB development and provide further insight into the biological functions of miRNAs.
Materials and Methods
Tumor specimens
A total of 29 primary MBs were collected from Prince of Wales Hospital, Hong Kong, and Huashan Hospital, Shanghai. Tumor tissues were resected at the time of surgery and stored in the RNALater solution (Ambion, Inc., Austin, TX, USA) at −80°C until use. Histologic examination revealed that the RNALater‐preserved samples had tumor cell content greater than 80%. All tumors were classified according to current World Health Organization (WHO) criteria 15. There were 25 classic MB, three desmoplastic MB and one anaplastic MB. The samples comprised 23 pediatric and six adult patients. The median age for the pediatric group was 10 years (range, 5–17 years) and for adult group 28 years (range, 20–40 years). The male/female ratio was 1.6:1. Clinicopathological information of the patients is summarized in Table 1.
Table 1.
Clinicopathological features of 29 medulloblastomas (MB).
| Case no. | Age (year) | Sex | Ki‐67 (%) | |
|---|---|---|---|---|
| Classic MB | ||||
| 1 | 4 | M | 31 | |
| 2 | 5 | M | 39 | |
| 3 | 7 | M | 15 | |
| 4 | 8 | F | 35 | |
| 5 | 9 | M | 29 | |
| 6 | 10 | M | nd | |
| 7 | 10 | F | 12 | |
| 8 | 10 | M | 38 | |
| 9 | 10 | M | 22 | |
| 10 | 11 | M | 25 | |
| 11 | 12 | M | 12 | |
| 12 | 12 | M | 19 | |
| 13 | 13 | M | 16 | |
| 14 | 14 | F | 36 | |
| 15 | 14 | F | 23 | |
| 16 | 14 | F | 13 | |
| 17 | 16 | M | 8 | |
| 18 | 16 | M | 28 | |
| 19 | 17 | M | 11 | |
| 20 | 20 | F | 29 | |
| 21 | 22 | M | 17 | |
| 22 | 24 | M | 35 | |
| 23 | 32 | F | 30 | |
| 24 | 36 | F | 25 | |
| 25 | 40 | M | 12 | |
| Desmoplastic MB | ||||
| 26 | 9 | M | 10 | |
| 27 | 10 | F | 24 | |
| 28 | 16 | F | 6 | |
| Anaplastic MB | ||||
| 29 | 5 | F | 41 |
nd = not determined.
Cell lines
DAOY, D283 and D341 were obtained from American Type Culture Collection (Manassas, VA, USA). D384, D425 and D458 were generous a gift from Dr. Darrell Bigner (Department of Pathology, Duke University, Durham, NC, USA). ONS‐76 was purchased from Japanese Cancer Research Resources Bank. All cell lines were grown in recommended media.
TaqMan miRNA assay
The stem‐loop RT‐based TaqMan miRNA assay (Applied Biosystems, Foster City, CA, USA) was applied to evaluate expression of mature miR‐383 according to manufacturer's recommendation. The RT reaction was prepared in a final volume of 15 μL containing 10 ng of total RNA extracted by Trizol, 1 × miR‐383‐specific reverse transcription primer, 1 × reverse transcription buffer, 1 mM dNTPs, 50 units of MultiScribe™ reverse transcriptase and 3.8 units of RNase inhibitor. Reaction mixture was incubated at 16°C for 30 minutes, 42°C for 30 minutes, and 85°C for 5 minutes. Quantitative PCR was performed in a 20 μL volume containing 1/15 of the reversed transcribed product, 1 × TaqMan Universal PCR master mix and 1 × TaqMan miRNA assay reagent. Amplification was conducted under the conditions of 95°C for 10 minutes, followed by 40 cycles of 95°C for 15 s, and 60°C for 1 minute on 7900HT Fast Real‐Time PCR System (Applied Biosystems). Standard curves for miR‐383 and internal control gene (GAPDH) were generated to assess copy number. Expression of miR‐383 in each sample was calculated as a ratio of copy number of miR‐383 to copy number of GAPDH. The relative miR‐383 expression in MB samples was then calculated by comparison to the average of controls, which was set to 1. All PCR reactions were performed in triplicates. RNAs of three normal cerebella served as controls, and they were obtained from Ambion, Clontech Laboratories Inc. (Palo Alto, CA, USA) and Biochain Institute, Inc. (Hayward, CA, USA).
Quantitative RT‐PCR
Real time RT‐PCR was done to measure the expression of PRDX3. cDNA was reverse transcribed from 1 μg RNA in a reaction contained MultiScribe reverse transcriptase and random hexamers as described by manufacturer (Applied Biosystems). Amplification was carried out in a reaction mixture contained 30 ng cDNA, 1 × TaqMan Universal PCR master mix and the commercially available PRDX3 (Hs00428953_g1) or GAPDH (Hs99999905_m1) probes and primers (Applied Biosystems). Standard curves were generated to evaluate the copy number of PRDX3 and GAPDH. Expression of PRDX3 was normalized to GAPDH.
Transient transfection of miRNAs
To elucidate the biological functions of miR‐383, hsa‐miR‐383 Pre‐miR™ miRNA Precursor (miR‐383; Ambion) or miRNA Mimic Negative Control (negative control; Ambion) was delivered in MB cells. Cells were plated sub‐confluently 24 h prior to transfection. A mixture of miR‐383 or negative control diluted in Opti‐MEM I (Invitrogen, Carlsbad, CA, USA) and Lipofectamine™ 2000 (Invitrogen) was transfected into MB cells. To optimize the transfection condition, a FAM™ dye‐labeled Pre‐miR™ Negative Control (Ambion) was used. Cells were transfected with different ratios of FAM™ dye‐labeled Pre‐miR™ Negative Controls and Lipofectamine™ 2000. Conditions resulting in >85% transfected cells showing fluorescence under a fluorescent microscope were selected for subsequent functional studies.
RNA interference transfection
Knockdown of PRDX3 was performed using two Silencer® Select Validated siRNAs (Ambion): siPRDX3‐1 and siPRDX3‐3 which specifically target exons 4 and 5 of PRDX3 respectively. The sequences of siRNAs were as followed: siPRDX3‐1 sense strand, 5′‐GUGACAAAGCUAACGAAUU‐3′; siPRDX3‐1 antisense strand, 5′‐AAUUCGUUAGCUUUGUCAC‐3′; siPRDX3‐3 sense strand, 5′‐GUGACAAAGCUAACGAAUU‐3′; and siPRDX3‐3 antisense strand, 5′‐UUAAGUCUGACAAGAGUGC‐3′. The Silencer® Select siRNA Negative Control (Ambion), which showed minimal sequence identical to human gene sequence, was used as a control. Transfection of siRNAs was performed by Lipofectamine™ 2000 (Invitrogen).
Cell viability count
Cell viability was examined by trypan blue dye exclusion assay. MB cells were harvested by trypsinization, stained with 0.4% (w/v) trypan blue, and counted with a hemocytometer. Assay was done in four consecutive days. The experiments were repeated three times.
Cell cycle distribution
Cells were transfected with miR‐383 or negative control. At 48 h after transfection, cells were collected, washed with phosphate‐buffered saline (PBS), fixed in cold 70% ethanol at −20°C overnight and treated with PBS containing 20 μg/mL propidium iodide (PI; Sigma‐Aldrich, St Louis, MO, USA) and 200 μg/mL DNase‐free RNase A (Sigma‐Aldrich) in the dark for 30 minutes. After passing through the 40 μm strainer, cells were subjected to cell cycle profiling using FACSCalibur (Becton Dickinson, San Jose, CA, USA). The percentage of cells in different phases of cell cycle was determined by Cell Quest version 3.2 software (Verity 214 Software House, Topsham, ME, USA).
Apoptosis assay
Apoptosis was determined by Annexin‐V‐FLUOS Staining Kit (Roche Applied Science) according to the manufacturer's instructions. Briefly, miR‐383‐ or negative control‐transfected cells were harvested and washed with PBS at 48 h after transfection. Cells were then incubated with annexin V and PI for 15 min at room temperature. The stained cells were quantified by a fluorescence‐activated cell sorter. In total, 30 000 cells were acquired. Early apoptotic cells were positive for annexin V but not PI. Late apoptotic cells were positive for annexin V and PI. The experiments were repeated three times.
5‐aza‐2′‐deoxycytidine (5‐aza‐dC) and trichostatin A (TSA) treatment
5‐aza‐dC (Sigma‐Aldrich) and TSA (Sigma‐Aldrich) were dissolved in dimethyl sulfoxide (DMSO), and stored at −80°C until used. For 5‐aza‐dC treatment, DAOY and D458 cells were incubated at a concentration of 1.0, 2.5 or 5.0 μM for 5 days. For a combination of 5‐aza‐dC and TSA treatment, 5‐aza‐dC was added for 5 days and 300 nM TSA was then given for an additional of 24 h. Fresh media containing the drugs were changed every 24 h. Control cells were treated with 0.1% DMSO. The experiment was repeated three times.
Sodium bisulfite DNA sequencing of SGCZ
Genomic DNA extracted from of a normal cerebellum and seven MB cell lines (DAOY, ONS‐76, D283, D341, D384, D425 and D458) was modified by sodium bisulfite using Methylamp™ One‐step DNA modification kit (Epigentek, Brooklyn, NY, USA) according to the manufacturer's instructions. The bisulfite modified DNA was then amplified using two pairs of primers to investigate methylation status of CpG island on SGCZ gene. One fragment covering 26 CpG sites (320 bp) was amplified by forward primer 5′‐GTAGTATTTGGGGTGTAGATTTTG‐3′ and reverse primer 5′‐CTCCAACCCCTACACTACAA‐3′. The other PCR fragment (325 bp) covering 35 CpG sites was amplified by forward primer 5′‐GAATTTGGATATTGAGGAGTTTAAGG‐3′ and reverse primer 5′‐CAAAATCTACACCCCAAATACTACC‐3′. PCR amplification products were cloned into the pCR®2.1‐TOPO vector (Invitrogen). Five colonies of each sample were picked and plasmid DNA was prepared using DNA‐spin™ Plasmid DNA Purification Kit (iNtRON Biotechnology, Inc., Kyungki‐Do, Korea). DNA sequencing reaction was carried out by BigDye® Terminator v1.1 Cycle Sequencing Kit (Applied Biosystems) and DNA sequencing analysis was performed on Genetic Analyzer 3130xl (Applied Biosystems).
Western blot analysis
Cells were washed with ice‐cold PBS, lysed in RIPA buffer containing 50 mM Tris‐HCl pH 7.4, 150 mM NaCl, 1% Triton X‐100, 1% sodium deoxycholate, 0.1% SDS and 1X protease inhibitor mix and incubated on ice. Total protein lysates with cleared of debris were obtained by centrifugation. Protein concentration was determined by the Protein Assay (Bio‐Rad, Hercules, CA, USA). Soluble proteins were resolved by SDS‐polyacrylamide gel electrophoresis and transferred to PDVF membrane. The blot was blocked with 5% non‐fat milk, incubated with anti‐human PRDX3 polyclonal antibody 4G10 (Abcam, Cambridge, UK) at 0.5 μg/mL, anti‐human cleaved PARP polyclonal antibody D214 (Cell Signaling Technology, Danvers, MA, USA) at 0.5 μg/mL, anti‐human BCL‐XL monoclonal antibody 2H12 (Invitrogen) at 0.5 μg/mL, anti‐human BCL‐2 monoclonal antibody (Invitrogen) at 0.5 μg/mL or anti‐human GAPDH monoclonal antibody (Abcam) at 0.2 μg/mL. Proteins were visualized with appropriate horseradish peroxidase‐conjugated secondary antibody and Immobilon™ Western Chemiluminescent HRP substrate Western blotting reagent (Millipore, Billerica, MA, USA).
Luciferase reporter plasmids construct
To prepare reporter plasmid for PRDX3, a partial 3′ UTR fragment of PRDX3 (319 bp), corresponding to +1124 to +1442 of human mRNA sequence (NM_006793.2), was amplified with primers containing XbaI linker using genomic DNA. The forward primer sequence was 5′‐GATCTAGAGCCTTACTTGAATCTTGCC‐3′ and the reverse primer was 5′‐TCTAGAAATATACATAGACAAAGT‐3′. Restriction site XbaI (underlined) was included for cloning purpose. PCR product was then cloned into pCR2.1‐TOPO vector (Invitrogen). The 3'UTR fragment was released from the plasmid and subcloned into the unique XbaI site downstream of the firefly luciferase gene in pGL3‐control reporter vector (Promega, Madison, WI, USA). The resultant plasmid was termed pGL3‐PRDX3. To generate a control plasmid, pGL3‐MUT PRDX3, a 7‐bp mutation at the putative binding site was introduced by Gene‐Tailor site‐directed mutagenesis system (Invitrogen). DNA sequencing and restriction enzyme digestion were performed to verify plasmid sequences.
Luciferase reporter assay
Cells were co‐transfected in 24‐well plate with 1 μg of pGL3‐PRDX3 or pGL3‐MUT PRDX3 reporter plasmid, 20 pmol of miR‐383 or negative control, and 200 ng of pRL‐TK plasmid (Renilla) using Lipofectamine™ 2000. Luciferase activity was measured by Dual‐Glo® luciferase Reporter Assay System (Promega) at 48 h post‐transfection. Transfection efficiency was corrected by normalizing the firefly luciferase activity to that of Renilla. Each experiment was performed in triplicate and repeated three times.
Statistical analysis
Statistical analysis was performed using the software SPSS 16.0 (SPSS, Inc., Chicago, IL, USA). Correlation between molecular and clinicopathological parameters was evaluated by Student's t‐test or Fisher's exact test. Statistical comparisons were based on Student's t‐test. All obtained P‐values were two sided, and P < 0.05 was considered statistically significant.
Results
miR‐383 is downregulated in MB
We first applied quantitative stem‐loop RT‐PCR to study miR‐383 expression in a cohort of 29 MB samples. As illustrated in Figure 1, 23/29 (79%) tumors displayed significant downregulation of miR‐383 by at least twofold (P < 0.05) compared with the mean expression level of three normal cerebella. A total of 10 tumors had the expression level decreased by >10‐fold compared with the mean of three normal cerebella. Three tumors exhibited no detectable miR‐383 transcripts and all were pediatric cases. We also measured miR‐383 expression in a panel of seven MB cell lines. No detectable miR‐383 transcript was observed in 6/7 MB cell lines, and ONS‐76 cells exhibited a 43‐fold reduced miR‐383 expression compared with the average of normal cerebella. Statistical analysis showed no significant association between miR‐383 expression level and patient age (childhood vs. adult), gender, Ki‐67 proliferation index or histologic subtypes.
Figure 1.
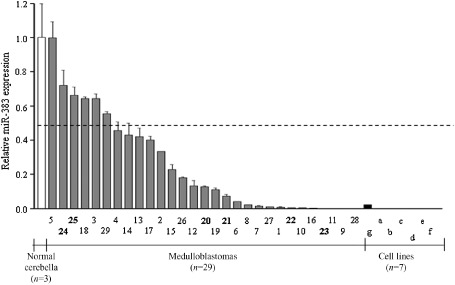
Downregulation of miR‐383 in MB. Expression of miR‐383 was quantified by stem‐loop RT‐PCR in 29 primary MBs (gray bar), seven cell lines (black bar) and three normal cerebella (white bar). GAPDH was used as a loading control. A total of 23 (79%) MB displayed at least twofold decreased miR‐383 expression compared to the average of three normal cerebella (P < 0.05). The number below the figure represents case number with bold indicates adult case. Small letters indicate cell lines: a, D425; b, D458; c, D283; d, D384; e, D341; f, DAOY; g, ONS‐76. The dashed line represents twofold cutoff.
Ectopic expression of miR‐383 inhibited cell growth of MB cells in vitro
To investigate the effects of miR‐383 in MB, four MB cell lines were transiently transfected with synthetic miR‐383 precursor (miR‐383) or negative control. These oligonucleotides are designed to mimic endogenous miR‐383. The effect on cell number was assessed by trypan blue exclusion assay for four consecutive days. A reduction in cell number was observed at 24 h after transfection, and the differences in cell number between miR‐383‐transfected cells and negative control‐transfected cells reached statistically significance starting from 48 h post‐transfection (Figure 2). At 48 h post‐transfection, miR‐383 transfection led to a significant decrease in cell number by 39.3% in DAOY, 53.5% in ONS‐76, 21.6% in D283 and 19.4% in D458 compared to their negative controls. A significant decrease in cell number persisted through 96 h. Restoration of miR‐383 led to reduction in cell number by 66.0% in DAOY, 75.8% in ONS‐76, 45.9% in D283 and 45.6% in D458 cells at 96 h post‐transfection. No statistically significant difference in cell viability was observed between negative control and mock cells. The results suggest that miR‐383 inhibits cell growth and plays an important role in regulating MB cell growth.
Figure 2.
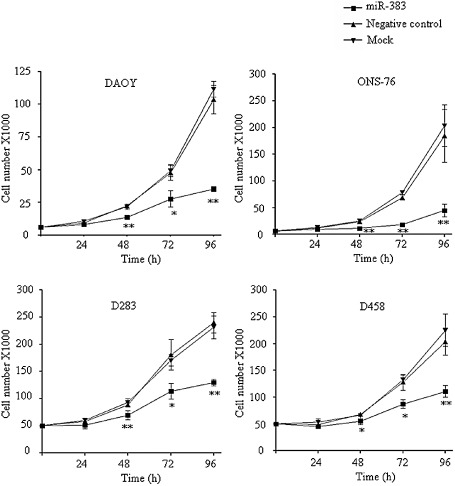
Growth suppressive effects of miR‐383 in MB cells. Four MB cells were transfected with miR‐383 precursor (miR‐383) or negative control. The effect on cell growth was evaluated by trypan blue exclusion assay for four consecutive days. Ectopic expression of miR‐383 resulted in a significant decrease in viable cell number at 48 h and onward. The data are expressed as mean cell number ± SD from three separate experiments. *P < 0.05; **P < 0.01.
miR‐383 altered cell cycle distribution
To explore the mechanism of growth inhibition by miR‐383, we conducted flow cytometry to measure the effect of miR‐383 on cell cycle progression. D283 and D458 cells were transfected with miR‐383 or negative control. Cells were harvested at 48 h and stained with PI. DNA content analysis revealed that miR‐383 expression in both cell lines led to a significant accumulation of cells in sub‐G1 phase at the expense of a decrease in the population of cells in G2/M phase (Figure 3). The population of cells at sub‐G1 phase in miR‐383‐transfected D283 cells was increased by 1.9‐fold (7.5 ± 0.3 vs. 14.3 ± 1.9) compared with that in negative control‐transfected cells. Similarly, compared with negative control‐transfected cells, miR‐383 expression in D458 cells led to a 3.5‐fold (3.5 ± 0.3 vs. 12.2 ± 1.2) increase in sub‐G1 population. The enhancement of sub‐G1 fraction suggests that induction of apoptosis contributes to miR‐383‐induced cell growth suppression in MB cells.
Figure 3.
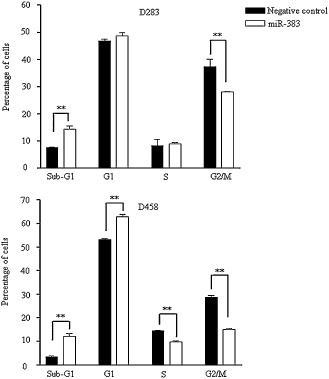
Induction of sub‐G1 accumulation by miR‐383. D283 (top) and D458 (bottom) cells were transfected with miR‐383 or negative control. Cells were harvested at 48 h and subjected to PI staining. DNA contents of cells were measured by flow cytometry. Restoration of miR‐383 led to significant increase in sub‐G1 population at the expense of a decrease in G2/M population. The results represent the mean ± SD of three independent experiments. **P < 0.01.
miR‐383 promoted apoptosis
To further confirm the involvement of apoptosis in miR‐383‐induced growth inhibition in MB, we conducted an apoptosis assay using annexin V and PI staining. D283 and D458 cells were transfected with miR‐383 or negative control, and apoptotic cells were measured at 48 h. As shown in Figure 4, the percentage of apoptotic cells in miR‐383‐transfected D283 cells was increased by 3.9‐ fold (6.2 ± 2.8 vs. 24.4 ± 4.7) compared with negative control‐transfected cells. In D458 cells, miR‐383 transfection led to an increase of percentage of apoptotic cells by 2.7‐fold (6.9 ± 0.4 vs. 19.0 ± 2.8).
Figure 4.
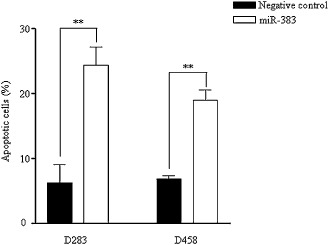
Increase of apoptotic cells in miR‐383‐transfected cells. D283 and D458 cells were transfected with miR‐383 or negative control. Transfected cells were collected at 48 h and subjected to annexin V‐FITC and PI staining. Stained cells were measured by flow cytometry. The bars represent the percentage of apoptotic cells. The data are the average of three independent experiments. **P < 0.01.
miR‐383 induced apoptosis‐related proteins
We also applied Western blotting to examine genes involved in the apoptotic pathway. Cleaved poly(ADP‐ribose) polymerase (PARP), BCL‐XL and BCL‐2 are important players in the apoptosis processing. Cleaved PARP is generally used as a marker for apoptosis processing, and BCL‐XL and BCL‐2 are anti‐apoptotic members of the Bcl‐2 family. MB cells were subjected to miR‐383 or negative control transfection, and cell lysates were harvested at 48 h. The results revealed that miR‐383 restoration in ONS‐76, D283 and D458 cells triggered a substantial upregulation of cleaved PARP (Figure 5). We also observed that restoration of miR‐383 led to a decreased expression of BCL‐XL and/ or BCL‐2 in MB cells (Figure 5). Noticeable reduction in BCL‐XL protein appeared in DAOY, D283 and D458 cells, with ONS‐76 cells showing limited effect. In addition, downregulation of BCL‐2 was noticed in DAOY, ONS‐76 and D283 cells. Taken together, the results further argue for the involvement of apoptosis in miR‐383‐induced cell growth inhibition in MB.
Figure 5.
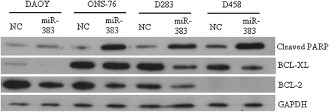
Changes in protein levels of apoptosis‐related genes in miR‐383‐transfected MB cells. Four MB cells were transfected with miR‐383 or negative control (NC). Cell lysates were harvested at 48 h post‐transfection. Expression of cleaved PARP, BCL‐XL and BCL‐2 was determined by Western blot analysis. GAPDH was served for internal control.
SCGZ was not hypermethylated in MB cell lines
MiR‐383 is an intronic miRNA, which residues in intron 1 of its host gene, SGCZ. A dense CpG island located near and at intron 1 of SGCZ was found using CpG Island Searcher Program (http://www.cpgislands.com) 52. Previous study has demonstrated that intronic miRNAs are frequently co‐expressed with their host genes, and suggested that intronic miRNA expression could be under the control of the promoter driving the host gene 3, 47. We speculated that hypermethylation of SGCZ would be a regulatory mechanism of miR‐383 expression. To investigate epigenetic factors contributed to miR‐383 expression, we first tested whether treatment of methyltransferase inhibitor and histone deacetylase inhibitor would restore miR‐383 expression in MB cell lines (as described in the Materials and Methods). DAOY and D458 cells were subjected to 5‐aza‐dC and TSA treatment for 5 days. Stem‐loop RT‐based PCR did not reveal an upregulation of miR‐383 in MB cells upon 5‐aza‐dC and TSA treatment (data not shown). Further bisulfite sequencing of SGCZ revealed rarely hypermethylation in a normal brain and seven MB cell lines (Supporting Figure S1). Taken together, the results suggested that epigenetic mechanism plays a minor role in regulation of miR‐383 expression.
Identification of miR‐383 targets
To identify potential target genes of miR‐383 that might contribute to cell growth in MB, we applied a combination of two approaches: bioinformatic prediction algorithms and microarray‐based gene expression analysis. First, the targets of miR‐383 predicted by three miRNA prediction softwares, namely PicTar (http://pictar.bio.nyu.edu/), TargetScan (http://genes.mit.edu/tscan/targetscanS.html) and Human microRNA Targets (http://www.microrna.org/) were retrieved. Genes that were predicted by at least two of these softwares were extracted. A total of 210 genes were found as candidate targets of miR‐383. To narrow down the number of target genes, miR‐383 was transiently transfected to ONS‐76 cells, and cells were harvested at 4 and 12 h post‐transfection. Alteration in mRNA transcripts was identified by global gene analysis. Compared with negative control cells, a total of 979 genes displayed >1.5‐fold downregulation in miR‐383‐transfected cells. However, only 23 of them were on the list of 210 refined putative targets of miR‐383. As we observed a growth inhibitory effect of miR‐383 in MB cells, we speculated that the targets genes of miR‐383 were functionally involved in cell growth, apoptosis or differentiation, and miR‐383 exerted its growth inhibitory effect in MB through negative regulation of its target genes. Thus, we further excluded four unknown genes and seven genes that were not implicated in tumorigenesis, anti‐apoptosis or differentiation. A final list of 12 candidate genes was generated.
Effect of miR‐383 on PRDX3 transcript in MB cells
It is known that miRNAs regulate mRNA transcript of its target genes 3, 32, 44. To address whether miR‐383 regulated any of these 12 candidate target genes, we transfected DAOY and ONS‐76 cells with miR‐383 and negative control, and transcript levels of these genes were monitored by quantitative RT‐PCR. As shown in Table 2, PRDX3 displayed the most decreased expression at 12 and 24 h upon restoration of miR‐383 in DAOY and ONS‐76. PRDX3 transcript level in miR‐383‐transfected DAOY cells was decreased by 6.5‐fold at 12 h compared with negative control‐transfected cells. Its expression was further suppressed at 24 h (9.8‐fold). ONS‐76 cells exhibited a more pronounced reduction of PRDX3 mRNA level upon miR‐383 restoration. The PRDX3 transcript in miR‐383‐transfected ONS‐76 cells was repressed by 11.3‐fold and 19.7‐fold at 12 h and 24 h, respectively. The result suggests that miR‐383 represses PRDX3 expression.
Table 2.
Expression changes of 12 potential miR‐383 target genes upon miR‐383 transfection. Abbreviation: RT‐PCR = reverse transcription polymerase chain reaction.
| Gene | Quantitative RT‐PCR | Microarray | ||||||||
|---|---|---|---|---|---|---|---|---|---|---|
| DAOY | ONS‐76 | ONS‐76 | ||||||||
| 12 h | 24 h | 12 h | 24 h | 4 h | 12 h | |||||
| Fold‐change | P‐value | Fold‐change | P‐value | Fold‐change | P‐value | Fold‐change | P‐value | Fold‐change | Fold‐change | |
| RBMSI | −2.8 | 2.1 × 10⁻⁵ | −4.6 | 4.7 × 10⁻⁶ | −3.7 | 1.5 × 10⁻³ | −5.7 | 1.6 × 10⁻³ | −1.9 | −3.3 |
| MAPKAP1 | −1.1 | 8.9 × 10⁻³ | −1.2 | 4.8 × 10⁻² | −1.2 | 4.5 × 10⁻² | −1.5 | 7.1 × 10⁻⁵ | 1 | −1.7 |
| CTNNAL1 | −1.7 | 3.9 × 10⁻² | −3.7 | 3.9 × 10⁻⁴ | −2.5 | 5.6 × 10⁻³ | −9.8 | 7.5 × 10⁻⁴ | 1 | −2.2 |
| PRDX3 | −6.5 | 6.5 × 10⁻⁶ | −9.8 | 1.6 × 10⁻³ | −11.3 | 7.4 × 10⁻⁵ | −19.7 | 3.0 × 10⁻⁴ | −1.3 | −6.6 |
| SLC35A3 | −1.7 | 4.2 × 10⁻² | −3.6 | 4.8 × 10⁻² | −1.9 | 3.8 × 10⁻² | −3.9 | 3.5 × 10⁻⁷ | −1.1 | −2.3 |
| PREI3 | −1.2 | 3.9 × 10⁻¹ | −3.2 | 2.4 × 10⁻⁴ | 1 | 1.2 × 10⁻¹ | −1.3 | 9.6 × 10⁻² | −1.4 | −2.2 |
| MAL2 | −2.6 | 1.3 × 10⁻⁴ | −3.5 | 1.0 × 10⁻⁵ | −2.0 | 7.3 × 10⁻⁴ | −2.6 | 7.2 × 10⁻⁴ | −1.2 | −2.5 |
| SCD | −1.1 | 9.2 × 10⁻² | −1.2 | 6.7 × 10⁻² | −1.7 | 8.6 × 10⁻² | −1.9 | 4.9 × 10⁻² | −1.2 | −1.9 |
| CNIH | −2.5 | 1.1 × 10⁻² | −3.5 | 3.2 × 10⁻³ | −2.6 | 1.7 × 10⁻² | −2.6 | 1.6 × 10⁻² | 1 | −1.8 |
| NCKAP1 | −1.1 | 1.6 × 10⁻² | −2.6 | 1.1 × 10⁻⁴ | −1.7 | 2.7 × 10⁻³ | −2.5 | 1.5 × 10⁻³ | −1.1 | −2.2 |
| SOX5 | −1.3 | 1.5 × 10⁻³ | −2.1 | 1.0 × 10⁻² | −2.0 | 1.7 × 10⁻² | −4.4 | 5.1 × 10⁻⁴ | −1.4 | −1.7 |
| STRN3 | −1.8 | 1.0 × 10⁻² | −2.5 | −4.6 × 10² | −1.6 | 1.1 × 10⁻² | −1.6 | 2.6 × 10⁻² | −1.3 | −1.6 |
Effect of miR‐383 on PRDX3 protein expression in MB cells
To further demonstrate PRDX3 regulation by miR‐383, we studied PRDX3 expression by Western blot analysis in seven MB cell lines. As illustrated in Figure 6, restoration of miR‐383 yielded a remarkable reduction in PRDX3 expression in all MB cells examined. PRDX3 expression was diminished to an undetectable level in D283, D341 and D458 cells upon miR‐383 transfection. Quantitative measurement of band intensity indicated that the amount of PRDX3 in miR‐383‐transfected cells was reduced by 5.5‐fold in DAOY, 1.5‐fold in ONS‐76, 4.3‐fold in D384 and 6.2‐fold in D425 compared with negative control‐transfected cells. The results were consistent with the findings observed in microarray and quantitative RT‐PCR experiments. Taken together, miR‐383 negatively regulates PRDX3 at both translational and post‐transcriptional levels.
Figure 6.
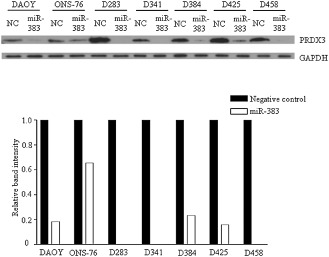
Downregulation of PRDX3 by miR‐383. (Top) Seven MB cells were subjected to miR‐383 or negative control (NC) transfection. Cell lysates were harvested at 48 h post‐transfection. PRDX3 expression was analyzed by immunoblotting. GAPDH served as an internal control. (Bottom) The bar graph represents the relative PRDX3 band intensity. It was calculated as a ratio of PRDX3 and GAPDH, and the negative controls were set to 1. ImageJ software was used for quantification.
PRDX3 is a direct‐target miR‐383
Computational prediction algorithm identifies the existence of a perfect complementarity between the 3'UTR of PRDX3 and nucleotides 2–10 of the mature miR‐383, which includes the seed region (nt 2–8), as shown in Figure 7. The conserved 7‐bp “seed” sequence is well conserved across six different species (Figure 7). To validate that the repression of PRDX3 by miR‐383 was caused by direct miR‐383/PRDX3 3'UTR interaction, we generated a luciferase reporter plasmid containing 3'UTR of PRDX3 (pGL3‐PRDX3). As control, we prepared a mutant reporter plasmid, in which the predicted 7‐bp “seed” binding region on the 3'UTR of PRDX3 was mutated (pGL3‐MUT PRDX3). The reporter plasmids were co‐transfected with either miR‐383 or negative control in DAOY and ONS‐76 cells. Luciferase activity was measured 48 h post‐transfection. We observed that miR‐383 led to a significant repression in luciferase activity of wild‐type pGL3‐PRDX3 by 71.0% in DAOY and by 44.8% in ONS‐76, when compared with negative control (Figure 7). Such suppression induced by miR‐383 was abolished when the transfection was replaced by the mutant reporter plasmid (pGL3‐MUT PRDX3). The results provide evidence that miR‐383 targets PRDX3 via interaction between the PRDX3 3'UTR and miR‐383.
Figure 7.
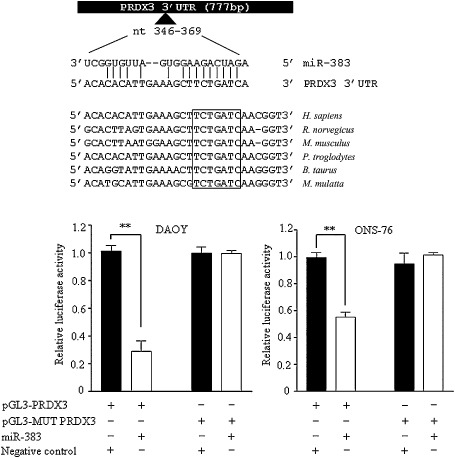
PRDX3 is a direct target gene of miR‐383. (Top) A schematic diagram showing the predicted miR‐383 binding site on PRDX3 3'UTR. The nucleotide after the stop codon is defined as “1” on PRDX3 3'UTR. The potential miR‐383 binding site residues at nts 346–369 of PRDX3 3'UTR. A perfect complementary base pairing is observed at the seed region of miR‐383 and sequences on PRDX3 3'UTR. This miR‐383/PRDX3 3'UTR base pairing is conserved across six species, as indicated by the box. (Bottom) Luciferase reporter assay demonstrated that miR‐383 directly interacted with PRDX3 3'UTR. DAOY cells (left) and ONS‐76 cells (right) were co‐transfected with wild‐type PRDX3 3'UTR (pGL3‐PRDX3) or mutant PRDX3 3'UTR (pGL3‐MUT PRDX3) luciferase reporter plasmid as well as miR‐383 or negative control. Luciferase activity was measured at 48 h post‐transfection. Data represent the firefly luciferase activity standardized with Renilla luciferase activity.
PRDX3 is overexpressed in MB
To explore whether PRDX3 was dysregulated in MB, quantitative RT‐PCR was conducted to examine PRDX3 transcript level in the same cohort of MB samples. PRDX3 expression was significantly upregulated in our cohort of MB samples compared with the mean of normal cerebella (P = 0.0465; Figure 8). An inverse pattern between miR‐383 and PRDX3 expression in MB provides additional support to suggest that miR‐383 negatively regulates PRDX3.
Figure 8.
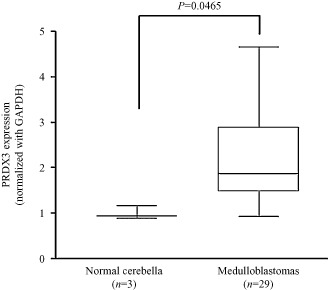
Upregulation of PRDX3 in MB. PRDX3 mRNA transcript was quantified by quantitative RT‐PCR in 29 MB samples. PRDX3 is significantly upregulated in MB compared with the average of normal cerebella (P = 0.0465). PRDX3 expression was normalized to an internal control, GAPDH.
Knockdown of PRDX3‐induced cell growth inhibition and increased PARP cleavage
We hypothesized that depletion of PRDX3 would mimic the phenotypic effect of miR‐383 in MB. Four MB cell lines were transfected with two siRNAs (siPRDX3‐1 and siPRDX3‐3) that specifically target PRDX3. Quantitative RT‐PCR and immunoblot analysis confirmed the two siRNAs would effectively downregulate expression of PRDX3 in the four cell lines examined (Supporting Information Figure S2). The effect of PRDX3 depletion was measured by viable cell counting in consecutive four days. PRDX3 abrogation led to significant cell growth inhibition in MB cells (Figure 9). In contrast, no apparent change in cell number was observed between cells subjected to negative control and mock transfection, indicating a minimal effect of negative control on cell growth of MB cells. Significant growth inhibition effect was observed as early as 48 h post‐transfection in PRDX3‐depleted ONS‐76 and this was sustained for 96 h (Figure 9). Compared to negative control‐transfected ONS‐76 cells, cell number at 48 h was reduced by 57.1% in siPRDX3‐1 and 35.7% in siPRDX3‐3 transfected ONS‐76 cells. Depletion of PRDX3 resulted in a significant decrease of cell growth of DAOY, D283 and D458 cells at 72 h and onward. At 72 h post‐transfection, knockdown PRDX3 by siPRDX3‐1 reduced cell number by 24.1% in DAOY, 39.3% in D283 and 24.5% in D458 compared with their negative control cells. At the same time, cell viability by siPRDX3‐3 was decreased by 13.6% in DAOY, 22.0% in D283 and 21.8% in D458. A trend showing that siPRDX3‐1 exerted a more prominent growth inhibitory effect than that of siPRDX3‐3 in four MB cell lines was observed. The effect of PRDX3 depletion on cleaved PARP protein expression was revealed by Western blotting. At 96 h post‐transfection, PRDX3‐depleted MB cells displayed upregulation of PARP cleavage compared to their respective negative control cells (Figure 10). These data suggest that promotion of apoptosis is a mechanism for cell growth suppression in PRDX3‐depleted cells. The outcomes of silencing PRDX3 were similar to restoration of miR‐383 in MB cells, suggesting that knockdown of PRDX3 by siRNAs recapitulates the effect of miR‐383 transfection, and that miR‐383‐mediated PRDX3 regulates cell growth in MB.
Figure 9.
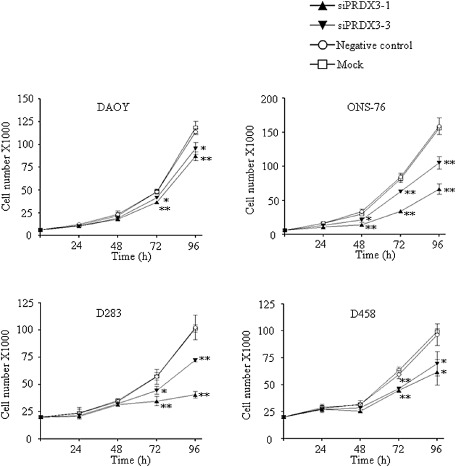
Growth inhibitory effects by transfection of siRNAs against PRDX3 in MB cells. Expression of PRDX3 was silenced in four MB cell lines by two PRDX3‐specific siRNAs, siPRDX3‐1 and siPRDX3‐3. The effect on cell growth was measured by trypan blue exclusion assay for four consecutive days. Viable cell number was significantly decreased in PRDX3‐depleted cells compared with negative control‐transfected cells. The data represent the mean ± SD of three individual experiments. *P < 0.05; **P < 0.01.
Figure 10.
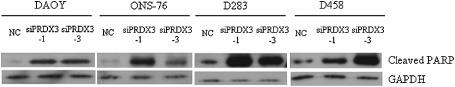
Upregulation of cleaved PARP in PRDX3 depleted MB cells. Two siRNAs against PRDX3 were delivered into four MB cell lines. A siRNA negative control (NC) was served as control. Cell lysates were collected at 96 h. The abundance of cleaved PARP was detected by Western blot analysis.
Discussion
MiRNAs have emerged as an important class of regulators in controlling gene expression. Aberrant expression of microRNAs either over or under‐expression has been identified in cancers 19. Recent studies have even attempted to exploit the potential use of miRNAs as therapeutic targets in cancers 8, 11, 12, 26, 40, 57. In the present study, we described that miR‐383 was significantly under‐expressed in 79% of MB tumors and 100% MB cell lines examined. The results strongly suggest that aberrant miR‐383 expression is a common event in MB and miR‐383 may be implicated in MB pathogenesis. Our findings are in line with Ferretti et al showing miR‐383 is downregulated in MB compared with normal cerebella by microarray analysis 13.
Furthermore, this is the first report on the functional consequences of miR‐383 restoration in MB. By viable cell counting, we reported that enforced miR‐383 expression induced cell growth inhibition, an observation that was consistently found in four different human MB cell lines. We found that the growth‐suppressive effect of miR‐383 had contributed to the induction of apoptosis as revealed by an increase in the fraction of sub‐G1 cells and an enhancement of annexin V‐stained cells. We applied Western blot analysis to evaluate expression of apoptosis‐related proteins, and we observed upregulation of PARP cleavage and downregulation of BCL‐2 and BCL‐XL. These findings further confirmed that expression of miR‐383 promoted apoptosis in MB. Our findings are consistent with Lian et al's study, which demonstrated miR‐383 expression suppressed cell proliferation and induced apoptosis in testicular embryonal carcinoma cells 30.
MiR‐383 is an intronic miRNA, located within the host gene, SGCZ. A dense CpG island is identified at intron 1 of SGCZ gene. A recent report suggests that miRNA and its host gene are regulated by DNA methylation 1. Thus, we have investigated the epigenetic regulation of miR‐383 in MB. Our results revealed that treatment of DNA methyltransferase inhibitor and histone deacetylase inhibitor in MB cells did not result in an induction of miR‐383 expression. DNA hypermethylation of SGCZ gene was not evident in all seven MB cell lines examined. These data indicated that epigenetic regulation is not the major mechanism in regulation of miR‐383. Further investigation is needed to delineate the underlying mechanisms of dysregulation of miR‐383.
Computational algorithm predicts that a miRNA regulates about 200 transcripts and each gene can be regulated by many miRNAs 25. Approximately 30% of the human genes are potentially regulated by miRNAs 28. In the second part of this study, we identified PRDX3 as a target gene of miR‐383. Luciferase reporter assay confirmed that miR‐383 specifically acted on the 3'UTR, via miR‐383 seed region, of PRDX3. Furthermore, we showed that mRNA and protein of PRDX3 were both markedly reduced upon miR‐383 restoration, supporting that miR‐383 negatively regulates PRDX3 at both transcription and translation levels.
PRDX3 is an isoform of peroxiredoxin 60. The main function of PRDX3 is to detoxify reactive oxygen species (ROS). A total of six mammalian peroxiredoxins are known, and each of them has an unique subcellular distribution 59. PRDX3 is strictly found in mitochondria 21, 59. Furthermore, PRDX3 showed a cell type‐specific expression pattern in murine brain with the presence of PRDX3 in neurons and the absence of PRDX3 in glial cells 16, 20.
As tumor cells are highly proliferative, they show an increased ROS production compared to normal cells 6, 51. Maintenance of precise physiological level of ROS is essential for cell and redox homeostases. An imbalance between ROS generation and its neutralization can lead to oxidative stress. It has been shown that excessive, high levels of ROS would induce cell death in brain and liver cancers 23, 33. We speculate that the level of PRDX3 needs to be increased in tumor cells in order to ensure the removal of high levels of toxic ROS generated during proliferation. Elevated PRDX3 expression has also been detected in breast, lung, liver and prostate cancers 9, 18, 22, 38, 43. In the present study, we found a significantly increased PRDX3 expression in MB tumors compared with normal cerebella. We propose that dysregulation of miR‐383 would be a possible mechanism for PRDX3 overexpression, allowing a balanced ROS level in MB cells. Nevertheless, we did not observe a strict inverse correlation between miR‐383 and PRDX3 transcript expression in individual MB samples. A likely explanation is that PRDX3 is regulated by multiple miRNAs. This is supported by computational prediction algorithms showing binding sites for miR‐23a, ‐29b, ‐26a, ‐181a, ‐186 and ‐224 on 3′ UTR of PRDX3. Indeed, a recent report demonstrated that miR‐23b targets PRDX3 in prostate cancer 18. Another possible explanation is that PRDX3 is regulated by multiple genes. MYC is known to target PRDX3 58.
In the last part of our study, we found that the biological effects of miR‐383 in MB cells could be mimicked by depletion of PRDX3. Knockdown PRDX3 by gene‐specific siRNAs impaired cell growth of MB cells and enhanced expression of cleaved PARP protein. Our findings suggest that PRDX3 plays a role in controlling cell growth of MB cells and provide further evidence that miR‐383 mediated PRDX3 in regulating cell growth.
Accumulative evidence has suggested a role of PRDX3 in neuronal survival and apoptosis, and this may shed a light on the functional importance of PRDX3 in MB tumorigenesis. PRDX3‐depleted cells were susceptible to apoptosis and neuron damage induced by oxidative injury 10. And, overexpression of PRDX3 has been shown to protect cells against neural cell death, arguing that PRDX3 could be a neuroprotective protein 17. Although the origin cells of MB remains a matter of debate, one central hypothesis is that MBs arise from granule neuron precursors (GNPs), progenitors that only give rise to granular neurons 46, 61. Many MBs express markers of GNP, such as ZIC and MATH1, and MBs often have features of neuronal lineage 50, 61, 62. Thus, it is reasonable to speculate that PRDX3 provides a survival benefit for MBs.
In summary, we have showed that miR‐383 is under‐expressed in MB. Restoration of miR‐383‐induced cell growth inhibition and promoted apoptosis. We confirmed that miR‐383 negatively regulated PRDX3 via direct interaction between seed region of miR‐383 and sequences on 3'UTR of PRDX3. Silencing PRDX3 resulted in similar outcomes as those of miR‐383 overexpression in MB cells, suggesting that the cell growth inhibitory effect of miR‐383 in MB cells was mediated at least partly by regulation of PRDX3 expression. Taken together, our data enhance the understanding of MB pathogenesis, and provide an insight to develop novel targets for effective treatment of MB.
Supporting information
Figure S1. Bisulfite sequencing analysis of CpG island of SGCZ. (Top) Schematic diagram showing the location of CpG island on SGCZ. Arrows indicate location of bisulfite sequencing primers along the gene. Numbers represent positions relative to transcription start site. (Bottom) Analyzed result of bisulfite sequencing of a normal brain and 7 MB cell lines. Each row represents a single clone, and each circle denotes to a CpG dinucleotide. A total of five clones were picked and sequenced for each sample. The percentage represents frequency of methylation. Open and closed circles represent unmethylated and methylated cytosine, respectively.
Figure S2. Effectiveness of PRDX3‐specific siRNAs. Four MB cell lines were transfected with siRNAs targeted PRDX3 exons 4 (siPRDX3‐1) and 5 (siPRDX3‐3). PRDX3 level was measured by quantitative RT‐PCR (top) and Western blot analysis (bottom). MB cells transfected with PRDX3‐specific siRNAs showed reduced PRDX3 expression at both mRNA and protein levels compared with cells transfected with negative control (NC). GAPDH was served as an internal control.
References
- 1. Augoff K, McCue B, Plow EF, Sossey‐Alaoui K (2012) miR‐31 and its host gene lncRNA LOC554202 are regulated by promoter hypermethylation in triple‐negative breast cancer. Mol Cancer 11:5. [DOI] [PMC free article] [PubMed] [Google Scholar]
- 2. Bartel DP (2009) MicroRNAs: target recognition and regulatory functions. Cell 136:215–233. [DOI] [PMC free article] [PubMed] [Google Scholar]
- 3. Baskerville S, Bartel DP (2005) Microarray profiling of microRNAs reveals frequent coexpression with neighboring miRNAs and host genes. RNA 11:241–247. [DOI] [PMC free article] [PubMed] [Google Scholar]
- 4. Bracken CP, Szubert JM, Mercer TR, Dinger ME, Thomson DW, Mattick JS et al (2011) Global analysis of the mammalian RNA degradome reveals widespread miRNA‐dependent and miRNA‐independent endonucleolytic cleavage. Nucleic Acids Res 39:5658–5668. [DOI] [PMC free article] [PubMed] [Google Scholar]
- 5. Brennecke J, Hipfner DR, Stark A, Russell RB, Cohen SM (2003) bantam encodes a developmentally regulated microRNA that controls cell proliferation and regulates the proapoptotic gene hid in Drosophila. Cell 113:25–36. [DOI] [PubMed] [Google Scholar]
- 6. Burdon RH (1995) Superoxide and hydrogen‐peroxide in relation to mammalian‐cell proliferation. Free Radic Biol Med 18:775–794. [DOI] [PubMed] [Google Scholar]
- 7. Cho YJ, Tsherniak A, Tamayo P, Santagata S, Ligon A, Greulich H et al (2011) Integrative genomic analysis of medulloblastoma identifies a molecular subgroup that drives poor clinical outcome. J Clin Oncol 29:1424–1430. [DOI] [PMC free article] [PubMed] [Google Scholar]
- 8. Cho WC (2012) Exploiting the therapeutic potential of microRNAs in human cancer. Expert Opin Ther Targets 16:345–350. [DOI] [PubMed] [Google Scholar]
- 9. Choi JH, Kim TN, Kim S, Baek SH, Kim JH, Lee SR, Kim JR (2002) Overexpression of mitochondrial thioredoxin reductase and peroxiredoxin III in hepatocellular carcinomas. Anticancer Res 22(6A):3331–3335. [PubMed] [Google Scholar]
- 10. De Simoni S, Goemaere J, Knoops B (2008) Silencing of peroxiredoxin 3 and peroxiredoxin 5 reveals the role of mitochondrial peroxiredoxins in the protection of human neuroblastoma SH‐SY5Y cells toward MPP+. Neurosci Lett 433:219–224. [DOI] [PubMed] [Google Scholar]
- 11. Dykxhoorn DM, Palliser D, Lieberman J (2006) The silent treatment: SiRNAs as small molecule drugs. Gene Ther 13:541–552. [DOI] [PubMed] [Google Scholar]
- 12. Ebert MS, Neilson JR, Sharp PA (2007) MicroRNA sponges: competitive inhibitors of small RNAs in mammalian cells. Nat Methods 4:721–726. [DOI] [PMC free article] [PubMed] [Google Scholar]
- 13. Ferretti E, De Smaele E, Po A, Di Marcotullio L, Tosi E, Espinola MS et al (2009) MicroRNA profiling in human medulloblastoma. Int J Cancer 124:568–577. [DOI] [PubMed] [Google Scholar]
- 14. Gajjar A, Hernan R, Kocak M, Fuller C, Lee Y, McKinnon PJ et al (2004) Clinical, histopathologic, and molecular markers of prognosis: toward a new disease risk stratification system for medulloblastoma. J Clin Oncol 22:984–993. [DOI] [PubMed] [Google Scholar]
- 15. Giangaspero F, Eberhart CG, Haapasalo H, Pietsch T, Wiestler OD, Ellison DW (2007) Medulloblastoma. In: WHO Classification of Tumours of the Central Nervous System, Louis DN, Ohgaki H, Wiestler OD, Cavenee WK (eds), pp. 132–140. IARC Press: Lyon. [Google Scholar]
- 16. Goemaere J, Knoops B (2012) Peroxiredoxin distribution in the mouse brain with emphasis on neuronal populations affected in neurodegenerative disorders. J Comp Neurol 520:258–280. [DOI] [PubMed] [Google Scholar]
- 17. Hattori F, Murayama N, Noshita T, Oikawa S (2003) Mitochondrial peroxiredoxin‐3 protects hippocampal neurons from excitotoxic injury in vivo. J Neurochem 86:860–868. [DOI] [PubMed] [Google Scholar]
- 18. He HC, Zhu JG, Chen XB, Chen SM, Han ZD, Dai QS et al (2012) MicroRNA‐23b downregulates peroxiredoxin III in human prostate cancer. FEBS Lett 586:2451–2458. [DOI] [PubMed] [Google Scholar]
- 19. Iorio MV, Croce CM (2009) MicroRNAs in cancer: small molecules with a huge impact. J Clin Oncol 27:5848–5856. [DOI] [PMC free article] [PubMed] [Google Scholar]
- 20. Jin MH, Lee YH, Kim JM, Sun HN, Moon EY, Shong MH et al (2005) Characterization of neural cell types expressing peroxiredoxins in mouse brain. Neurosci Lett 381:252–257. [DOI] [PubMed] [Google Scholar]
- 21. Kang SW, Chae HZ, Seo MS, Kim K, Baines IC, Rhee SG (1998) Mammalian peroxiredoxin isoforms can reduce hydrogen peroxide generated in response to growth factors and tumor necrosis factor‐alpha. J Biol Chem 273:6297–6302. [DOI] [PubMed] [Google Scholar]
- 22. Karihtala P, Mäntyniemi A, Kang SW, Kinnula VL, Soini Y (2003) Peroxiredoxins in breast carcinoma. Clin Cancer Res 9:3418–3424. [PubMed] [Google Scholar]
- 23. Kitamura Y, Ota T, Matsuoka Y, Tooyama I, Kimura H, Shimohama S et al (1999) Hydrogen peroxide‐induced apoptosis mediated by p53 protein in glial cells. Glia 25:154–164. [PubMed] [Google Scholar]
- 24. Kool M, Korshunov A, Remke M, Jones DT, Schlanstein M, Northcott PA et al (2012) Molecular subgroups of medulloblastoma: an international meta‐analysis of transcriptome, genetic aberrations, and clinical data of WNT, SHH, Group 3, and Group 4 medulloblastomas. Acta Neuropathol 123:473–484. [DOI] [PMC free article] [PubMed] [Google Scholar]
- 25. Krek A, Grün D, Poy MN, Wolf R, Rosenberg L, Epstein EJ et al (2005) Combinatorial microRNA target predictions. Nat Genet 37:495–500. [DOI] [PubMed] [Google Scholar]
- 26. Krützfeldt J, Rajewsky N, Braich R, Rajeev KG, Tuschl T, Manoharan M, Stoffel M (2005) Silencing of microRNAs in vivo with “antagomirs”. Nature 438:685–689. [DOI] [PubMed] [Google Scholar]
- 27. Lamont JM, McManamy CS, Pearson AD, Clifford SC, Ellison DW (2004) Combined histopathological and molecular cytogenetic stratification of medulloblastoma patients. Clin Cancer Res 10:5482–5493. [DOI] [PubMed] [Google Scholar]
- 28. Lewis BP, Burge CB, Bartel DP (2005) Conserved seed pairing, often flanked by adenosines, indicates that thousands of human genes are microRNA targets. Cell 120:15–20. [DOI] [PubMed] [Google Scholar]
- 29. Li KK, Pang JC, Ching AK, Wong CK, Kong X, Wang Y et al (2009) miR‐124 is frequently down‐regulated in medulloblastoma and is a negative regulator of SLC16A1. Hum Pathol 40:1234–1243. [DOI] [PubMed] [Google Scholar]
- 30. Lian J, Tian H, Liu L, Zhang XS, Li WQ, Deng YM et al (2010) Downregulation of microRNA‐383 is associated with male infertility and promotes testicular embryonal carcinoma cell proliferation by targeting IRF1. Cell Death Dis 1:e94. [DOI] [PMC free article] [PubMed] [Google Scholar]
- 31. Liang Y, Ridzon D, Wong L, Chen C (2007) Characterization of microRNA expression profiles in normal human tissues. BMC Genomics 8:166. [DOI] [PMC free article] [PubMed] [Google Scholar]
- 32. Lim LP, Lau NC, Garrett‐Engele P, Grimson A, Schelter JM, Castle J et al (2005) Microarray analysis shows that some microRNAs downregulate large numbers of target mRNAs. Nature 433:769–773. [DOI] [PubMed] [Google Scholar]
- 33. Lluis JM, von Llacuna L, Montfort C, Bárcena C, Enrich C, Morales A, Fernandez‐Checa JC (2009) GD3 synthase overexpression sensitizes hepatocarcinoma cells to hypoxia and reduces tumor growth by suppressing the cSrc/NF‐kappaB survival pathway. PLoS ONE 4:e8059. [DOI] [PMC free article] [PubMed] [Google Scholar]
- 34. Lu J, Getz G, Miska EA, Alvarez‐Saavedra E, Lamb J, Peck D et al (2005) MicroRNA expression profiles classify human cancers. Nature 435:834–838. [DOI] [PubMed] [Google Scholar]
- 35. Lu Z, Liu M, Stribinskis V, Klinge CM, Ramos KS, Colburn NH, Li Y (2008) MicroRNA‐21 promotes cell transformation by targeting the programmed cell death 4 gene. Oncogene 27:4373–4379. [DOI] [PMC free article] [PubMed] [Google Scholar]
- 36. Massimino M, Giangaspero F, Garrè ML, Gandola L, Poggi G, Biassoni V et al (2011) Childhood medulloblastoma. Crit Rev Oncol Hematol 79:65–83. [DOI] [PubMed] [Google Scholar]
- 37. Meltzer PS (2005) Cancer genomics: small RNAs with big impacts. Nature 435:745–746. [DOI] [PubMed] [Google Scholar]
- 38. Noh DY, Ahn SJ, Lee RA, Kim SW, Park IA, Chae HZ (2001) Overexpression of peroxiredoxin in human breast cancer. Anticancer Res 21(3B):2085–2090. [PubMed] [Google Scholar]
- 39. Northcott PA, Korshunov A, Witt H, Hielscher T, Eberhart CG, Mack S et al (2011) Medulloblastoma comprises four distinct molecular variants. J Clin Oncol 29:1408–1414. [DOI] [PMC free article] [PubMed] [Google Scholar]
- 40. Ørom UA, Kauppinen S, Lund AH (2006) LNA‐modified oligonucleotides mediate specific inhibition of microRNA function. Gene 372:137–141. [DOI] [PubMed] [Google Scholar]
- 41. Packer RJ, Rood BR, MacDonald TJ (2003) Medulloblastoma: present concepts of stratification into risk groups. Pediatr Neurosurg 39:60–67. [DOI] [PubMed] [Google Scholar]
- 42. Pang JC, Kwok WK, Chen Z, Ng HK (2009) Oncogenic role of microRNAs in brain tumors. Acta Neuropathol 117:599–611. [DOI] [PubMed] [Google Scholar]
- 43. Park JH, Kim YS, Lee HL, Shim JY, Lee KS, Oh YJ et al (2006) Expression of peroxiredoxin and thioredoxin in human lung cancer and paired normal lung. Respirology 11:269–275. [DOI] [PubMed] [Google Scholar]
- 44. Park SM, Gaur AB, Lengyel E, Peter ME (2008) The miR‐200 family determines the epithelial phenotype of cancer cells by targeting the E‐cadherin repressors ZEB1 and ZEB2. Genes Dev 22:894–907. [DOI] [PMC free article] [PubMed] [Google Scholar]
- 45. Pierson J, Hostager B, Fan R, Vibhakar R (2008) Regulation of cyclin dependent kinase 6 by microRNA 124 in medulloblastoma. J Neurooncol 90:1–7. [DOI] [PubMed] [Google Scholar]
- 46. Read TA, Hegedus B, Wechsler‐Reya R, Gutmann DH (2006) The neurobiology of neurooncology. Ann Neurol 60:3–11. [DOI] [PubMed] [Google Scholar]
- 47. Rodriguez A, Griffiths‐Jones S, Ashurst JL, Bradley A (2004) Identification of mammalian microRNA host genes and transcription units. Genome Res 14(10A):1902–1910. [DOI] [PMC free article] [PubMed] [Google Scholar]
- 48. Rossi A, Caracciolo V, Russo G, Reiss K, Giordano A (2008) Medulloblastoma: from molecular pathology to therapy. Clin Cancer Res 14:971–976. [DOI] [PMC free article] [PubMed] [Google Scholar]
- 49. Rottiers V, Näär AM (2012) MicroRNAs in metabolism and metabolic disorders. Nat Rev Mol Cell Biol 13:239–250. [DOI] [PMC free article] [PubMed] [Google Scholar]
- 50. Salsano E, Pollo B, Eoli M, Giordana MT, Finocchiaro G (2004) Expression of MATH1, a marker of cerebellar granule cell progenitors, identifies different medulloblastoma sub‐types. Neurosci Lett 370:180–185. [DOI] [PubMed] [Google Scholar]
- 51. Szatrowski TP, Nathan CF (1991) Production of large amounts of hydrogen peroxide by human tumor cells. Cancer Res 51:794–798. [PubMed] [Google Scholar]
- 52. Takai D, Jones PA (2003) The CpG island searcher: a new WWW resource. In Silico Biol 3:235–240. [PubMed] [Google Scholar]
- 53. Taylor MD, Northcott PA, Korshunov A, Remke M, Cho YJ, Clifford SC et al (2012) Molecular subgroups of medulloblastoma: the current consensus. Acta Neuropathol 123:465–472. [DOI] [PMC free article] [PubMed] [Google Scholar]
- 54. Thompson MC, Fuller C, Hogg TL, Dalton J, Finkelstein D, Lau CC et al (2006) Genomics identifies medulloblastoma subgroups that are enriched for specific genetic alterations. J Clin Oncol 24:1924–1931. [DOI] [PubMed] [Google Scholar]
- 55. Venkataraman S, Alimova I, Fan R, Harris P, Foreman N, Vibhakar R (2010) MicroRNA 128a increases intracellular ROS level by targeting Bmi‐1 and inhibits medulloblastoma cancer cell growth by promoting senescence. PLoS ONE 5:e10748. [DOI] [PMC free article] [PubMed] [Google Scholar]
- 56. Volinia S, Calin GA, Liu CG, Ambs S, Cimmino A, Petrocca F et al (2006) A microRNA expression signature of human solid tumors defines cancer gene targets. Proc Natl Acad Sci U S A 103:2257–2261. [DOI] [PMC free article] [PubMed] [Google Scholar]
- 57. Weiler J, Hunziker J, Hall J (2006) Anti‐miRNA oligonucleotides (AMOs): ammunition to target miRNAs implicated in human disease? Gene Ther 13:496–502. [DOI] [PubMed] [Google Scholar]
- 58. Wonsey DR, Zeller KI, Dang CV (2002) The c‐Myc target gene PRDX3 is required for mitochondrial homeostasis and neoplastic transformation. Proc Natl Acad Sci U S A 99:6649–6654. [DOI] [PMC free article] [PubMed] [Google Scholar]
- 59. Wood ZA, Schröder E, Robin Harris J, Poole LB (2003) Structure, mechanism and regulation of peroxiredoxins. Trends Biochem Sci 28:32–40. [DOI] [PubMed] [Google Scholar]
- 60. Yamamoto T, Matsui Y, Natori S, Obinata M (1989) Cloning of a housekeeping‐type gene (MER5) preferentially expressed in murine erythroleukemia cells. Gene 80:337–343. [DOI] [PubMed] [Google Scholar]
- 61. Yang ZJ, Ellis T, Markant SL, Read TA, Kessler JD, Bourboulas M et al (2008) Medulloblastoma can be initiated by deletion of patched in lineage‐restricted progenitors or stem cells. Cancer Cell 14:135–145. [DOI] [PMC free article] [PubMed] [Google Scholar]
- 62. Yokota N, Aruga J, Takai S, Yamada K, Hamazaki M, Iwase T et al (1996) Predominant expression of human zic in cerebellar granule cell lineage and medulloblastoma. Cancer Res 56:377–383. [PubMed] [Google Scholar]
Associated Data
This section collects any data citations, data availability statements, or supplementary materials included in this article.
Supplementary Materials
Figure S1. Bisulfite sequencing analysis of CpG island of SGCZ. (Top) Schematic diagram showing the location of CpG island on SGCZ. Arrows indicate location of bisulfite sequencing primers along the gene. Numbers represent positions relative to transcription start site. (Bottom) Analyzed result of bisulfite sequencing of a normal brain and 7 MB cell lines. Each row represents a single clone, and each circle denotes to a CpG dinucleotide. A total of five clones were picked and sequenced for each sample. The percentage represents frequency of methylation. Open and closed circles represent unmethylated and methylated cytosine, respectively.
Figure S2. Effectiveness of PRDX3‐specific siRNAs. Four MB cell lines were transfected with siRNAs targeted PRDX3 exons 4 (siPRDX3‐1) and 5 (siPRDX3‐3). PRDX3 level was measured by quantitative RT‐PCR (top) and Western blot analysis (bottom). MB cells transfected with PRDX3‐specific siRNAs showed reduced PRDX3 expression at both mRNA and protein levels compared with cells transfected with negative control (NC). GAPDH was served as an internal control.