

Abstract
Glioblastoma multiforme (GBM) is the most dramatic primary brain cancer with a very poor prognosis because of inevitable disease recurrence. The median overall survival is less than 1 year after diagnosis. Cancer stem cells have recently been disclosed in GBM. GBM stem‐like cells (GSCs) exhibit resistance to radio/chemotherapeutic treatments and are therefore considered to play an important role in disease recurrence. GSCs are thus appealing targets for new treatments for GBM patients. In this study, we show that GBM cells with stem cell characteristics are resistant to lysis mediated by resting natural killer (NK) cells because of the expression of MHC class I molecules. However, GSCs are killed by lectin‐activated NK cells. Furthermore, in experiments using the therapeutic antibody CetuximAb, we show that GSCs are sensitive to antibody‐mediated cytotoxicity. We confirm the sensitivity of GSC to cytotoxicity carried out by IL2‐activated NK cells and tumor‐specific T cells. More importantly, we show that GSCs are more sensitive to NK and T cell‐mediated lysis relatively to their corresponding serum‐cultured GBM cells obtained from the same initial tumor specimen. Altogether, these results demonstrate the sensitivity of GSC to immune cell cytotoxicity and, therefore, strongly suggest that GSCs are suitable target cells for immunotherapy of GBM patients.
Keywords: cancer stem cells, cell therapy, cytotoxic T cells, glioblastoma, NK cells
INTRODUCTION
Cancer stem‐like cells (CSCs), a rare population of self‐renewing cells within a tumor, were initially discovered in hematopoietic cancers 13, 42. Since their discovery, CSCs have been described in various solid cancers, including breast, brain, colon, lung, ovary, pancreas and prostate tumors 49, 52. It is now generally accepted that CSCs play an important role in tumorigenesis owing to their stem cell characteristics including self‐ renewal and ability to give rise to all the differentiated cell types found in the corresponding cancer. Because CSCs appear to resist conventional treatment 49, 52, 64, they are incriminated in metastatic spread and disease recurrence. The terminology used in the literature to describe tumor cells with stem‐like properties varies and has led to some confusion (ie, cancer maintaining, cancer propagating, cancer stem, tumor initiating and tumor stem‐like cells) 18, 28, 51. Some authors avoid CSC terminology, which suggests that these cells arise from stem cells, whereas their real origin remains to be fully described. CSCs do not necessary derive from normal stem cells; they can originate from progenitor cells or de‐differentiated cells 18, 37.
Human glioblastoma multiforme (GBM), World Health Organization (WHO) grade IV astrocytoma, is the most frequent primary brain tumor (30). Although standard treatment of GBM patients includes a multimodal approach with surgical resection of the tumor, radiation therapy and chemotherapy (57), prognosis remains very poor because of inevitably rapid disease recurrence. Less than 10% of GBM patients are still alive 5 years after diagnosis. Recently, it has been speculated that CSCs are responsible for this recurrence; several groups have demonstrated their presence in GBM specimens 25, 35, 55, 56, 75. In vitro, GBM stem‐like cells (GSC) exhibit properties of self‐renewal and differentiation into cells arising from the central nervous system, that is, astrocytic, oligodendrocytic or neural cells. Furthermore, in vivo, GSCs can reiterate the features of the native tumor's phenotype as demonstrated with immunodeficient mice models 25, 55, 56, 75. GSCs found within the tumor site can also be found in perivascular niches close to endothelial cells (15). They can migrate within the brain parenchyma far away from the initial tumor bulk (68). Furthermore, GSCs have shown resistance to both radiation and chemotherapy as currently used in the treatment of GBM patients 6, 11, 24, 44, although discrepancies have been reported 8, 46. Therefore, GSCs are now considered as important targets for new therapeutic approaches to cure GBM patients.
Cellular immunotherapy appears to be an attractive approach for GBM treatment 20, 23, 63, 69. Promising results have been shown using dendritic cells loaded with tumor antigens that initiate T‐cell‐mediated anti‐tumor immune response 19, 39, 43, 70, 71, 74. One of the new challenges of immunotherapy is to target GBM cells that remain after the conventional treatment, that is, GSC. This was outlined by the study described by Pellegatta et al. In a mouse model, GL261‐derived GSC‐loaded dendritic cells protect more efficiently mice against GBM challenge compared with dendritic cells loaded with serum‐cultured GL261 cells (50). However, one key point that needs to be addressed is to determine whether the cell cytotoxicity mediated by immune effector cells such as human natural killer (NK) and T cells affects GSC. Recent increasing literature addresses this issue. GSCs are resistant to allogeneic resting NK cell lysis but are killed by allogeneic and autologous IL2‐activated NK cells 17, 66. However, GSCs expressing the SOX6 and Her2 antigens are sensitive to lysis mediated by SOX6‐ and Her2‐specific T cells, respectively 1, 58. In an infection model, cytomegalovirus (CMV) peptide‐loaded GSCs and their corresponding serum‐differentiated cells, as well as GSCs expressing endogenous CMV antigens, are killed by CMV peptide‐specific T cells (14). Furthermore, in line with the results of a mouse model reported by Pellegatta et al (50), human GSCs can induce autologous tumor‐specific T cell responses, that is, IFNγ production and cell cytotoxicity against themselves and their peer of serum‐cultured GBM cells, underlining their potential immunogenicity (21).
In this study, we analyze the human GSC sensitivity to NK and T cell cytotoxicity. We show that GSCs are resistant to NK because of the expression of HLA class I molecules. This resistance can be overcome by blocking MHC class I molecules or by increasing the activation of resting NK cells with lectins. Furthermore, we demonstrate for the first time that GSCs are sensitive to antibody‐dependent cytotoxicity (ADCC) mediated by NK cells using the therapeutic anti‐EGFR antibody CetuximAb. We also confirm that GSCs are sensitive to LAK and tumor‐specific T cell cytotoxicity. More importantly, we show that GSCs are more sensitive to resting and IL2‐activated NK and T cell lysis compared with their corresponding serum‐cultured GBM cells obtained from the same initial tumor specimen. Overall, these results argue in favor of the use of cellular immunotherapy involving NK or T cell responses against human GSCs, as a new treatment for GBM patients.
MATERIALS AND METHODS
Reagents and antibodies
All other reagents not specified below were purchased from Sigma‐Aldrich (St Quentin Fallavier, France). Antibodies against CD3, CD4, CD8, CD56, HLA‐ABC, HLA‐DR, NKp46 and NKp44 were obtained from BD Biosciences (Le Pont de Claix, France); MelanA/HLA‐A2 tetramers were from Beckman Coulter (Marseille, France); anti‐A2B5 and ‐nestin antibodies were from Millipore (Guyancourt, France); anti‐CD133 antibody was from Miltenyi Biotec (Paris, France); anti‐EGFR antibody was from Santa Cruz Biotechnology (Tebu‐Bio, Le Perray‐en‐Yvelines, France); anti‐EGFRvIII antibody was from Skybio (Bedfordshire, UK); anti‐HLA‐ABC (clone W6.32) and ‐IL13Rα2 antibodies were from Diaclone (Besançon, France); TrastuzumAb (Herceptin) was from Merck (Darmstadt, Germany); and CetuximAb (Erbitux) was from Roche (Meylan, France).
Tumor samples and cell culture
GBM samples were obtained after informed consent from patients admitted to the neurosurgery department at Rennes University Hospital for surgical resection, in accordance with the local ethics committee. Tumors used in this study were histologically diagnosed as grade IV astrocytoma according to the WHO criteria.
GBM primary cell lines were obtained from GBM samples. After mechanical dissociation of tumor tissues, cells were grown in neurosphere (NS) and adherent (Adh) conditions. For NS cultures, cells were grown in Dulbecco's modification of Eagle's medium (DMEM; Lonza, Verviers, Belgium) supplemented with B27 and N2 additives (Invitrogen, Cergy Pontoise, France), EGF (20 ng/mL) and basic FGF (20 ng/mL) (Peprotech, Tebu‐Bio) at 37°C in a humid atmosphere of 5% CO2. When neurospheres were formed, they were isolated, dissociated with trypsin [1 to 10 dilution in phosphate‐buffered saline (PBS); Lonza] and expanded to 1 × 10⁴ cells per well in a 24 well‐plate in fresh medium for 14 days. Between each passage, half of the culture medium was replaced every 2 to 3 days with freshly prepared medium. For Adh cultures, primary cell lines were obtained as described in Avril et al (5). Briefly, cells were grown in DMEM supplemented with 10% fetal calf serum (FCS) (Lonza). When the confluence was achieved, cells were trypsinized and expanded in fresh medium. All GBM NS and Adh cell lines were used between the 10th and 20th passages for the experiments.
Human immortalized erythroleukemia cell line K562 and HLA‐A2‐expressing T cell leukemia/B cell line hybrid T2 cell line were cultured in RPMI 10% FCS.
mRNA preparation, gene expression profiling and expression data analysis
Total RNA was isolated with the Rneasy Mini kit from Qiagen (Courtaboeuf, France) according to the manufacturer's recommendations. RNA integrity (RNA Integrity Number ≥ 8) was confirmed using the Agilent 2100 Bioanalyzer (Agilent Technologies, Santa Clara, CA, USA). Gene expression profiling was performed using the Agilent Whole Human Genome 4 × 44 K Microarray Kit (Agilent Technologies). Total RNA was extracted from GBM NS (n = 5) and GBM Adh (n = 4) cell lines, labeled with Cyanine 3 and hybridized on the arrays according to the manufacturer's recommendations. Data were log2‐transformed, normalized (quantile normalization and baseline transformation) and selected using GeneSpring GX software (Agilent Technologies). Standard Student's t‐test was used to compare the mean expression level in GBM NS and Adh cell lines. Probes were considered significantly differentially expressed if the P‐value was lower than 0.05 and an absolute fold change was greater than 2.
Flow cytometry
Cells were washed in PBS 2% FCS and incubated with saturating concentrations of unlabeled or fluorescent‐labeled primary antibodies for 30 minutes at 4°C. An additional incubation with fluorescent‐labeled secondary antibodies was performed when cells were stained with unlabeled primary antibodies. Cells were then washed with PBS 2% FCS and analyzed by flow cytometry using a FACScan or a FACSCanto II flow cytometer (BD Biosciences). The population of interest was gating according to its Forward Scatter (FSC) / Side Scatter (SSC) criteria. In most of the experiments, the dead cell population was excluded using 7‐amino‐actinomycin D (7AAD) staining (BD Biosciences). For intracellular staining, cells were fixed with methanol and permeabilized with saponin. Data were analyzed with the FlowJo software (Tree Star Inc., Ashland, OR, USA) and the results were expressed as specific fluorescence intensity given by the ratio of geometric mean of test/geometric mean of the isotype control.
Preparation of resting and IL2‐activated NK cells
NK cells were isolated from peripheral blood mononuclear cells (PBMC) of allogeneic healthy donors using NK selection kit (Dynal, Invitrogen) according to the manufacturer's recommendations. NK cells were tested by flow cytometry for their expression of CD56, NKp46 NK cell markers and exhibited more than 90% of CD3− CD56+ NKp46+ cells. Freshly isolated NK cells were stimulated with 200 U/mL of rhIL2 (Novartis, Rueil‐Malmaison, France) for 6 to 7 days.
Generation of MelanA/HLA‐A2 specific CTLs
MelanA‐specific HLA‐A2 positive CD8 T cell lines from healthy donors' PBMC were generated in vitro after repeated stimulations with autologous MelanA peptide‐pulsed dendritic cells (10 µg/mL) as described in Avril et al (5). MelanA/HLA‐A2 specific CTL lines obtained were tested by flow cytometry for their expression of CD3 and CD8 T cell markers and their binding to MelanA/HLA‐A2 tetramer and exhibited more than 85% of CD3+ CD8+ MelanA/HLA‐A2 tetramer+ cells.
Cytotoxicity assay
The cytotoxicity assay was performed as previously described in Avril et al (5). Briefly, target cells were labeled with Na2 51CrO4 (GE Healthcare, Orsay, France) and plated in X‐VIVO medium in a 96‐U‐well microplate. Resting IL2‐activated NK cells or T cells used as effector cells were added on the target cells at different effectors : target ratios as indicated in the figures. For the lectin‐dependent cytotoxicity (LDC), antibody‐dependent cell cytotoxicity (ADCC) and the blocking experiments; phytohemagglutinin (PHA) (10 µg/mL), TrastuzumAb and CetuximAb antibodies (10 µg/mL), and W6.32 anti‐HLA class I antibody (10 µg/mL), respectively, were added 15 minutes before the effectors and were present throughout the cytotoxicity assay. Like CetuximAb, TrastuzumAb is a humanized monoclonal immunoglobulin G1 kappa antibody and therefore was used as control for the Fc portion of the antibody. Cells were incubated for 4 h at 37°C. The percentage of specific lysis was calculated as follow: [(cpm of test release – cpm of spontaneous release)/(cpm of maximum release – cpm of spontaneous release)] × 100, with spontaneous and maximum releases corresponding to the releases obtained by incubating target cells with medium alone and with triton x‐100, respectively. For the cytotoxicity assay performed with a mixed GBM Adh and NS cell population, effector cells and target cells (either Adh or NS cells) were previously stained with carboxyfluorescein succinimidyl ester (CFSE) (Dojindo Laboratories, Munich, Germany) and PKH26 (Sigma‐Aldrich), respectively, according to manufacturer's recommendations. Unlabeled and labeled target cells were then mixed at 1:1 ratio and added in the 4‐h cytotoxicity assay using PHA‐ (10 µg/mL) or IL‐2 activated NK cells at the 10:1:1 and 20:1:1 ratios, respectively. Cells were then collected and incubated with 7AAD for 5 minutes. The percentages for living and dead cells for each target cell population were obtained by flow cytometry. The percentage of specific lysis was calculated as percentage of dead cells tested—percentage of dead cells obtained by incubating target cells with medium alone. Each condition was analyzed three times by flow cytometry and the mean of percentages of specific lysis were presented in Figure 6B and Supporting Information Figure S8.
Figure 6.
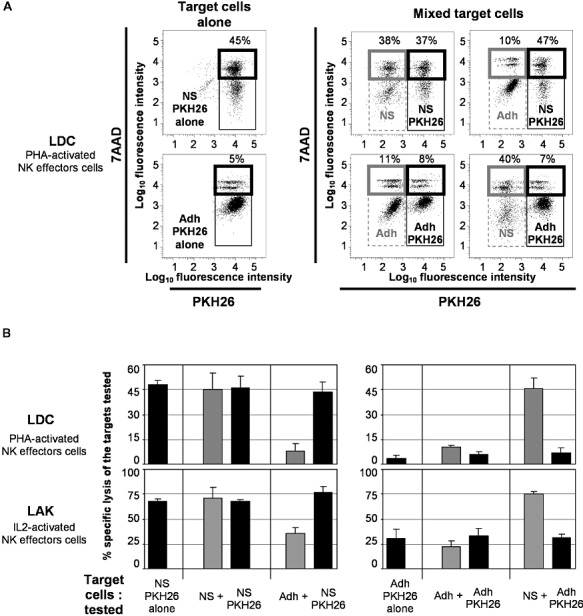
Glioblastoma multiforme (GBM) neurosphere (NS) cells are preferentially killed by lectin‐ and IL2‐activated natural killer (NK) cells. PKH26‐labeled GBM#2 NS or adherent (Adh) cells alone or mixed at 1:1 ratio with unlabeled GBM#2 NS or Adh cells were used as target cells in a 4‐h cytotoxicity assay. PHA‐ and IL2‐activated NK effector cells [for lectin‐dependent cytotoxicity (LDC) and LAK lysis, respectively] were used at 10:1 and 20:1 ratio, respectively, with PKH26+ target cells alone; and at 10:1:1 and 20:1:1 ratio, respectively, with mixed unlabeled and PKH26+ target cells. The percentages of dead cells of mixed unstained and stained target cell populations were assessed by flow cytometry using 7‐amino‐actinomycin D (7AAD) staining. Activated NK effector cells were previously labeled with carboxyfluorescein succinimidyl ester and then were excluded from the analysis. A and B. Targets: GBM#2 NS and Adh cells. A. Representative flow cytometry profiles obtained with NS and Adh cells using phytohemagglutinin (PHA)‐activated NK cells are shown. B. Results are presented as percentages of specific lysis of the tested target cells as described in Materials and Methods. GBM#2 cell line is shown (see Supporting Information Figure S8 for the other cell lines).
Statistics
Values represent the mean ± SD of n different experiments. Student's t‐test was applied using a two‐tailed distribution of two conditions of unequal or equal variances on groups of data obtained in experiments. The significance level was P < 0.05.
RESULTS
Generation of GBM cell lines in neurosphere and adherent culture conditions
GBM cells were prepared from fresh tumor specimens and expanded in a serum‐free medium or an FCS‐containing medium, further referred to as NS or Adh cultures, respectively. Eight GBM cell lines out of 40 GBM specimens were successfully amplified in NS condition during more than 20 passages. NS cell lines continuously formed neurospheres passage after passage (Figures 1A,B and Supporting Information Figure S1A), with variable amount of cells and spheres obtained at each passage depending on tumor samples. Corresponding adherent GBM cell lines were obtained for five of the eight GBM specimens from which NS cell lines have been obtained. Adh cell lines were grown in monolayer (Figures 1A and Supporting Information Figure S1A).
Figure 1.
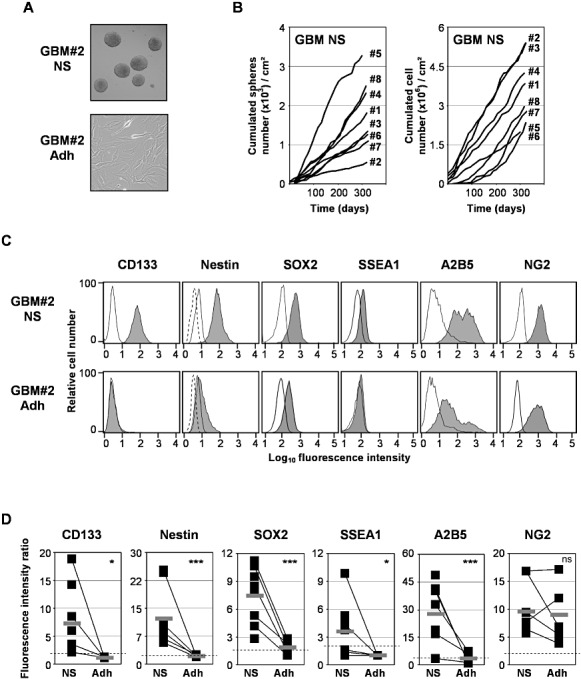
Characterization of glioblastoma multiforme (GBM) primary cell lines. Cells from GBM specimen were expanded in a serum‐free medium [neurosphere (NS) condition] or a fetal calf serum‐containing medium [adherent (Adh) condition]. A. Typical cell morphology of neurospheres for NS cell lines and adherent for Adh cell lines. A representative primary cell line GBM#2 is shown (see Supporting Information Figure S1A for the others cell lines). B. Cumulated number of neurospheres and cells obtained with NS cell lines during the different passages. C. Expression of stem cell and progenitor markers. Cells from NS and Adh GBM lines were dissociated and stained with isotype controls (open histograms) or specific labeled antibodies against CD133, nestin, SOX2, SSEA1, A2B5 and NG2 molecules (closed histograms), and then analyzed by flow cytometry. A representative primary cell line GBM#2 is shown (see Supporting Information Figure S1B for the others cell lines). D. The mean of specific fluorescence intensity of the protein expression obtained in each NS and Adh cell line (n = 8 and 5, respectively) was determined in at least three different experiments as described in Materials and Methods. The thick gray bar indicates the mean of specific fluorescence intensity of protein expression obtained in all cell lines. Cell lines were considered as positive for the expression of proteins of interest when the specific fluorescence intensity was more than 2 (dashed line). ***P < 0.01; *P < 0.05. ns = not statistically different.
GBM cells were then tested for the protein expression of neural stem cell and progenitor markers CD133, nestin, SOX2, SSEA1/CD15 and A2B5, NG2, respectively. All GBM NS cell lines tested expressed, at various levels, CD133, nestin and A2B5; whereas a weak or no expression was detected on Adh cell lines (Figure 1C,D and Supporting Information Figure S1B); except for A2B5 that was expressed in one out of five Adh cell lines (ie, GBM#2 Adh) but at a lower level compared with its corresponding NS cell line (GBM2# NS) (Figure 1C). SOX2, a known tumor antigen expressed on GBM, was strongly expressed by all GBM NS compared with Adh cell lines (Figures 1C,D and Supporting Information Figure S1B). SSEA1 was expressed only in four out of eight NS cell lines but not in Adh cell lines. In contrast, the putative progenitor marker NG2 was expressed at equal levels on NS and Adh cell lines (Figures 1C,D and Supporting Information Figure S1B).
GBM NS cell lines were also tested for their capacity to differentiate into astrocytic and neuronal cells. NS cells were grown in serum‐containing DMEM in the presence of BMP4, which induces cell differentiation. After differentiation, GBM NS cells expressed the GFAP astrocytic marker, and β3‐tubulin neural marker (Supporting Information Figure S2A). Expression of GFAP and β3‐tubulin was also analyzed by flow cytometry in both undifferentiated and differentiated NS and Adh cell lines (Supporting Information Figure S2B,C). Adh cell lines did not express GFAP and β3‐tubulin, whereas undifferentiated NS cells showed a weak expression. In contrast, BMP4‐differentiated NS cells expressed high levels of GFAP and β3‐tubulin (Supporting Information Figure S2B,C).
GBM NS cell lines were finally tested for their capacity to re‐generate tumors in immunodeficient mouse. GBM#2 NS cells were injected into the brain of nude mouse (n = 4). Injected mouse presented clinical signs leading to the sacrifice 2 months after injection. Histological analysis of the brain showed the formation of a diffuse tumor (Supporting Information Figure S2D). All tumor cells from the xenografts expressed nestin and some of them were positive for GFAP (Supporting Information Figure S2E).
The gene expression profiling was performed on four couples of GBM NS/Adh cell lines and one additional NS cell line. Differential expression between cells derived from NS and Adh cell lines was found for eight unknown and 38 known genes (Supporting Information Figure S3A). Functional annotation of the differentially expressed genes (NIH‐DAVID software) identified several enriched Gene Ontology biological processes, among them the cellular macromolecule catabolic process and the RNA processing (Supporting Information Figure S3B).
Expression of MHC class I and II molecules and tumor antigens on GBM cells derived from NS and Adh cultures
Expression of MHC molecules on GBM NS and Adh cells was analyzed by flow cytometry. As shown in Figure 2A,B and Supporting Information Figure S4, both NS and Adh cells expressed HLA class I molecules but not HLA class II molecules, excepting one NS cell line (GBM#3 NS). In addition, IFNγ significantly increased the expression of HLA class I by all NS and Adh cell lines. IFNγ also induced HLA class II expression in half of the NS cell lines and almost all Adh cell lines except one (data not shown). Comparison between NS and Adh cells showed that HLA class I molecules were highly expressed by Adh cells in three out of five cell lines. On average, HLA class I molecule expression was greater on Adh cells, although the difference was not statistically significant. In order to confirm this “in vivo,” freshly dissociated GBM specimens were analyzed by flow cytometry for HLA class I expression on CD133+ and CD133− GBM cells, with exclusion of the CD45+ cell compartment (Supporting Information Figure S5). However, between 0.3% and 1.8% of CD133+ cells were detected in the five GBM samples tested, which renders difficult the interpretation of the data (Supporting Information Table S1 and Supporting Information Figure S5A). Nine additional GBM samples conserved at −150°C were defrosted and also analyzed as described above (Supporting Information Table 1). As shown in Supporting Information Table S1, similar results were obtained with freshly prepared and defrosted GBM cells from the same specimens. Between 0.5% and 36.4% of CD133+ cells were detected in these nine GBM samples. Only the three samples with the highest proportion of CD133+ cells were further analyzed for MHC class I expression (Supporting Information Figure S5B). Interestingly, CD133+ cells expressed higher levels of HLA‐ABC molecules compared with CD133− GBM cells in the three GBM specimens tested.
Figure 2.

Expression of MHC molecules and tumor antigens on glioblastoma multiforme (GBM) primary cell lines. A. GBM neurosphere (NS) and adherent (Adh) cells were stained with isotype controls (open histograms) or specific labeled antibodies against HLA‐ABC, HLA‐DR, IL13Rα2, EGFRvIII and EGFR (closed histograms), and then analyzed by flow cytometry. For EGFR expression, NS cell lines were grown for 48 h without (open histograms with thick lines) or with EGF (closed histograms). A representative primary cell line GBM#2 is shown (see Supporting Information Figure S4 for the others cell lines). B. The mean of specific fluorescence intensity of the protein expression obtained in each NS and Adh cell line was determined as described in Figure 1 (n = 8 and 5, respectively). The thick gray bar indicates the mean of specific fluorescence intensity of protein expression obtained in all cell lines. Cell lines were considered as positive for the expression of proteins of interest when the specific fluorescence intensity was more than 2 (dashed line). *P < 0.05. ns = not statistically different. C. Tumor antigen mRNA expression on GBM cell lines was analyzed by transcriptomic microarray experiments. Total mRNA from GBM cell lines was extracted and analyzed for a gene expression profile. Results are expressed as the mRNA expression fluorescence intensity.
Protein expression of IL13Rα2, EGFRvIII and gp100, tumor antigens we have previously described in GBM (54), were analyzed by flow cytometry on GBM NS and Adh cell lines. Expression of EGFR and EGFRvIII, a variant of EGFR, was higher on NS cells compared with Adh cells (Figures 2A,B and Supporting Information Figure S4) in only GBM#2 cells. Overall, EGFR and EGFRvIII expressions were not statistically different between NS and Adh cells. In contrast, CD133+ cells from GBM specimens expressed higher levels of EGFR molecules than CD133− cells (Supporting Information Figure S5B). It is noteworthy that detection of NS cell expression of EGFR protein was increased after EGF removal from the cell culture medium (Figure 2A and Supporting Information Figure S4); whereas, as expected, EGFRvIII expression was not affected by the presence of EGF. Inversely, expression of IL13Rα2 was high on Adh cells compared with NS cells (Figure 2A,B and Supporting Information Figure S4). Furthermore, none of the GBM NS or Adh cells expressed gp100 protein. Tumor antigen mRNA expression was also tested using the data set of the transcriptomic microarray analysis. Expression of selected tumor antigens previously described in GBM (ABCC3, ALK, cyclin B, EphA2, ENX1, Fra1, GALT3, SART1‐3, sox5, sox11, survivin, hTERT and YKL40 mRNA) was confirmed in both NS and Adh GBM cell lines at different levels depending on tumor samples (Figure 2C). However, no significant difference in tumor antigen mRNA expression was found between NS and Adh cells.
Sensitivity of GBM cells derived from NS cultures to lysis mediated by NK effector cells
NS cells were used as targets in cytotoxicity assays with allogeneic NK cells used as effector cells. Phenotype of resting and IL2‐activated NK cells by flow cytometry confirmed that the effector cells were CD3− CD56+ NKp46+ and expressed NKp44 after IL2 activation (Figure 3A). Purified NK cells were also able to kill K562 cells, which are known as prototype target cells of NK cells (Figure 3D). The sensitivity of GBM NS cells was then tested. First, resting NK cells were used alone against NS cells in NK lysis experiments. As shown in Figure 3C,D and Supporting Information Figure S6B,C, NS cells were resistant to NK lysis. Blocking antibodies against HLA class I molecules induced NK lysis of NS cells, demonstrating that HLA class I molecules are involved in the NS cell resistance to NK cells. Second, resting NK cells were used as effector cells against NS cells in the presence of PHA, a lectin known to cross‐link effectors to target cells and to activate NK cells, in LDC experiments. NS cells became sensitive to PHA‐activated NK lysis (Figure 3C,D and Supporting Information Figure S6B,C). In addition, NS cells were tested in NK‐mediated ADCC experiments using CetuximAb therapeutic antibody. Without removing EGF from the culture medium, CetuximAb, which recognizes EGFR, bound three out of five NS cell lines (Figure 3B and Supporting Information Figure S6A). The TrastuzumAb antibody, like CetuximAb, is a humanized antibody that contains a human Fc portion. Therefore, the TrastuzumAb antibody, which does not bind to NS cells except GBM#4 NS, was used as a negative control in ADCC assays (Figure 3B and Supporting Information Figure S6A). NS cells recognized by CetuximAb were sensitive to antibody‐dependent NK‐mediated lysis (Figure 3C,D, Supporting Information Figure S6B,C). Finally, NS cells were sensitive to IL2‐activated NK mediated lysis. Altogether, these results demonstrate that GBM NS cell lines are sensitive to lysis mediated by NK cells when these effector cells are efficiently activated by masking HLA class I molecules; or using lectin, antibodies or cytokines.
Figure 3.
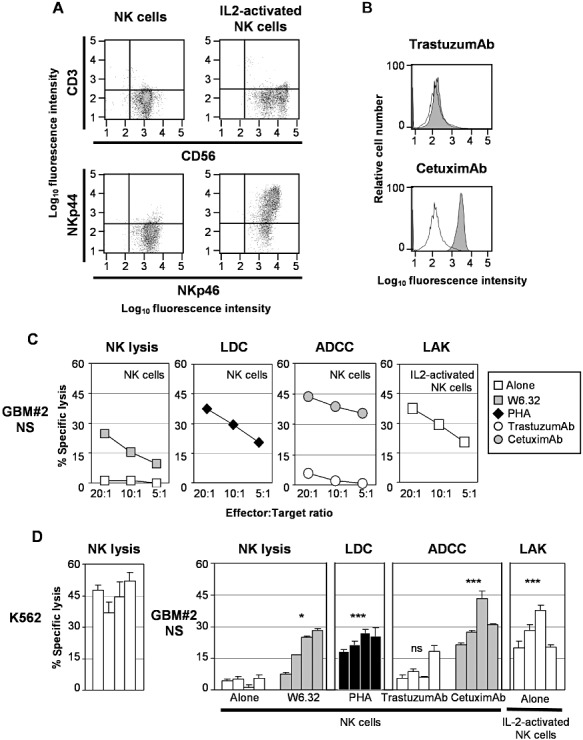
Sensitivity of glioblastoma multiforme (GBM) neurosphere (NS) cell lines to natural killer, lectin‐dependent, antibody‐dependent and lymphokine‐activated lysis mediated by natural killer (NK) cells.
A. Unstimulated and IL2‐stimulated NK cells were stained with specific labeled antibodies against T and NK cell markers CD3, CD56, NKp46 and NKp44. B. GBM NS cell lines were incubated with human IgG (open histograms), TrastuzumAb and CetuximAb therapeutic antibodies (closed histograms) and stained with labeled antibodies against human IgG and then analyzed by flow cytometry. A representative primary cell line GBM#2 is shown (see Supporting Information Figure S6A for the others cell lines). C. GBM NS cell lines were labeled with 51‐Cr and used as target cells in a 4‐h cell cytotoxicity assay with NK cells or IL2‐activated NK effector cells. Different effector : target (E : T) ratios were used and specific lysis was calculated as indicated in Materials and Methods. Effector cells were added alone (□) or in the presence of anti‐HLA‐ABC blocking antibodies ( ), the lectin phytohemagglutinin (PHA) (◆), the therapeutic antibodies TrastuzumAb (○) or CetuximAb (
 ). A representative primary cell line GBM#2 is shown (see Supporting Information Figure S6B for the others cell lines). D. Similar results were obtained with NK cells prepared from four different healthy donors. E : T ratio: 10:1 (see Supporting Information Figure S6C for the others cell lines). ***P < 0.01; *P < 0.05. ns = not statistically different (comparison with lysis with NK cells alone); LDC = lectin‐dependent cytotoxicity; ADCC = antibody‐dependent cell cytotoxicity.
Sensitivity of GBM cells derived from NS cultures to lysis mediated by tumor‐specific T effector cells
NS cells were used as target cells in a MelanA‐specific T cell cytotoxicity model previously described in Avril et al (5). MelanA‐specific CTL cell lines were generated after repeated stimulations of autologous MelanA‐loaded dendritic cells. CTL cell lines were CD3+ CD4− CD8+ bound by MelanA/HLA‐A2 tetramers (Figure 4A) and killed MelanA‐loaded T2 cells, used as positive controls, but not unloaded T2 cells (Figure 4B,C). In addition, blocking antibodies against MHC class I molecules abolished CTL lysis, confirming MHC‐dependent lysis. As shown in Figure 4B,C and Supporting Information Figure S7 with three different CTL cell lines, MelanA‐loaded NS cells were sensitive to MelanA‐specific T cell lysis. Again, this killing was abolished in the presence of anti‐HLA class I blocking antibodies (Figure 4B,C and Supporting Information Figure S7).
Figure 4.
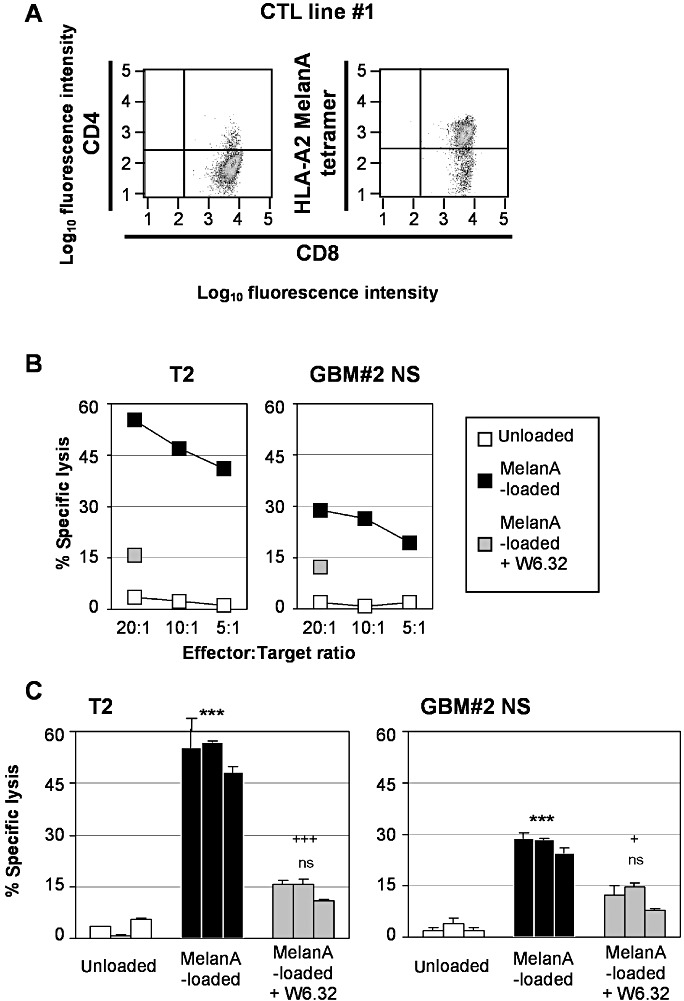
Sensitivity of MelanA‐loaded glioblastoma multiforme (GBM) neurosphere (NS) cell lines to MelanA/HLA‐A2‐specific T cells.
A. MelanA/HLA‐A2‐specific T cell lines were generated in vitro after co‐culture with autologous dendritic cells loaded with MelanA peptides. MelanA/HLA‐A2‐specific T cell lines obtained were stained with MelanA/HLA‐A2 tetramers and anti‐CD3, ‐CD4, ‐CD8 antibodies, and then analyzed by flow cytometry. B. MelanA/HLA‐A2‐specific T cell lines were used as effectors in a 4‐h cell cytotoxicity assay against 51Cr‐labeled unloaded (□) or MelanA‐loaded ( ) T2 cells (used as positive controls) and GBM NS cell lines in the absence or in the presence of blocking antibodies against HLA‐ABC (
 ). Different effector : target (E : T) ratios were used and specific lysis was calculated as indicated in Figure 3. A representative primary cell line GBM#2 is shown (see Supporting Information Figure S7A for the other cell lines). C. Results are representative of results obtained with three different MelanA/HLA‐A2‐specific T cell lines. E : T ratio: 10:1 (see Supporting Information Figure S7B for the other cell lines). ***P < 0.01; ns, not statistically different (comparison with unloaded target cells). +++
P < 0.01; +
P < 0.05 (comparison with MelanA‐loaded target cells).
). Different effector : target (E : T) ratios were used and specific lysis was calculated as indicated in Figure 3. A representative primary cell line GBM#2 is shown (see Supporting Information Figure S7A for the other cell lines). C. Results are representative of results obtained with three different MelanA/HLA‐A2‐specific T cell lines. E : T ratio: 10:1 (see Supporting Information Figure S7B for the other cell lines). ***P < 0.01; ns, not statistically different (comparison with unloaded target cells). +++
P < 0.01; +
P < 0.05 (comparison with MelanA‐loaded target cells).
Comparison of sensitivity of GBM cells derived from NS and Adh cultures to NK and T cell cytotoxicity
NS and Adh cells derived from the same tumor specimen were finally compared for their sensitivity to NK lysis in the presence of blocking antibodies against MHC class I molecules, LDC, LAK and CTL lysis. As shown in Figure 5, NS cells were more sensitive to either NK, LDC, LAK lysis mediated by NK cells or CTL lysis mediated by MelanA‐specific T cells compared with their corresponding Adh cells obtained from the initial tumor sample.
Figure 5.
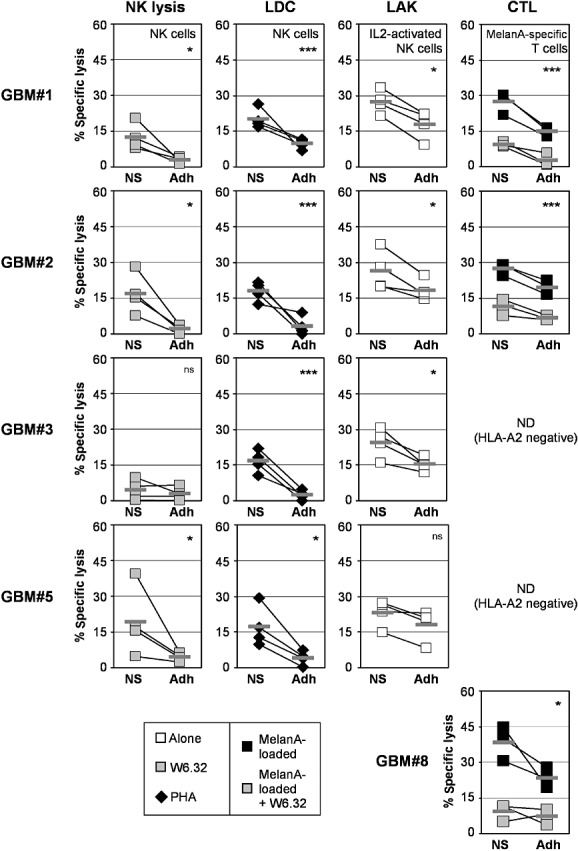
Comparison of glioblastoma multiforme (GBM) neurosphere (NS) and adherent (Adh) primary cell lines sensitivity to natural killer (NK) and T cell lysis. Unloaded or MelanA‐loaded GBM NS and Adh cell lines obtained from the same initial tumor specimen were used as target cells against NK cells in the presence of the blocking antibody anti‐HLA‐ABC ( ), the lectin phytohemagglutinin (PHA) (◆); or IL2‐activated NK cells (□); or MelanA‐specific T cell effectors (
 ). Results are representative of results obtained with four different donors for NK cell effectors and three different MelanA/HLA‐A2‐specific T cell lines. E : T ratio: 10:1. ***P < 0.01; *P < 0.05. ns = not statistically different.
GBM cells derived from NS cultures are preferentially killed by lectin‐ and IL2‐activated NK cells
NS and Adh cells derived from the same tumor specimen were tested together in a cytotoxicity assay using PHA‐ or IL2‐activated allogeneic NK cells (E : T ratio: 10:1:1 for LDC and 20:1:1 for LAK lysis). One of the target cells (either NS or Adh cells) was previously stained with PKH26 (Figure 6A). Effector cells were also labeled with CFSE and further excluded from the analysis. The percentages of unlabeled and PKH26‐labeled NS cell lysis were equal (38% and 37%, respectively) when cells were mixed, and similar to the percentage obtained with PKH26+ NS alone (45%) (Figure 6A), showing that the PKH26 staining did not affect cell sensitivity to LDC. Similar results were obtained using unlabeled and PKH26+ Adh cells, but at a lower level (11% and 8% vs. 5%). When NS cells were mixed with Adh cells, NS cells were killed at a higher level (40% and 47%) compared with Adh cells (10% and 7%) (Figure 6A). Similar results were obtained using PHA‐ and IL2‐activated NK cells (Figure 6B and Supporting Information Figure S8). These results show that GBM NS cells were preferentially killed by activated NK cells compared with Adh cells obtained from the initial tumor sample (Figure 6 and Supporting Information Figure S8).
DISCUSSION
In the present study, we provide experimental evidence that GBM cells with stem cell characteristics are resistant to lysis mediated by resting NK cells because of the expression of MHC class I molecules. Furthermore, we show that increasing activatory signals to NK by lectins renders GSC sensitive to NK lysis. More importantly, we demonstrate for the first time that GSCs are sensitive to ADCC mediated by NK cells using the therapeutic antibody CetuximAb. We confirm GSC sensitivity to cytotoxicity carried out by IL2‐activated NK cells and tumor‐specific T cells. Interestingly, we show that GSCs are more sensitive to NK and T cell‐mediated lysis compared with their analogous serum‐cultured GBM cells obtained from the same tumor specimen.
GSCs are characterized by their expression of stem cell markers and their ability to (i) form neurospheres in vitro; (ii) differentiate into cells expressing astrocytic, oligodendrocytic or neural markers; and (iii) re‐develop the initial tumor in vivo in mouse models. In this work, expanded GBM NS cells express CD133, nestin, SOX2 and A2B5, and can differentiate into GFAP and β3‐tubulin‐expressing cells. Little, if any, variation of the expression of neural stem cell and progenitor markers is observed during the culture (data not shown). In addition, GBM NS cells form tumors once injected into the brain of nude mouse. Overall, these results indicate that our GBM NS cells fulfilled the criteria that define GSC.
According to recent studies 17, 66, GBM NS cell lines are resistant to cytotoxicity mediated by resting NK cells. However, Castriconi et al indicate that NK resistance of GSC cells is not because of the expression of HLA class I molecules, known ligands for NK inhibitory receptors (data not shown in (17)). In contrast, we show that GBM NS cells become sensitive to resting NK lysis when HLA class I molecules are masked by antibodies. This discrepancy could be related to the nature of the blocking antibodies used, that is, W6.32 in this study vs. A6136 clone in Castriconi et al (17). However, HLA class I molecules fail to protect GSC against LAK lysis [this study and Castriconi et al (17)]. IL2‐activated NK cells are strong killer cells because of the expression of additional activatory receptors such as NKp44 (60). This may explain why IL2‐activated NK cells are barely inhibited by MHC class I molecules, as described in tumor cells of other origins 4, 16, 34. The fact that GSCs become sensitive to NK lysis after HLA class I molecules are masked suggests that GSCs express ligands for activatory receptors expressed on resting NK cells. This is in agreement with studies described in Castriconi et al and Wu et al 17, 66. Using recombinant fusion proteins of NK activatory receptors/Fc IgG as probes, Wu et al show that a small proportion of GSC express NKG2D, NKp30/NCR3, NKp46/NCR1 and NKp44/NCR2 ligands, and these expressions are increased after stimulation of GSC with IFNγ(66). Additionally, expressions of PVR (CD155) and nectin2 (PVRL2), ligands of DNAM1, and to a lesser extent MICA, ULBP2, ‐3 and ‐4, ligands of NKG2D, have been described in GSC studies 17, 21. In our microarray analysis, we have also observed mRNA expression of these ligands (except ULBP3 and ‐4) on GBM NS cell lines (Supporting Information Figure S9A).
Using allogeneic or autologous T cells specific for peptides derived from the tumor antigens SOX6 and Her2 or from the virus CMV, different groups have recently shown that GSCs are sensitive to tumor‐specific T cells 1, 14, 58. We have confirmed the sensitivity of GBM NS cells to tumor‐specific T cell cytotoxicity using an allogeneic MelanA‐specific T cell model we have previously used with serum‐cultured GBM cell lines (5). Indeed, MelanA‐loaded but not unloaded GBM NS cells were killed by MelanA‐specific T cell lines obtained from three different donors. This lysis was abolished by anti‐HLA class I molecules, target molecules recognized by cytotoxic T cells.
It is noteworthy that the cytotoxicity levels observed for GBM Adh cells in the present work are similar to results observed in previous studies when considering the same E : T ratio (10:1) 22, 59, 67. However, other studies show higher lysis levels of U251 cell line 38, 72. These discrepancies could be because of the duration of contact between target and effector cells (4‐h vs. 24‐h cytotoxicity assay) (72); the target cells used (GBM Adh primary cell lines vs. U251 immortalized glioma cell line) 38, 72; or the effector cells used (polyclonal MelanA specific T cell lines vs. CTL clones expressing modified TCR specific for IL13Rα2) (38).
Very importantly, we demonstrate, for the first time to our knowledge, that differences in NK and T cell cytotoxicity sensitivity exist between GBM NS and Adh cells derived from the same initial tumor specimen. Indeed, GBM NS cells were more sensitive to NK and T cell lysis compared with their corresponding serum‐cultured GBM Adh cells. Moreover, GBM NS cells were preferentially killed by activated NK cells when mixed GBM NS and Adh cells were used as target cells. Interestingly, Brown et al found that GSCs and serum‐differentiated GSCs infected with CMV were equally sensitive to lysis mediated by virus‐specific T cell effectors (14). This suggests that serum‐differentiated GSC cells and GBM Adh cells used in the present study might not have the same sensitivity to cytotoxicity mediated by immune effector cells.
NK cytotoxicity depends on the initial phase of NK adhesion to target cells in which various adhesion molecules are involved. GBM NS and Adh cells do not express CD2 (LFA2), CD50 (ICAM3) and CD102 (ICAM2) (Supporting Information Figure S9B). Expression level of CD54 (ICAM1) varies with the GBM NS cell line, with an either higher or lower expression on the corresponding GBM Adh cell line (Supporting Information Figure S9B). Expression level was higher for GBM NS over Adh cells for only CD56 (NCAM1), and to a lesser extent CD58 (LFA‐3) (Supporting Information Figure S9B). These higher expressions were confirmed in CD133+ cells from GBM specimens (Supporting Information Figure S5B). Interestingly, CD56 is also expressed on NK cells and is known to exhibit homotypic interaction with itself (41). Further investigations are needed to clarify the CD56 involvement in the NK sensitivity of GBM NS cells. The possibility that a defect in the adhesion phase might explain the relative resistance of GBM Adh cells to NK lysis cannot be ruled out.
NK cell cytotoxicity is also finely regulated by a balance between activatory and inhibitory signals detected by specific receptors 10, 12, 61. The target cell sensitivity to NK lysis will therefore depend on its expression of ligands for NK activatory and inhibitory receptors. We show that the expression of HLA class I molecules, ligands of NK inhibitory receptors, varies significantly between GBM NS and Adh cells, sometimes with higher expression on GBM Adh than NS cells. However, after masking HLA class I molecules, serum‐cultured GBM Adh cells remained constantly more resistant to NK lysis than their GBM NS counterparts. These results suggest that additional resistance mechanisms against NK lysis occur in non‐stem cell GBM cells. Other nonrelated HLA ligands of NK inhibitory receptors could be incriminated. Recently, Roth et al reported CLEC2D (LLT1) glioma expression, a ligand for NKRP1 (CD161), which rapidly reduces CD161 expression on the NK cell surface, and therefore reduces NK activation and protects target cells from NK lysis (53). We observed LLT1 mRNA expression in both GBM NS and Adh cell lines, but without any difference in expression levels between them (Supporting Information Figure S9A). The difference in expression level of ligands for NK activatory receptors might also explain the difference of NK sensitivity of GBM NS and Adh cells. Although ligands of NK activatory receptors have been detected on GSC and serum‐differentiated GBM cell lines, their respective expression levels have not been compared 17, 66. However, similar low levels of MICA, ULBP2, ‐3, ‐4 expressions have also been found in GSC and FSC GBM cells (21). Our gene profiling data did not disclose any difference in mRNA expression of known ligands of NK activatory receptors, MICA, MICB, ULBP1, ‐2, ‐3, ‐4, PVR and nectin2, on GBM NS and Adh cells (Supporting Information Figure S9A). Similarly, we were unable to observe expression by these cells of CD48 protein, a ligand for the NK activatory receptor 2B4 (CD244) (Supporting Information Figure S9B).
We also found that GBM NS cells are more sensitive to specific T cell cytotoxicity than analogous Adh cells, although expression of HLA class I molecules, recognized by T cells, varies greatly between GBM NS and Adh cells, with sometimes highest expression on GBM Adh cells. However, this could not be confirmed when CD133+ and CD133− cells from GBM specimens were compared, probably because only a few samples were tested (Supporting Information Figure S5B). Expression of accessory molecules, essential for T cell activation, has been analyzed. Neither GBM NS cells nor Adh cells express CD80 and CD86 molecules, ligands of CD28 (Supporting Information Figure S9B). Immunomodulatory molecules involved in inhibiting the T cell responses might also be differentially expressed in GBM NS and Adh cells. We have recently described functional inhibitory effects of CD274/PDL1, IDO and TGFβ2 on GBM‐specific T cell functions using serum‐cultured primary GBM cell lines. PDL1 has been described in GSC and serum‐cultured GBM cells with a higher expression on FCS GBM cells 62, 73. We also observed that PDL1 was expressed more on GBM Adh cells than on their corresponding NS cells, but that the expression levels were very low (Supporting Information Figure S9B). Interestingly, IFNγ induced PDL1 expression in GBM NS and Adh cells, but at a higher level in NS cells than Adh cells (Supporting Information Figure S9A). However, as PDL1 does not play a direct role regarding GBM primary cell line resistance to T cell cytotoxicity (5), its involvement could also be excluded for GBM NS cells. Other immunomodulatory molecules might be involved in the resistance of GBM Adh cells. For instance, the molecule CD70 expressed on glioma cells can induce apoptosis of lymphocytes (65). It is interesting to note that CD70 exhibited higher expression on GBM Adh cells compared with NS cells in two out of five GBM cell lines (Supporting Information Figure S9B). However, using mouse models, the expression of soluble and membrane CD70 by glioma cells promotes tumor rejection via mechanisms involving CD8 effector T cells 3, 47, leading the authors to suggest that soluble CD70 could serve as a powerful adjuvant to boost immune cell‐mediated anti‐tumor responses. Alternatively, GBM Adh cells, but not NS cells, might develop intrinsic properties favoring resistance against both NK and T cell cytotoxicity machinery involving perforin and granzymes. Anti‐apoptosis mechanisms against granzyme effects, as well as mechanisms by which perforin binding to the target membrane or pore formation are avoided, having been previously described in cancer cells. Interestingly, BCL2L12 is one of the genes that are differentially expressed between GBM NS and Adh cells, with an over‐expression on GBM Adh cells. These results were confirmed by Q‐PCR (data not shown). One could speculate that BCL2L12 confers to GBM Adh cell a resistance against apoptosis mediated by cytotoxic lymphocytes, although more investigations are needed to answer this question.
In this study, we demonstrate for the first time that GBM NS cells are sensitive to ADCC mediated by resting NK cells in vitro using the therapeutic antibody anti‐EGFR CetuximAb. TrastuzumAb, a therapeutic antibody directed against ERBB2 (Her2/neu; an EGFR family member), hardly binds on primary GBM NS and Adh cells and was therefore used as a negative control in our ADCC experiments. It is noteworthy that the CetuximAb binding on GBM NS cells was investigated without previous privation of EGF in culture medium. As the presence of EGF in culture medium limits the detection of EGFR expression on the GBM NS cell surface (Figure 2 and Supporting Information Figure S4), this strongly suggests that EGFRvIII was the molecular target of CetuximAb in the ADCC experiments. Indeed, prior privation of EGF is not necessary for EGFRvIII detection because of its inability to bind EGF (33).
CetuximAb is currently used for monotherapy or combined with radio/chemotherapy for squamous cell carcinomas of the head and neck and metastatic colorectal cancers (40). By preventing EGF binding to its receptor, CetuximAb directly abolishes EGFR downstream signaling pathways and enhances the tumor sensitivity to combined cytotoxic radio/chemotherapeutic agents (26). For instance, in combination with radiation, it promotes tumor apoptosis, decreases tumor DNA repair mechanisms and inhibits tumor angiogenesis (26). Interestingly, its single use in an immuno‐compromised mouse model slows down GBM progression by inhibiting tumor invasion and growth and inducing apoptosis (45). In a pilot study with three recurrent GBM patients, CetuximAb has demonstrated promising antitumor effects (9). Unfortunately, its recent use in recurrent high‐grade glioma or GBM patients, as a monotherapy (48) or in combination with BevacizumAb and Irinotecan (29), was unsuccessful. In this study, we show that GBM NS cells are sensitive to ADCC using CetuximAb. However, this mechanism might not occur in vivo, because of the limited infiltration of immune cells within GBM, although CD56+ NK cells have been previously described in some human GBM samples (7). In murine glioma models, an increased recruitment of these cells has been demonstrated after vaccination with CpG 2, 27, IL12‐expressing stromal cells (31) or IL23‐expressing DC (32). In these models, the injection of CetuximAb might increase the vaccine efficiency. A recent study describes the feasibility and safety of adoptive cell therapy using autologous NK cells in human recurrent glioma (36) in which some partial responses have been observed. In this work, we used allogeneic NK cells as effector cells. However, Castriconi et al demonstrated that GSCs can be effectively killed by IL2‐activated allogeneic and autologous NK cells. One could speculate that CetuximAb could be used to enhance effector cell cytotoxicity against GSC cells in such an immunotherapeutic approach using autologous or allogeneic NK cells.
The present study demonstrates that GSCs are more sensitive to NK and T cell cytotoxicity compared with their analogous serum‐cultured GBM cells. In view of this particular GSC sensitivity to NK and T cell cytotoxicity, although these results were obtained from in vitro experiments, one could speculate that in vivo, residual GSCs remaining after the surgical resection and resistant to adjuvant radio‐ and chemotherapy treatments, could be targeted with an immunotherapeutic approach involving NK and T cell cytotoxicity responses.
Supporting information
Figure S1. Characterization of GBM primary cell lines. A. Cell morphology of NS and Adh cultures. B. Expression of stem cell and progenitor markers CD133, nestin, SOX2, SSEA1, A2B5 and NG2 on cells from NS and Adh GBM lines. For details, see the Figure 1 legend.
Figure S2. Differentiation capacity tumor xenograft generation of GBM NS primary cell lines. NS cell lines were grown for one week in a BMP4/serum‐containing medium. A. Differentiated NS cell lines were permeabilized and stained with antibodies against GFAP and β3‐tubulin, and then analyzed by fluorescence microscopy. DAPI was used to stain the nucleus. B. Untreated or BMP4/serum‐differentiated (open histograms with thick lines) cells from NS and Adh GBM lines were stained with isotype controls (open histograms) or specific labeled antibodies against GFAP and β3‐tubulin (closed histograms), and then analyzed by flow cytometry. A representative primary cell line GBM#2 is shown. C. The mean of specific fluorescence intensity of the protein expression obtained in each untreated (solid lines) or BMP4/serum‐treated (dashed lines) NS and Adh cell line was determined as described in Figure 1 (n = 8 and 5, respectively). The thick gray bar indicates the mean of specific fluorescence intensity of protein expression obtained in all cell lines. Cell lines were considered as positive for the expression of proteins of interest when the specific fluorescence intensity was more than 2 (dashed line). ***P < 0.01. GBM#2 NS cells were injected into the brain of nude mouse. D. Histological analysis of the GBM#2 NS xenograft after May–Giemsa staining of paraffin‐embedded sections. E. Immunohistochemistry staining of nestin and GFAP on GBM#2 NS xenograft sections.
Figure S3. Hierarchical clustering of the 46 differentially expressed genes in NS vs. Adh cell lines. Total mRNA of GBM NS and Adh cell lines were extracted and analyzed for a gene expression profile as described in Materials and Methods. A. The expression values presented are normalized and log‐transformed intensities. As expected, samples clustered into two distinct groups: the NS cells lines and the Adh cell lines. B. Functional annotation of the 46 differentially expressed genes in NS vs. Adh cell lines was obtained using the NIH‐DAVID Bioinformatics resources. The represented terms are limited to the biological process domain.
Figure S4. Expression of MHC molecules and tumor antigens on GBM primary cell lines. GBM NS and Adh GBM lines were stained with isotype controls (open histograms) or specific labeled antibodies against HLA‐ABC, HLA‐DR, IL13Rα2, EGFRvIII and EGFR (closed histograms), and then analyzed by flow cytometry. For EGFR expression, NS cell lines were grown for 48 h without (open histograms with thick lines) or with EGF (closed histograms). For details, see the Figure 2 legend.
Figure S5. Expression of MHC class I, EGFR, CD56 and CD58 molecules on CD133+ and CD133− CD45− tumor cells from GBM specimens. A. Freshly prepared GBM samples were stained with anti‐CD133 and anti‐CD45 antibodies and then analyzed by flow cytometry, after exclusion of 7AAD+ dead cells. Percentages of CD133+ and CD45+ cells with the GBM specimens are indicated in the corresponding gates. B. Defrosted GBM samples were labeled with anti‐HLA‐ABC, ‐EGFR, CD56 and CD58 in combination with anti‐CD133 and ‐CD45 antibodies and then analyzed by flow cytometry. Expressions of HLA‐ABC, EGFR, CD56 and CD58 molecules on GSC and other tumor cells were obtained after gating in CD45− CD133+ (dark gray histograms) and CD45− CD133− (gray histograms) cell populations. Values in the top‐right corners (in black for CD133+ cells and in gray of the other tumor cells) indicate the mean of specific fluorescence intensity of the protein expression studied.
Figure S6. Sensitivity of GBM NS cell lines to natural killer, lectin‐dependent, antibody‐dependent and lymphokine‐activated lysis mediated by NK cells. A. GBM NS cell lines were incubated with human IgG (open histograms), TrastuzumAb and CetuximAb therapeutic antibodies (closed histograms), and stained with labeled antibodies against human IgG and then analyzed by flow cytometry. B. GBM NS cell lines were labeled with 51‐Cr and used as target cells in a 4‐h cell cytotoxicity assay with NK cells or IL2‐activated NK cells (□) as effectors. Effector cells were added alone (□) or in the presence of anti‐HLA‐ABC blocking antibodies (gray box), the lectin PHA (■), the therapeutic antibodies TrastuzumAb (○) or CetuximAb (gray round). C. Similar results were obtained with NK cells prepared from four different healthy donors. E : T ratio: 10:1. ***P < 0.01; *P < 0.05; ns = not statistically different (comparison with lysis with NK cells alone). For details, see the Figure 3 legend.
Figure S7. Sensitivity of MelanA‐loaded GBM NS cell lines to MelanA/HLA‐A2‐specific T cells. A. MelanA/HLA‐A2‐specific T cell lines were used as effectors in a 4‐h cell cytotoxicity assay against 51Cr‐labelled unloaded (□) or MelanA‐loaded (■) GBM NS cell lines in the absence or in the presence of blocking antibodies against HLA‐ABC (gray box). B. Results obtained with three different MelanA/HLA‐A2‐specific T cell lines. E : T ratio: 10:1. ***P < 0.01; ns = not statistically different (comparison with unloaded target cells). +++P < 0.01 (comparison with MelanA‐loaded target cells). For details, see the Figure 4 legend.
Figure S8. GBM NS cells are preferentially killed by lectin‐ and IL2‐activated NK cells. PKH26‐labelled GBM#3 (A) and #5 (B) NS or Adh cells alone or mixed at 1:1 ratio with their corresponding unlabeled NS or Adh cells were used as target cells in a 4‐h cytotoxicity assay with PHA‐ and IL2‐activated NK effector cells (for LDC and LAK lysis, respectively). Results are presented as percentages of specific lysis of the tested target cells. For details, see the Figure 6 legend.
Figure S9. Expression of NK receptor ligands, adhesion and immunoregulatory molecules on GBM NS and Adh primary cell lines. A. Heat‐map of the expression level of genes encoding for NK receptor ligands and adhesion molecules in NS and Adh primary cell lines. The expression values presented are normalized (noncentered) and log‐transformed intensities. B. Cells from NS and Adh GBM lines were stained with specific labeled antibodies against CD2, CD48, CD50, CD54, CD56, CD58, CD70, CD80, CD86, CD102 and PDL1, and then analyzed by flow cytometry. The mean of specific fluorescence intensity of the protein expression obtained in each NS and Adh cell line was determined as described in Figure 1 (n = 8 and 5, respectively). The thick gray bar indicates the mean of specific fluorescence intensity of protein expression obtained in all cell lines. Cell lines were considered as positive for the expression of proteins of interest when the specific fluorescence intensity was more than 2 (dashed line). For PDL1 expression, untreated and IFNγ‐treated cells were used. ***P < 0.01; *P < 0.05. ns = not statistically different.
Table S1. Amounts of CD133+ cells within GBM specimens*
Supporting info item
ACKNOWLEDGMENTS
We thank Stéphane Moiteaux and Guillaume Gapihan for their excellent technical assistance; the Biogenouest® microarray platform for the microarray analysis; Laurent Riffaud, Claire Haegelen and the medical staff of the Neurosurgery department of the CHU Pontchaillou (Rennes) for their contribution. G. Pope has post‐edited the English style.
Grant support: This work was supported by la Ligue Contre le Cancer Comité d'Ille‐et‐Villaine et du Maine‐et‐Loire, l'Institut National du Cancer (the “From the core to the margin” glioma project), la Région Bretagne and la fondation “Cancer, Aidez la recherche!”.
REFERENCES
- 1. Ahmed N, Salsman VS, Kew Y, Shaffer D, Powell S, Zhang YJ et al (2010) HER2‐specific T cells target primary glioblastoma stem cells and induce regression of autologous experimental tumors. Clin Cancer Res 16:474–485. [DOI] [PMC free article] [PubMed] [Google Scholar]
- 2. Alizadeh D, Zhang L, Brown CE, Farrukh O, Jensen MC, Badie B (2010) Induction of anti‐glioma natural killer cell response following multiple low‐dose intracerebral CpG therapy. Clin Cancer Res 16:3399–3408. [DOI] [PMC free article] [PubMed] [Google Scholar]
- 3. Aulwurm S, Wischhusen J, Friese M, Borst J, Weller M (2006) Immune stimulatory effects of CD70 override CD70‐mediated immune cell apoptosis in rodent glioma models and confer long‐lasting antiglioma immunity in vivo . Int J Cancer 118:1728–1735. [DOI] [PubMed] [Google Scholar]
- 4. Avril T, Jarousseau AC, Watier H, Boucraut J, Le Bouteiller P, Bardos P, Thibault G (1999) Trophoblast cell line resistance to NK lysis mainly involves an HLA class I‐independent mechanism. J Immunol 162:5902–5909. [PubMed] [Google Scholar]
- 5. Avril T, Saikali S, Vauleon E, Jary A, Hamlat A, De Tayrac M et al (2010) Distinct effects of human glioblastoma immunoregulatory molecules programmed cell death ligand‐1 (PDL‐1) and indoleamine 2,3‐dioxygenase (IDO) on tumour‐specific T cell functions. J Neuroimmunol 225:22–33. [DOI] [PubMed] [Google Scholar]
- 6. Bao S, Wu Q, McLendon RE, Hao Y, Shi Q, Hjelmeland AB et al (2006) Glioma stem cells promote radioresistance by preferential activation of the DNA damage response. Nature 444:756–760. [DOI] [PubMed] [Google Scholar]
- 7. Barcia C Jr, Gomez A, Gallego‐Sanchez JM, Perez‐Valles A, Castro MG, Lowenstein PR et al (2009) Infiltrating CTLs in human glioblastoma establish immunological synapses with tumorigenic cells. Am J Pathol 175:786–798. [DOI] [PMC free article] [PubMed] [Google Scholar]
- 8. Beier D, Rohrl S, Pillai DR, Schwarz S, Kunz‐Schughart LA, Leukel P et al (2008) Temozolomide preferentially depletes cancer stem cells in glioblastoma. Cancer Res 68:5706–5715. [DOI] [PubMed] [Google Scholar]
- 9. Belda‐Iniesta C, Carpeno JC, Saenz EC, Gutierrez M, Perona R, Baron MG (2006) Long term responses with cetuximab therapy in glioblastoma multiforme. Cancer Biol Ther 5:912–914. [DOI] [PubMed] [Google Scholar]
- 10. Biassoni R (2008) Natural killer cell receptors. Adv Exp Med Biol 640:35–52. [DOI] [PubMed] [Google Scholar]
- 11. Bleau AM, Hambardzumyan D, Ozawa T, Fomchenko EI, Huse JT, Brennan CW, Holland EC (2009) PTEN/PI3K/Akt pathway regulates the side population phenotype and ABCG2 activity in glioma tumor stem‐like cells. Cell Stem Cell 4:226–235. [DOI] [PMC free article] [PubMed] [Google Scholar]
- 12. Blery M, Olcese L, Vivier E (2000) Early signaling via inhibitory and activating NK receptors. Hum Immunol 61:51–64. [DOI] [PubMed] [Google Scholar]
- 13. Bonnet D, Dick JE (1997) Human acute myeloid leukemia is organized as a hierarchy that originates from a primitive hematopoietic cell. Nat Med 3:730–737. [DOI] [PubMed] [Google Scholar]
- 14. Brown CE, Starr R, Martinez C, Aguilar B, D'Apuzzo M, Todorov I et al (2009) Recognition and killing of brain tumor stem‐like initiating cells by CD8+ cytolytic T cells. Cancer Res 69:8886–8893. [DOI] [PMC free article] [PubMed] [Google Scholar]
- 15. Calabrese C, Poppleton H, Kocak M, Hogg TL, Fuller C, Hamner B et al (2007) A perivascular niche for brain tumor stem cells. Cancer Cell 11:69–82. [DOI] [PubMed] [Google Scholar]
- 16. Carlsten M, Malmberg KJ, Ljunggren HG (2009) Natural killer cell‐mediated lysis of freshly isolated human tumor cells. Int J Cancer 124:757–762. [DOI] [PubMed] [Google Scholar]
- 17. Castriconi R, Daga A, Dondero A, Zona G, Poliani PL, Melotti A et al (2009) NK cells recognize and kill human glioblastoma cells with stem cell‐like properties. J Immunol 182:3530–3539. [DOI] [PubMed] [Google Scholar]
- 18. Clarke MF, Dick JE, Dirks PB, Eaves CJ, Jamieson CH, Jones DL et al (2006) Cancer stem cells–perspectives on current status and future directions: AACR Workshop on cancer stem cells. Cancer Res 66:9339–9344. [DOI] [PubMed] [Google Scholar]
- 19. De Vleeschouwer S, Fieuws S, Rutkowski S, Van Calenbergh F, Van Loon J, Goffin J et al (2008) Postoperative adjuvant dendritic cell‐based immunotherapy in patients with relapsed glioblastoma multiforme. Clin Cancer Res 14:3098–3104. [DOI] [PubMed] [Google Scholar]
- 20. De Vleeschouwer S, Rapp M, Sorg RV, Steiger HJ, Stummer W, van Gool S, Sabel M (2006) Dendritic cell vaccination in patients with malignant gliomas: current status and future directions. Neurosurgery 59:988–999. [DOI] [PubMed] [Google Scholar]
- 21. Di Tomaso T, Mazzoleni S, Wang E, Sovena G, Clavenna D, Franzin A et al (2010) Immunobiological characterization of cancer stem cells isolated from glioblastoma patients. Clin Cancer Res 16:800–813. [DOI] [PMC free article] [PubMed] [Google Scholar]
- 22. Eguchi J, Hatano M, Nishimura F, Zhu X, Dusak JE, Sato H et al (2006) Identification of interleukin‐13 receptor alpha2 peptide analogues capable of inducing improved antiglioma CTL responses. Cancer Res 66:5883–5891. [DOI] [PubMed] [Google Scholar]
- 23. Ehtesham M, Black KL, Yu JS (2004) Recent progress in immunotherapy for malignant glioma: treatment strategies and results from clinical trials. Cancer Control 11:192–207. [DOI] [PubMed] [Google Scholar]
- 24. Eramo A, Ricci‐Vitiani L, Zeuner A, Pallini R, Lotti F, Sette G et al (2006) Chemotherapy resistance of glioblastoma stem cells. Cell Death Differ 13:1238–1241. [DOI] [PubMed] [Google Scholar]
- 25. Galli R, Binda E, Orfanelli U, Cipelletti B, Gritti A, De Vitis S et al (2004) Isolation and characterization of tumorigenic, stem‐like neural precursors from human glioblastoma. Cancer Res 64:7011–7021. [DOI] [PubMed] [Google Scholar]
- 26. Gerber DE, Choy H (2010) Cetuximab in combination therapy: from bench to clinic. Cancer Metastasis Rev 29:171–180. [DOI] [PubMed] [Google Scholar]
- 27. Ginzkey C, Eicker SO, Marget M, Krause J, Brecht S, Westphal M et al (2010) Increase in tumor size following intratumoral injection of immunostimulatory CpG‐containing oligonucleotides in a rat glioma model. Cancer Immunol Immunother 59:541–551. [DOI] [PMC free article] [PubMed] [Google Scholar]
- 28. Hadjipanayis CG, Van Meir EG (2009) Brain cancer propagating cells: biology, genetics and targeted therapies. Trends Mol Med 15:519–530. [DOI] [PMC free article] [PubMed] [Google Scholar]
- 29. Hasselbalch B, Lassen U, Hansen S, Holmberg M, Sorensen M, Kosteljanetz M et al (2010) Cetuximab, bevacizumab, and irinotecan for patients with primary glioblastoma and progression after radiation therapy and temozolomide: a phase II trial. Neuro Oncol 12:508–516. [DOI] [PMC free article] [PubMed] [Google Scholar]
- 30. Holland EC (2000) Glioblastoma multiforme: the terminator. Proc Natl Acad Sci U S A 97:6242–6244. [DOI] [PMC free article] [PubMed] [Google Scholar]
- 31. Hong X, Miller C, Savant‐Bhonsale S, Kalkanis SN (2009) Antitumor treatment using interleukin‐ 12‐secreting marrow stromal cells in an invasive glioma model. Neurosurgery 64:1139–1146. [DOI] [PubMed] [Google Scholar]
- 32. Hu J, Yuan X, Belladonna ML, Ong JM, Wachsmann‐Hogiu S, Farkas DL et al (2006) Induction of potent antitumor immunity by intratumoral injection of interleukin 23‐transduced dendritic cells. Cancer Res 66:8887–8896. [DOI] [PubMed] [Google Scholar]
- 33. Huang TT, Sarkaria SM, Cloughesy TF, Mischel PS (2009) Targeted therapy for malignant glioma patients: lessons learned and the road ahead. Neurotherapeutics 6:500–512. [DOI] [PMC free article] [PubMed] [Google Scholar]
- 34. Igarashi T, Wynberg J, Srinivasan R, Becknell B, McCoy JP Jr, Takahashi Y et al (2004) Enhanced cytotoxicity of allogeneic NK cells with killer immunoglobulin‐like receptor ligand incompatibility against melanoma and renal cell carcinoma cells. Blood 104:170–177. [DOI] [PubMed] [Google Scholar]
- 35. Ignatova TN, Kukekov VG, Laywell ED, Suslov ON, Vrionis FD, Steindler DA (2002) Human cortical glial tumors contain neural stem‐like cells expressing astroglial and neuronal markers in vitro . Glia 39:193–206. [DOI] [PubMed] [Google Scholar]
- 36. Ishikawa E, Tsuboi K, Saijo K, Harada H, Takano S, Nose T, Ohno T (2004) Autologous natural killer cell therapy for human recurrent malignant glioma. Anticancer Res 24:1861–1871. [PubMed] [Google Scholar]
- 37. Jordan CT, Guzman ML, Noble M (2006) Cancer stem cells. N Engl J Med 355:1253–1261. [DOI] [PubMed] [Google Scholar]
- 38. Kahlon KS, Brown C, Cooper LJ, Raubitschek A, Forman SJ, Jensen MC (2004) Specific recognition and killing of glioblastoma multiforme by interleukin 13‐zetakine redirected cytolytic T cells. Cancer Res 64:9160–9166. [DOI] [PubMed] [Google Scholar]
- 39. Kikuchi T, Akasaki Y, Abe T, Fukuda T, Saotome H, Ryan JL et al (2004) Vaccination of glioma patients with fusions of dendritic and glioma cells and recombinant human interleukin 12. J Immunother 27:452–459. [DOI] [PubMed] [Google Scholar]
- 40. Kruser TJ, Wheeler DL (2010) Mechanisms of resistance to HER family targeting antibodies. Exp Cell Res 316:1083–1100. [DOI] [PubMed] [Google Scholar]
- 41. Lanier LL, Chang C, Azuma M, Ruitenberg JJ, Hemperly JJ, Phillips JH (1991) Molecular and functional analysis of human natural killer cell‐associated neural cell adhesion molecule (N‐CAM/CD56). J Immunol 146:4421–4426. [PubMed] [Google Scholar]
- 42. Lapidot T, Sirard C, Vormoor J, Murdoch B, Hoang T, Caceres‐Cortes J et al (1994) A cell initiating human acute myeloid leukaemia after transplantation into SCID mice. Nature 367:645–648. [DOI] [PubMed] [Google Scholar]
- 43. Liau LM, Prins RM, Kiertscher SM, Odesa SK, Kremen TJ, Giovannone AJ et al (2005) Dendritic cell vaccination in glioblastoma patients induces systemic and intracranial T‐cell responses modulated by the local central nervous system tumor microenvironment. Clin Cancer Res 11:5515–5525. [DOI] [PubMed] [Google Scholar]
- 44. Liu G, Yuan X, Zeng Z, Tunici P, Ng H, Abdulkadir IR et al (2006) Analysis of gene expression and chemoresistance of CD133+ cancer stem cells in glioblastoma. Mol Cancer 5:67. [DOI] [PMC free article] [PubMed] [Google Scholar]
- 45. Martens T, Laabs Y, Gunther HS, Kemming D, Zhu Z, Witte L et al (2008) Inhibition of glioblastoma growth in a highly invasive nude mouse model can be achieved by targeting epidermal growth factor receptor but not vascular endothelial growth factor receptor‐2. Clin Cancer Res 14:5447–5458. [DOI] [PubMed] [Google Scholar]
- 46. McCord AM, Jamal M, Williams ES, Camphausen K, Tofilon PJ (2009) CD133+ glioblastoma stem‐like cells are radiosensitive with a defective DNA damage response compared with established cell lines. Clin Cancer Res 15:5145–5153. [DOI] [PMC free article] [PubMed] [Google Scholar]
- 47. Miller J, Eisele G, Tabatabai G, Aulwurm S, von Kürthy G, Stitz L et al (2010) Soluble CD70: a novel immunotherapeutic agent for experimental glioblastoma. J Neurosurg 113:280–285. [DOI] [PubMed] [Google Scholar]
- 48. Neyns B, Sadones J, Joosens E, Bouttens F, Verbeke L, Baurain JF et al (2009) Stratified phase II trial of cetuximab in patients with recurrent high‐grade glioma. Ann Oncol 20:1596–1603. [DOI] [PubMed] [Google Scholar]
- 49. Park DM, Rich JN (2009) Biology of glioma cancer stem cells. Mol Cells 28:7–12. [DOI] [PubMed] [Google Scholar]
- 50. Pellegatta S, Poliani PL, Corno D, Menghi F, Ghielmetti F, Suarez‐Merino B et al (2006) Neurospheres enriched in cancer stem‐like cells are highly effective in eliciting a dendritic cell‐mediated immune response against malignant gliomas. Cancer Res 66:10247–10252. [DOI] [PubMed] [Google Scholar]
- 51. Reilly KM, Rubin JB, Gilbertson RJ, Garbow JR, Roussel MF, Gutmann DH (2008) Rethinking brain tumors: the fourth Mouse Models of Human Cancers Consortium nervous system tumors workshop. Cancer Res 68:5508–5511. [DOI] [PMC free article] [PubMed] [Google Scholar]
- 52. Reya T, Morrison SJ, Clarke MF, Weissman IL (2001) Stem cells, cancer, and cancer stem cells. Nature 414:105–111. [DOI] [PubMed] [Google Scholar]
- 53. Roth P, Mittelbronn M, Wick W, Meyermann R, Tatagiba M, Weller M (2007) Malignant glioma cells counteract antitumor immune responses through expression of lectin‐like transcript‐1. Cancer Res 67:3540–3544. [DOI] [PubMed] [Google Scholar]
- 54. Saikali S, Avril T, Collet B, Hamlat A, Bansard JY, Drenou B et al (2007) Expression of nine tumour antigens in a series of human glioblastoma multiforme: interest of EGFRvIII, IL‐13Ralpha2, gp100 and TRP‐2 for immunotherapy. J Neurooncol 81:139–148. [DOI] [PubMed] [Google Scholar]
- 55. Singh SK, Clarke ID, Terasaki M, Bonn VE, Hawkins C, Squire J, Dirks PB (2003) Identification of a cancer stem cell in human brain tumors. Cancer Res 63:5821–5828. [PubMed] [Google Scholar]
- 56. Singh SK, Hawkins C, Clarke ID, Squire JA, Bayani J, Hide T et al (2004) Identification of human brain tumour initiating cells. Nature 432:396–401. [DOI] [PubMed] [Google Scholar]
- 57. Stupp R, Hegi ME, Mason WP, van den Bent MJ, Taphoorn MJ, Janzer RC et al (2009) Effects of radiotherapy with concomitant and adjuvant temozolomide vs. radiotherapy alone on survival in glioblastoma in a randomised phase III study: 5‐year analysis of the EORTC‐NCIC trial. Lancet Oncol 10:459–466. [DOI] [PubMed] [Google Scholar]
- 58. Ueda R, Ohkusu‐Tsukada K, Fusaki N, Soeda A, Kawase T, Kawakami Y, Toda M (2010) Identification of HLA‐A2‐ and A24‐restricted T‐cell epitopes derived from SOX6 expressed in glioma stem cells for immunotherapy. Int J Cancer 126:919–929. [DOI] [PubMed] [Google Scholar]
- 59. Uhl M, Aulwurm S, Wischhusen J, Weiler M, Ma JY, Almirez R et al (2004) SD‐208, a novel transforming growth factor beta receptor I kinase inhibitor, inhibits growth and invasiveness and enhances immunogenicity of murine and human glioma cells in vitro and in vivo . Cancer Res 64:7954–7961. [DOI] [PubMed] [Google Scholar]
- 60. Vitale M, Bottino C, Sivori S, Sanseverino L, Castriconi R, Marcenaro E et al (1998) NKp44, a novel triggering surface molecule specifically expressed by activated natural killer cells, is involved in non‐major histocompatibility complex‐restricted tumor cell lysis. J Exp Med 187:2065–2072. [DOI] [PMC free article] [PubMed] [Google Scholar]
- 61. Walzer T, Jaeger S, Chaix J, Vivier E (2007) Natural killer cells: from CD3(−)NKp46(+) to post‐genomics meta‐analyses. Curr Opin Immunol 19:365–372. [DOI] [PubMed] [Google Scholar]
- 62. Wei J, Barr J, Kong LY, Wang Y, Wu A, Sharma AK et al (2010) Glioma‐associated cancer‐initiating cells induce immunosuppression. Clin Cancer Res 16:461–473. [DOI] [PMC free article] [PubMed] [Google Scholar] [Retracted]
- 63. Wheeler CJ (2010) Dendritic cell vaccines to combat glioblastoma. Expert Rev Neurother 10:483–486. [DOI] [PubMed] [Google Scholar]
- 64. Wicha MS (2006) Cancer stem cells and metastasis: lethal seeds. Clin Cancer Res 12:5606–5607. [DOI] [PubMed] [Google Scholar]
- 65. Wischhusen J, Jung G, Radovanovic I, Beier C, Steinbach JP, Rimner A et al (2002) Identification of CD70‐mediated apoptosis of immune effector cells as a novel immune escape pathway of human glioblastoma. Cancer Res 62:2592–2599. [PubMed] [Google Scholar]
- 66. Wu A, Wiesner S, Xiao J, Ericson K, Chen W, Hall WA et al (2007) Expression of MHC I and NK ligands on human CD133+ glioma cells: possible targets of immunotherapy. J Neurooncol 83:121–131. [DOI] [PubMed] [Google Scholar]
- 67. Wu AH, Xiao J, Anker L, Hall WA, Gregerson DS, Cavenee WK et al (2006) Identification of EGFRvIII‐derived CTL epitopes restricted by HLA A0201 for dendritic cell based immunotherapy of gliomas. J Neurooncol 76:23–30. [DOI] [PubMed] [Google Scholar]
- 68. Xie Z, Chin LS (2008) Molecular and cell biology of brain tumor stem cells: lessons from neural progenitor/stem cells. Neurosurg Focus 24:E25. [DOI] [PubMed] [Google Scholar]
- 69. Yamanaka R (2009) Dendritic‐cell‐ and peptide‐based vaccination strategies for glioma. Neurosurg Rev 32:265–273. [DOI] [PubMed] [Google Scholar]
- 70. Yamanaka R, Abe T, Yajima N, Tsuchiya N, Homma J, Kobayashi T et al (2003) Vaccination of recurrent glioma patients with tumour lysate‐pulsed dendritic cells elicits immune responses: results of a clinical phase I/II trial. Br J Cancer 89:1172–1179. [DOI] [PMC free article] [PubMed] [Google Scholar]
- 71. Yamanaka R, Homma J, Yajima N, Tsuchiya N, Sano M, Kobayashi T et al (2005) Clinical evaluation of dendritic cell vaccination for patients with recurrent glioma: results of a clinical phase I/II trial. Clin Cancer Res 11:4160–4167. [DOI] [PubMed] [Google Scholar]
- 72. Yan X, Su Z, Zhang J, Wu Z, Ye S, Lu X et al (2010) Killing effect of interleukin‐13 receptor alpha 2 (IL‐13Ralpha2) sensitized DC‐CTL cells on human glioblastoma U251 cells. Cell Immunol 263:172–175. [DOI] [PubMed] [Google Scholar]
- 73. Yao Y, Tao R, Wang X, Wang Y, Mao Y, Zhou LF (2009) B7‐H1 is correlated with malignancy‐grade gliomas but is not expressed exclusively on tumor stem‐like cells. Neuro Oncol 11:757–766. [DOI] [PMC free article] [PubMed] [Google Scholar]
- 74. Yu JS, Liu G, Ying H, Yong WH, Black KL, Wheeler CJ (2004) Vaccination with tumor lysate‐pulsed dendritic cells elicits antigen‐specific, cytotoxic T‐cells in patients with malignant glioma. Cancer Res 64:4973–4979. [DOI] [PubMed] [Google Scholar]
- 75. Yuan X, Curtin J, Xiong Y, Liu G, Waschsmann‐Hogiu S, Farkas DL et al (2004) Isolation of cancer stem cells from adult glioblastoma multiforme. Oncogene 23:9392–9400. [DOI] [PubMed] [Google Scholar]
Associated Data
This section collects any data citations, data availability statements, or supplementary materials included in this article.
Supplementary Materials
Figure S1. Characterization of GBM primary cell lines. A. Cell morphology of NS and Adh cultures. B. Expression of stem cell and progenitor markers CD133, nestin, SOX2, SSEA1, A2B5 and NG2 on cells from NS and Adh GBM lines. For details, see the Figure 1 legend.
Figure S2. Differentiation capacity tumor xenograft generation of GBM NS primary cell lines. NS cell lines were grown for one week in a BMP4/serum‐containing medium. A. Differentiated NS cell lines were permeabilized and stained with antibodies against GFAP and β3‐tubulin, and then analyzed by fluorescence microscopy. DAPI was used to stain the nucleus. B. Untreated or BMP4/serum‐differentiated (open histograms with thick lines) cells from NS and Adh GBM lines were stained with isotype controls (open histograms) or specific labeled antibodies against GFAP and β3‐tubulin (closed histograms), and then analyzed by flow cytometry. A representative primary cell line GBM#2 is shown. C. The mean of specific fluorescence intensity of the protein expression obtained in each untreated (solid lines) or BMP4/serum‐treated (dashed lines) NS and Adh cell line was determined as described in Figure 1 (n = 8 and 5, respectively). The thick gray bar indicates the mean of specific fluorescence intensity of protein expression obtained in all cell lines. Cell lines were considered as positive for the expression of proteins of interest when the specific fluorescence intensity was more than 2 (dashed line). ***P < 0.01. GBM#2 NS cells were injected into the brain of nude mouse. D. Histological analysis of the GBM#2 NS xenograft after May–Giemsa staining of paraffin‐embedded sections. E. Immunohistochemistry staining of nestin and GFAP on GBM#2 NS xenograft sections.
Figure S3. Hierarchical clustering of the 46 differentially expressed genes in NS vs. Adh cell lines. Total mRNA of GBM NS and Adh cell lines were extracted and analyzed for a gene expression profile as described in Materials and Methods. A. The expression values presented are normalized and log‐transformed intensities. As expected, samples clustered into two distinct groups: the NS cells lines and the Adh cell lines. B. Functional annotation of the 46 differentially expressed genes in NS vs. Adh cell lines was obtained using the NIH‐DAVID Bioinformatics resources. The represented terms are limited to the biological process domain.
Figure S4. Expression of MHC molecules and tumor antigens on GBM primary cell lines. GBM NS and Adh GBM lines were stained with isotype controls (open histograms) or specific labeled antibodies against HLA‐ABC, HLA‐DR, IL13Rα2, EGFRvIII and EGFR (closed histograms), and then analyzed by flow cytometry. For EGFR expression, NS cell lines were grown for 48 h without (open histograms with thick lines) or with EGF (closed histograms). For details, see the Figure 2 legend.
Figure S5. Expression of MHC class I, EGFR, CD56 and CD58 molecules on CD133+ and CD133− CD45− tumor cells from GBM specimens. A. Freshly prepared GBM samples were stained with anti‐CD133 and anti‐CD45 antibodies and then analyzed by flow cytometry, after exclusion of 7AAD+ dead cells. Percentages of CD133+ and CD45+ cells with the GBM specimens are indicated in the corresponding gates. B. Defrosted GBM samples were labeled with anti‐HLA‐ABC, ‐EGFR, CD56 and CD58 in combination with anti‐CD133 and ‐CD45 antibodies and then analyzed by flow cytometry. Expressions of HLA‐ABC, EGFR, CD56 and CD58 molecules on GSC and other tumor cells were obtained after gating in CD45− CD133+ (dark gray histograms) and CD45− CD133− (gray histograms) cell populations. Values in the top‐right corners (in black for CD133+ cells and in gray of the other tumor cells) indicate the mean of specific fluorescence intensity of the protein expression studied.
Figure S6. Sensitivity of GBM NS cell lines to natural killer, lectin‐dependent, antibody‐dependent and lymphokine‐activated lysis mediated by NK cells. A. GBM NS cell lines were incubated with human IgG (open histograms), TrastuzumAb and CetuximAb therapeutic antibodies (closed histograms), and stained with labeled antibodies against human IgG and then analyzed by flow cytometry. B. GBM NS cell lines were labeled with 51‐Cr and used as target cells in a 4‐h cell cytotoxicity assay with NK cells or IL2‐activated NK cells (□) as effectors. Effector cells were added alone (□) or in the presence of anti‐HLA‐ABC blocking antibodies (gray box), the lectin PHA (■), the therapeutic antibodies TrastuzumAb (○) or CetuximAb (gray round). C. Similar results were obtained with NK cells prepared from four different healthy donors. E : T ratio: 10:1. ***P < 0.01; *P < 0.05; ns = not statistically different (comparison with lysis with NK cells alone). For details, see the Figure 3 legend.
Figure S7. Sensitivity of MelanA‐loaded GBM NS cell lines to MelanA/HLA‐A2‐specific T cells. A. MelanA/HLA‐A2‐specific T cell lines were used as effectors in a 4‐h cell cytotoxicity assay against 51Cr‐labelled unloaded (□) or MelanA‐loaded (■) GBM NS cell lines in the absence or in the presence of blocking antibodies against HLA‐ABC (gray box). B. Results obtained with three different MelanA/HLA‐A2‐specific T cell lines. E : T ratio: 10:1. ***P < 0.01; ns = not statistically different (comparison with unloaded target cells). +++P < 0.01 (comparison with MelanA‐loaded target cells). For details, see the Figure 4 legend.
Figure S8. GBM NS cells are preferentially killed by lectin‐ and IL2‐activated NK cells. PKH26‐labelled GBM#3 (A) and #5 (B) NS or Adh cells alone or mixed at 1:1 ratio with their corresponding unlabeled NS or Adh cells were used as target cells in a 4‐h cytotoxicity assay with PHA‐ and IL2‐activated NK effector cells (for LDC and LAK lysis, respectively). Results are presented as percentages of specific lysis of the tested target cells. For details, see the Figure 6 legend.
Figure S9. Expression of NK receptor ligands, adhesion and immunoregulatory molecules on GBM NS and Adh primary cell lines. A. Heat‐map of the expression level of genes encoding for NK receptor ligands and adhesion molecules in NS and Adh primary cell lines. The expression values presented are normalized (noncentered) and log‐transformed intensities. B. Cells from NS and Adh GBM lines were stained with specific labeled antibodies against CD2, CD48, CD50, CD54, CD56, CD58, CD70, CD80, CD86, CD102 and PDL1, and then analyzed by flow cytometry. The mean of specific fluorescence intensity of the protein expression obtained in each NS and Adh cell line was determined as described in Figure 1 (n = 8 and 5, respectively). The thick gray bar indicates the mean of specific fluorescence intensity of protein expression obtained in all cell lines. Cell lines were considered as positive for the expression of proteins of interest when the specific fluorescence intensity was more than 2 (dashed line). For PDL1 expression, untreated and IFNγ‐treated cells were used. ***P < 0.01; *P < 0.05. ns = not statistically different.
Table S1. Amounts of CD133+ cells within GBM specimens*
Supporting info item