

Abstract
Beta‐amyloid (Aβ) accumulation, neuroinflammation, basal forebrain cholinergic loss and hippocampal degeneration are well‐described pathologies associated with Alzheimer's disease (AD). However, the role that age plays in the susceptibility of the brain to these AD pathologies and the relationships between them is still not well understood. This study investigated the age‐related response to intracerebroventricular injection of Aβ25–35 in 3‐, 6‐ and 9‐month‐old rats. Aβ toxicity resulted in an age‐related increase in cholinergic loss and microglial activation in the basal forebrain along with neuronal loss in the hippocampal CA3 subfield. Performance in the Morris water maze revealed impairments in long‐term reference memory in 6‐month‐old Aβ administered animals, which was not seen in 3‐month‐old animals. These results support a role of Aβ administration in inducing age‐dependent cholinergic loss and neuroinflammation, and additionally provide evidence for a more age‐appropriate model of adult‐onset Aβ toxicity demonstrating pathological changes that reflect the early stages of AD pathogenesis including neuroinflammation, cholinergic loss and beginning stages of memory impairment.
Keywords: aging, beta‐amyloid, cholinergic loss, neuroinflammation
Introduction
Alzheimer's disease (AD) is a neurodegenerative disease and is the most common cause of dementia in the elderly. The histopathological hallmarks of AD include the presence of extracellular amyloid plaques, intracellular neurofibrillary tangles, inflammation, neuronal degeneration and loss, and synaptic dysfunction and failure 20, 35, 39. AD causes a large loss in brain weight and volume, with certain areas of the brain being affected more than others. One of the first neuronal populations identified as being vulnerable in AD was neurons synthesizing and releasing acetylcholine, namely cholinergic neurons 4, 38. Cholinergic loss correlates with cognitive impairment and behavioral disturbances in patients with dementia; and drugs that enhance cholinergic functioning have been shown to improve memory function both in animal models and in patients with AD 9, 27, 32. Specifically, cholinergic neurons in the basal forebrain that provide input to the hippocampus have been ascribed particular importance for learning and memory and are thought to be one of the first neuronal populations affected in the disease process 11, 31, 53. The basal forebrain cholinergic system is composed of cell bodies in the medial septal nucleus (MSN), the vertical and horizontal diagonal bands of Broca (VDB, HDB), and the nucleus basalis magnocellularis (NBM). The NBM innervates the neocortex and has minor projections to the olfactory bulb and amygdala. The HDB is the primary source of cholinergic projections to the olfactory bulb, whereas the MSN, and to a lesser extent the VDB, provides cholinergic input to the hippocampus 9, 25.
Studies of the pathological changes characterizing AD indicate that Aβ accumulation contributes to cholinergic dysfunction. Both single injection and chronic intracerebroventricular (ICV) infusion of Aβ have been shown to induce degeneration of cholinergic neurons in the basal forebrain and cause memory impairment in rats 10, 18, 41, 45. In addition to significant cholinergic neuronal loss, other studies have demonstrated decreases in choline acetyltransferase (ChAT) activity and acetylcholine release in the basal forebrain in response to Aβ administration, implicating Aβ as a contributor to basal forebrain cholinergic system neuropathology 22, 46, 58.
The precise molecular mechanism by which Aβ exerts its toxicity is still unclear; however, Aβ is thought to be one of the key contributors to the chronic inflammatory response in the AD brain. Changes in microglial morphology from a resting state to active state, along with astrocytosis, involving increases in number and size of astrocytes have been demonstrated in AD. Prolonged activation of microglia and astrocytes results in excessive release of pro‐inflammatory mediators and potentially neurotoxic substances including cytokines and chemokines, along with cell surface expression of MHC class II, activation of the complement pathway and production of reactive oxygen species 1, 5, 6, 46, 55. The relationship between Aβ‐induced neuroinflammation and its effect on the basal forebrain cholinergic system is still not fully understood. In this study, we investigate the consequences of Aβ administration on cholinergic neurons and neuroinflammation in the basal forebrain. In addition, we evaluate whether Aβ toxicity and basal forebrain cholinergic loss results in hippocampal damage. By evaluating this relationship, we may be better able to understand the events that precede hippocampal degeneration and dementia in the AD brain.
A rat model of acute ICV administration of Aβ25–35 has been developed and used as a model of some of the pathological and cognitive elements of AD. Aβ25–35 is the core neurotoxic fragment of Aβ, retaining many of the same biological and physical properties of the full‐length peptide 26, 33, 54. Use of this truncated peptide has been shown to induce neuroinflammation, neuronal cell death and synaptic loss similar to that seen with Aβ1–40 and Aβ1–42; however, its smaller length allows for better solubility and diffusion 23, 26. Previous studies have demonstrated the initial effectiveness of this nontransgenic rat model, with enhanced inflammatory responses, and Aβ neurotoxicity being observed in the brains of 3‐month‐old rats 2, 3, 8, 49, 50, 51, 52.
AD is an adult‐onset disease, and apart from genetic predisposition, aging is the most important risk factor for AD (20). With age comes an increased level of reactive oxygen species and decreased antioxidant functioning, glial activation, increased peroxisomal and mitochondrial dysfunction, and alterations in lipid and protein activity in the human brain 16, 19, 44. Each of these age‐related changes on their own is not sufficient to cause AD, but together they render the brain vulnerable to further insult. Aβ toxicity is one such insult thought to drastically alter many of the brain functions already affected by the aging process. In this study, we compare the pathological and cognitive impairments induced by exogenous Aβ toxicity in rats 3, 6 and 9 months of age, specifically examining the consequences of Aβ administration on inflammation and cholinergic neurons in the basal forebrain. In addition, we evaluate the effect of Aβ administration and basal forebrain cholinergic loss on neurodegeneration in the hippocampus.
Materials and Methods
Animals and treatment groups
All experimental procedures were carried out in accordance with the guidelines of the Canadian Council on Animal Care and were approved by Western University Animal Use Subcommittee. Male Wistar rats (Charles River, Montreal, QC, Canada) 3, 6 or 9 months of age were housed at a temperature of 22–24°C under a 12 h:12 h light : dark cycle. Rats were provided with food and water ad libitum. Animals 3, 6 and 9 months of age at the beginning of the study randomly received ICV injections of either Aβ25–35 (500 nmol in 25 μL) or reverse peptide (RP) Aβ35–25 (500 nmol in 25 μL). Surgical groups consisted of 3‐month‐old Aβ25–35 (n = 12), 3‐month‐old Aβ35‐25 (n = 11), 6‐month‐old Aβ25–35 (n = 12), 6‐month‐old Aβ35‐25 (n = 12), 9‐month‐old Aβ25–35 (n = 5) and 9‐month‐old Aβ35–25 (n = 6). All efforts were made to minimize the number of animals used.
Aβ preparation
Aβ25–35 (Aβ) or the RP Aβ35‐25 (Bachem, Torrance, CA, USA) was dissolved in sterile saline at a concentration of 21.2 μg/μL and then stored at −80°C until use. Aβ25–35 is the core neurotoxic fragment of the full‐length Aβ1–42 peptide and is the shortest Aβ peptide sequence that can form β‐sheet aggregated structures that retain biological activity comparable to full‐length Aβ 26, 34, 57. These truncated Aβ25–35 fragments are present in the brains of AD patients, but not in age‐matched controls 24, and have been shown to induce progressive pathology in the rodent brain 8, 49, 50, 51, 52, 59, 60. The Aβ25–35 fragment is a useful tool for studying Aβ toxicity as it induces toxicity similar to that of the full‐length Aβ fragments, whereas its shorter length allows for better diffusion and solubility 21, 23, 26. The reverse, physiologically inactive Aβ35–25 peptide was used as the control.
Aβ administration
Rats were weighed and then anesthetized in a Harvard anesthesia box with 3% isoflurane (Baxter Corporation, Mississauga, ON, Canada) and oxygen. Once anesthetized, rats were placed in a David Kopf stereotaxic apparatus and were kept under gas anesthesia with body temperature maintained at 37°C on a heating pad for the duration of the surgical procedure. The surface of the skull was exposed and bregma was located; injection sites were then identified based on the following coordinates with respect to bregma 30; −0.8 mm anterior/posterior, ± 1.4 mm medial/lateral and −4 mm dorsal/ventral (below dura). Aβ or RP was injected bilaterally into the lateral ventricles through a stainless steel cannula attached to a glass Hamilton syringe at a rate of 1 μL/30 s. The injection cannula was left in situ for 5 minutes following each injection, and then removed slowly. Following surgery, rats were administered subcutaneous injections of the analgesic Buprenorphine (0.03 mg/kg) and an intramuscular injection of the enrofloxacin antibiotic (30 μL of 50 mg/mL of stock) (Baytril; Bayer Inc., Toronto, ON, Canada).
Morris water maze (MWM)
Spatial learning and reference memory were assessed using the MWM 48, which consisted of a circular pool (146 cm in diameter, 58 cm high) in which rats were trained to escape from the water by swimming to a hidden platform. The pool was filled (36 cm high) with water and was virtually divided into four equivalent quadrants: northeast (NE), northwest (NW), southeast (SE) and southwest (SW). The water was made opaque using nontoxic blue paint and was maintained at a temperature of 21 ± 1°C. A digital video camera placed above the pool was used to monitor the location and swimming activity of the rats. The webcam was connected to a laptop for video recording, and behavioral parameters were measured using video‐tracking software (ANY‐maze®, Stoelting Co., Wood Dale, IL, USA). Animals underwent 4 days of spatial learning, two probe trials and 2 days of cued learning.
Spatial learning took place over 4 consecutive days beginning 8 days after ICV injections of Aβ or RP. The platform remained in the middle of the SW quadrant for the duration of the spatial acquisition trials. Distal extra‐maze cues were located around the room, with which rats could use to learn the location of the hidden platform. The spatial acquisition phase consisted of 16 training trials, with four trials per day for 4 days with an inter‐trial interval of 20 minutes. Rats were released from one of four start locations (N, SE, NW, E) in randomized order and were allowed to swim in search of the platform for 90 s. If the rat was unable to locate the platform in that time, they were guided to the platform and allowed to remain on it for 15 s before being removed from the pool.
Twenty‐four hours following the last spatial acquisition trial (day 12), rats were subjected to a probe trial where the platform was removed from the pool. Rats were released from a NE start position and were allowed to swim freely in the water for 30 s. On the 19th day, rats received an additional probe trial for 30 s to determine long‐term memory retention. Rats were once again released from the NE start position and were allowed to swim freely for 30 s. For both the first and the second probe trials, the amount of time spent and distance the rat travelled in the quadrant where the platform was previously located was tracked and analyzed. Swimming speed, total path length and path efficiency were also recorded. The time spent and/or the distance travelled in the target quadrant were taken as an index of rats' memory capacity. Rats were not trained during the time period between the first and second probe trial.
On days 20–21, rats were trained in a nonspatial cued version of the water maze. For cued training, rats received four trials per day for 2 days, with the location of the hidden platform and the rats start position varying with each trial. The platform location was not predictable based on extra‐maze cues, but instead based on the presence of a cue attached to the platform. Swimming speed, distance travelled and the latency to find the platform were recorded. Cued platform learning was used as a control procedure in order to determine if any differences in the MWM could be attributed to either a difference in motivation to escape the water or sensory‐motor biases. Testing in the MWM was completed with 3‐month‐old RP (n = 8), 3‐month‐old Aβ (n = 8), 6‐month‐old RP (n = 9) and 6‐month‐old Aβ (n = 9) animals.
Tissue preparation
Twenty‐one days following surgery, rats were weighed and then euthanized with an overdose of euthanyl (pentobarbital sodium, 54.7 mg/mL). Animals were perfused transaortically with 0.01 M phosphate buffer saline (PBS, pH 7.35, 100 mL) followed by 4% paraformaldehyde (pH 7.35, 300 mL). Brains were then removed and further fixed for 24 h in paraformaldehyde at 4°C, after which they were transferred to a 30% sucrose solution where they were kept for 3–5 days until sliced.
Histology and immunohistochemistry
Brains were then frozen on dry ice and sliced into 35‐μm serial coronal sections (from 3.2 to −4.8 mm relative to bregma according to the atlas of Paxinos and Watson), using a Leica CM 1850 Cryostat (Leica Biosystems, Concord, Ontario, Canada). Sections were then stored in cryoprotectant until use. For histological and immunohistochemical staining, representative sections from each treatment group were processed simultaneously to reduce variability between groups. For histology, sections were mounted on Superfrost micro slides, hydrated, stained in 0.5% thionin and then dehydrated and coverslipped.
Immunohistochemistry was performed on free‐floating brain sections. Briefly, sections were washed with 0.1 M PBS and then incubated with 3% hydrogen peroxide for 10 minutes at room temperature (RT), blocked in 2% horse serum solution (1:200, Vector Laboratories Inc., Burlingame, CA, USA) diluted in PBS with Triton‐X (PBST) for 1 h at RT and then incubated with primary antibodies diluted in 2% horse serum (PBST) for 48 h at 4°C on a shaker. A mouse monoclonal antibody against glial fibrillary acidic protein (GFAP; 1:1000, Sigma‐Aldrich, St. Louis, MO, USA) was used to assess astrocyte activation. Ramified microglia were detected using a mouse monoclonal antibody OX‐6, directed against the MHC II receptor (OX‐6; 1:1000, BD Pharmingen, Mississauga, ON, Canada). Monoclonal mouse anti‐choline acetyltransferase (ChAT; 1:500, Abcam, Cambridge, MA, USA) was used to detect cholinergic neurons. Following incubation with the primary antibody, sections were incubated with biotinylated anti‐mouse secondary antibody (1:2000, Vector Laboratories Inc., Burlingame, CA, USA) in 2% horse serum solution for 1 h at RT. Subsequently, sections were incubated for 1 h at RT with avidin‐biotinylated complex (ABC) reagent (Vector Laboratories Inc.) then visualized using 0.05% 3,3′‐diaminobenzidine tetrahydrochloride (Sigma‐Aldrich). Sections were then mounted onto slides, air‐dried and dehydrated in a graded series of ethanol, cleared in xylene and coverslipped using Depex (Electron Microscopy Sciences, Hatfield, PA, USA) mounting medium. Negative controls included all procedures with the exclusion of primary antibody.
Immunofluorescence
To confirm the specificity of OX‐6 microglia staining, dual label immunofluorescence for OX‐6 and Iba‐1 (ionized calcium binding adapter molecule 1) was completed. Briefly, tissue sections were washed with 0.1 M PBS and then blocked in antibody buffer (0.4% Triton‐X, 0.1% bovine serum albumin in PBS) for 1 h at RT, followed by incubation in rabbit anti‐Iba‐1 (Iba‐1; 1:1000, Wako Chemicals, Richmond, VA, USA) primary antibody for 1 h at RT and then overnight at 4°C. Sections were rinsed with PBS and incubated with goat anti‐rabbit Alexa Flour 488 (1:100, Life Technologies, Burlington, ON, Canada) for 1 h at RT and then washed with PBS and incubated with mouse anti‐OX‐6 primary for 1 h at RT. Subsequently, sections were incubated in donkey anti‐mouse Alexa Flour 594 (1:100, Life Technologies) for 1 h at RT and then washed with PBS. Stained sections were then mounted on slides, dried and cover‐slipped with Fluoroshield mounting media (Sigma‐Aldrich).
Imaging and quantification
Stained brain sections were photographed with a Leica DFC295 camera coupled to a Leica DM IRE2 microscope (Leica Microsystems Inc., Concord, ON, Canada) with Leica Application Suite Version 4.1.0 image analysis software (Leica Microsystems). Analysis and quantification was carried out by investigators blinded to the rat surgical identity using ImageJ 1.45 s software (Wayne Rasband, National Institute of Health, Bethesda, MD, USA). Areas of the brain examined included the anterior cortex, hippocampus, basal forebrain, thalamus, internal capsule, corpus callosum and the cerebral cortex. Further analysis and quantification was carried out specifically in the MSN and vertical diagonal band (VDB) of the basal forebrain (bregma level 0.7 to 0.2 mm), the CA1 and CA3 regions of the hippocampus (bregma level −3.14 to −3.8 mm), and the posterior thalamic, ventral posteromedial and ventral posterolateral thalamic nuclei (bregma level −3.14 to −3.8 mm) 30.
Images of OX‐6 immunoreactive microglia in the MSN/VDB, thalamus and internal capsule as well as ChAT‐positive neurons in the MSN/VDB were acquired. Images were taken from both the left and right sides of the brain for the thalamus and internal capsule. Observers blinded to the treatment groups completed cell counts from images by manually selecting positively stained cells in the predefined region of interest using ImageJ software. Four tissue sections per rat corresponding to the brain region of interest were used for analysis. For thionin‐stained sections, photomicrographs of the left and right CA1 and CA3 regions of the hippocampus were taken and the total number of undamaged neurons within the region were counted using ImageJ software. Two different observers counted the number of undamaged neurons in the CA1 and CA3 regions of the hippocampus; the observers completed the counts independently from one another and were blinded to the experimental conditions. Undamaged neurons were those cells with an intact cell membrane and full nucleus; only cells with a neuronal morphology were counted. Damaged neurons were recognized as cells that were misshapen and/or with nuclear changes (pyknosis, karyorrhexis and karyolysis). The number of undamaged neurons per optical field (neuronal density) was determined in four tissue sections per rat.
Images of GFAP‐positive astrocytes from both the left and the right sides of the CA1 and CA3 regions of the hippocampus were acquired. Densitometric analysis of GFAP immunohistochemistry staining was measured in 8‐bit converted images using ImageJ software in four tissue sections per rat. Optical density measurements of GFAP staining were taken as correlates of astrocytosis.
Statistical analysis
Statistical analysis was performed using GraphPad Prism 5.0 (La Jolla, CA, USA) for MAC OS X. Most data were analyzed by performing a one‐way or two‐way analysis of variance (ANOVA) (F‐values) followed by a Tukey's or Bonferroni post‐hoc test, respectively (P‐values). For evaluating the relationship between cholinergic neuronal number and microglial activation in the MSN/VDB, correlation analysis was performed (yielding a Pearson correlation coefficient and P‐value). Data are expressed as mean ± SEM, and a P < 0.05 was considered statistically significant.
Results
Neuroinflammation
Evaluation of microglial activation in the MSN/VDB was significantly different between ages and treatment groups (F 2,27 = 3.85, P < 0.03 for age; F 1,27 = 33.57, P < 0.0001 for treatment group; and i2,27 = 3.57, P < 0.04 for interaction). Bilateral ICV injections of Aβ in 6‐month‐old animals resulted in an increased number of OX‐6 positive microglia in the MSN/VDB of the basal forebrain in comparison to 6‐month‐old RP animals (P < 0.001). Activated microglia were also significantly higher in 9‐month‐old Aβ animals in comparison to 9‐month‐old RP animals (P < 0.05). This Aβ‐induced microglial activation was also age‐dependent, with 6‐month‐old Aβ animals showing significantly higher numbers of OX‐6 positive microglia in the MSN/VDB in comparison to 3‐month‐old Aβ animals (P < 0.05; Figure 1A,D). To confirm the microglia response observed with OX‐6 staining, an additional microglia marker, Iba‐1, which stains all microglia (activated and unactivated) was used. Qualitatively, Iba‐1 immunofluorescence of MSN/VDB basal forebrain regions revealed increased microglia density in the MSN/VDB of 6‐ and 9‐month‐old Aβ‐administered animals in comparison to 3‐month‐old Aβ administered animals. Dual OX‐6/Iba‐1 labeling of MSN/VDB forebrain regions was also completed, with all OX‐6 positive microglia being shown to be Iba‐1 positive (Figure 1C).
Figure 1.
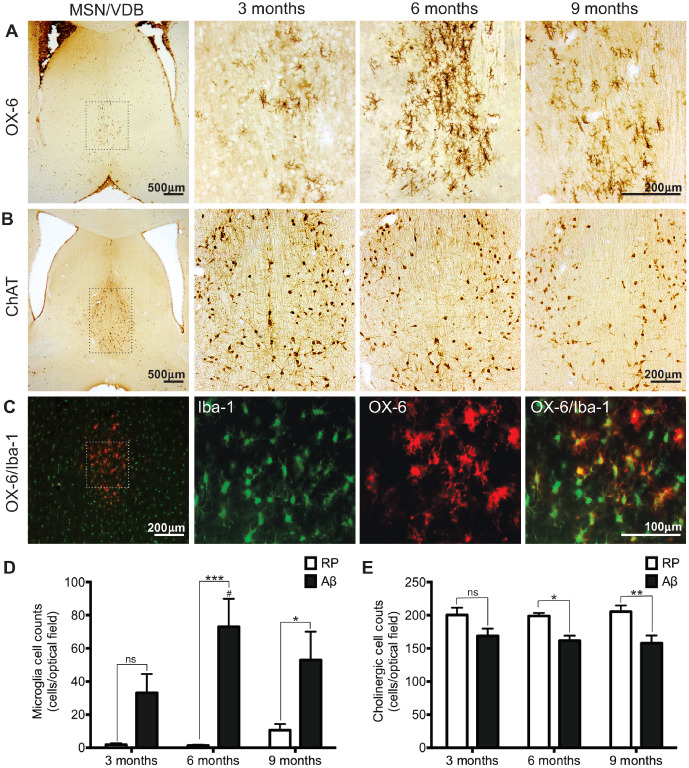
Basal forebrain pathology. Representative images of (A) OX‐6 immunopositive microglia and (B) choline acetyltransferase (ChAT) immunolabeled cholinergic neurons in the medial septal nucleus/vertical diagonal band (MSN/VDB) of the basal forebrain in Aβ25–35 administered animals 3, 6 and 9 months of age. C. Microglia in the MSN/VDB of a 6‐month‐old Aβ25–35 administered rat identified with two different microglia markers; OX‐6 and Iba‐1. All OX‐6 positive microglia co‐localized with Iba‐1 positive microglia. Boxed areas in low magnification images in panel 1 illustrate the location of high magnification pictures in panels 2–4. (D) The number of OX‐6 immunoreactive microglia and (E) the number of ChAT positive neurons in the MSN/VDB of Reverse peptide Aβ35–25 and Aβ25–35 administered rats, 3, 6 and 9 months of age. Data presented as mean ± SEM, n = 5–7 animals/group; *P < 0.05; **P < 0.01; ***P < 0.001; ns—not significant between treatment groups within an age group; #P < 0.05 6 months Aβ vs. 3 months Aβ.
In addition to the basal forebrain, increased microglial activation with age and Aβ toxicity was observed in other brain regions including the internal capsule and ventral posterolateral and ventral posteromedial thalamic nuclei (Table 1). Two‐way ANOVA of microglial activation in the thalamus and internal capsule showed a significant difference with age and treatment groups (thalamus: F 2,27 = 4.36, P < 0.02 for age; F 1,27 = 7.20, P < 0.01 for treatment group; and F 2,27 = 4.20, P < 0.03 for interaction; internal capsule: F 2,27 = 8.83, P < 0.001 for age; F 1,27 = 4.34, P < 0.05 for treatment group; and F 2,27 = 3.02, P > 0.05 for interaction). No differences in microglial activation in the internal capsule or thalamus were identified between treatment groups in animals 3 months of age. Six‐month‐old Aβ administered animals showed a significant increase in microglial activation in the thalamus and internal capsule compared with 6‐month‐old RP animals (P < 0.01). No significant differences in microglial activation between Aβ and RP animals 9 months of age were identified; however, the number of activated microglia in the internal capsule of 9‐month‐old RP and Aβ animals was higher than that seen in the corresponding 3 months treatment‐matched animals (P < 0.05). Six‐month‐old Aβ animals showed greater microglial activation in the thalamus and internal capsule than 3‐month‐old Aβ administered animals (P < 0.001, P < 0.01, respectively).
Table 1.
Microglial activation in Aβ and RP administered animals. Abbreviations: Aβ = beta‐amyloid; RP = reverse peptide; SEM = standard error of the mean
| 3 months | 6 months | 9 months | ||
|---|---|---|---|---|
| Thalamus | RP | 2.8 ± 0.95 | 4.10 ± 0.5 | 24.4 ± 5.6 |
| Aβ | 3.1 ± 0.92 | 89.1 ± 34.1** , ### | 44.6 ± 11.8 | |
| Internal capsule | RP | 51.25 ± 13.06 | 59.9 ± 8.2 | 101.4 ± 7.2# |
| Aβ | 53.9 ± 10.65 | 115.6 ± 17.2** , ## | 107.3 ± 14.3# | |
OX‐6 positive microglia were counted in the thalamus (ventro posteromedial and ventro posterolateral nuclei) and internal capsule in rats subjected to bilateral intracerebroventricular injections of Aβ25–35 or reverse peptide Aβ35‐25 at 3, 6 or 9 months of age. Data are presented as mean ± SEM, n = 5–6/group.
**P < 0.01 Aβ vs. RP animals of the same age.
#P < 0.05.
##P < 0.01.
###P < 0.001 vs. 3‐month‐old animals of the same treatment.
Cholinergic neurons
The prevalence of activated microglia selectively located in the MSN/VDB of the basal forebrain led to the evaluation of cholinergic neurons in that same region. Cholinergic neurons were stained using anti‐ChAT and counted in the region of the MSN/VDB. ChAT is the enzyme responsible for synthesizing acetylcholine and loss of ChAT staining indicates a loss of cholinergic neurons. Analysis showed a significant difference between treatment groups for cholinergic numbers in the MSN/VDB (F 2,30 = 0.12, P > 0.05 for age; F 1,30 = 26.22, P < 0.0001 for treatment group; and F 2,30 = 0.37, P > 0.05 for interaction). Cholinergic neuronal numbers were not significantly different between RP and Aβ administered rats 3 months of age. At 6 months, Aβ rats showed a significant decrease in cholinergic neurons compared with 6‐month‐old RP animals (P < 0.05). There was also a significant decrease in the number of cholinergic (ChAT positive) neurons in the MSN/VDB of 9‐month‐old Aβ administered rats compared with the 9‐month‐old RP group (P < 0.01; Figure 1B,E).
To determine if there was any correlation between number of activated microglia and cholinergic neuronal loss in the region of the MSN/VDB, correlation analysis was performed on all Aβ‐ and RP administered rats collectively. Correlation analysis yielded an r of −0.49 with a P < 0.0003, indicating that as the number of microglia in the region of the MSN/VDB increased, the number of cholinergic neurons in that same region decreased (Figure 2). Separation of Aβ and RP animals for correlation analysis revealed an r of −0.48 and a P < 0.01, for Aβ animals and an r of 0.087 for RP animals, indicating that the relationship of increased microglial activation and decreased cholinergic neuronal numbers was only true for Aβ animals in this study.
Figure 2.
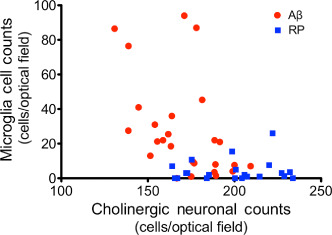
Relationship between number of choline acetyltransferase (ChAT)‐positive neurons and OX‐6 positive microglia in the medial septal nucleus/vertical diagonal band (MSN/VDB) of the basal forebrain in Aβ25–35 (n = 26) and control reverse peptide Aβ35‐25 (RP, n = 23) administered rats (correlation analysis, r = −0.49, P < 0.0003).
Hippocampal pathology
The effect of RP or Aβ administration on hippocampal neuronal density and morphology was assessed in thionin‐stained brain sections. Neuronal density in the CA1 and CA3 hippocampal subfields was determined by counting the number of surviving pyramidal neurons with intact cell membranes and a full nucleus. Two‐way ANOVA revealed a significant difference in CA3 neuronal numbers in the hippocampal subfield with age and treatment (F 2,30 = 6.41, P < 0.005 for age; F 1,30 = 22.90, P < 0.001 for treatment group; and F 2,30 = 2.28, P > 0.05 for interaction). No differences in neuronal cell counts in the CA3 region of the hippocampus were seen between groups in 3‐month‐old animals. Six‐month‐old Aβ administered rats showed a reduction in neuronal counts in the CA3 subfield of the hippocampus compared with 6‐month‐old RP injected animals (P < 0.05). Similarly, 9‐month‐old Aβ injected animals showed a significant decrease in neuronal counts in the CA3 subfield when compared to 9‐month‐old RP animals (P < 0.001). Six‐ and 9‐month‐old Aβ administered animals also showed a significant reduction in CA3 hippocampal neuronal counts in comparison to 3‐month‐old Aβ administered animals (P < 0.01 and P < 0.05; Figure 3E). Age and Aβ administration had no effect on the number of neurons or neuronal morphology in the CA1 hippocampal subfield (Figure 3B,D).
Figure 3.
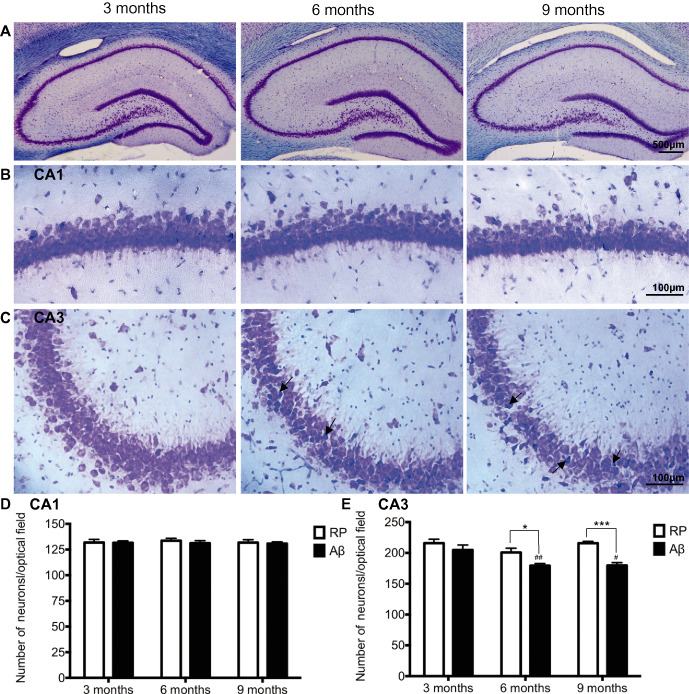
Hippocampal pathology. A–C. Representative photomicrographs of thionin stained CA1 and CA3 hippocampal subfields, in Aβ25–35 administered rats 3, 6 and 9 months of age. Arrows indicate representative misshapen/irregular neurons. D–E. Average numbers of hippocampal neuronal counts in the CA1 and CA3 subregions of the hippocampus, determined 3 weeks following intracerebroventricular administration of reverse peptide (RP) Aβ35‐25 or Aβ25–35 in 3, 6 and 9‐month‐old rats. Data presented as mean ± SEM, n = 6/7 animals/group; *P < 0.05; ***P < 0.001 between treatment groups within an age group; ##P < 0.01 6 months Aβ vs. 3 months Aβ; #P < 0.05 9 months Aβ vs. 3 months Aβ.
Astrocyte activation in the CA1 and CA3 subfields was evaluated to determine whether Aβ toxicity resulted in astrogliosis in these hippocampal regions. Optical density measurements of GFAP‐positive astrocytes in the CA3 region of the hippocampus revealed a 25 ± 8% increase in astrocyte density in 6‐month‐old Aβ animals compared with 6‐month‐old RP animals (P < 0.05). Nine‐month‐old Aβ administered animals showed only a minimal increase (6 ± 1.56%) in astrocyte density compared with 9‐month‐old RP animals (P > 0.05). Regardless of treatment, animals 3 months of age showed no differences in astrocyte density in the CA3 region of the hippocampus. No differences in astrocyte density were detected in the CA1 region of the hippocampus between age groups or treatment groups (data not shown).
Cognitive testing: MWM
Spatial learning along with short‐ and long‐term reference memory was assessed in the MWM for animals 3 and 6 months of age. To avoid the use of unnecessary numbers of animals, 9‐month‐old rats were not included in the cognitive testing since our initial pathological findings found that 6‐ and 9‐month‐old animals showed similar pathological changes with respect to cholinergic and hippocampal loss. Therefore, we expected that a demonstration of cognitive deficits in 6‐month‐old animals would also be seen in 9‐month‐old animals. Latency and distance travelled to find the hidden platform decreased significantly over the course of acquisition training for all groups, indicative of successful learning of the task (P < 0.001 day 1 vs. day 4 for all groups). There were no differences in latency or path length to find the platform between groups (Figure 4A,B). There were no differences in mean swimming speed between groups across training days (data not shown).
Figure 4.
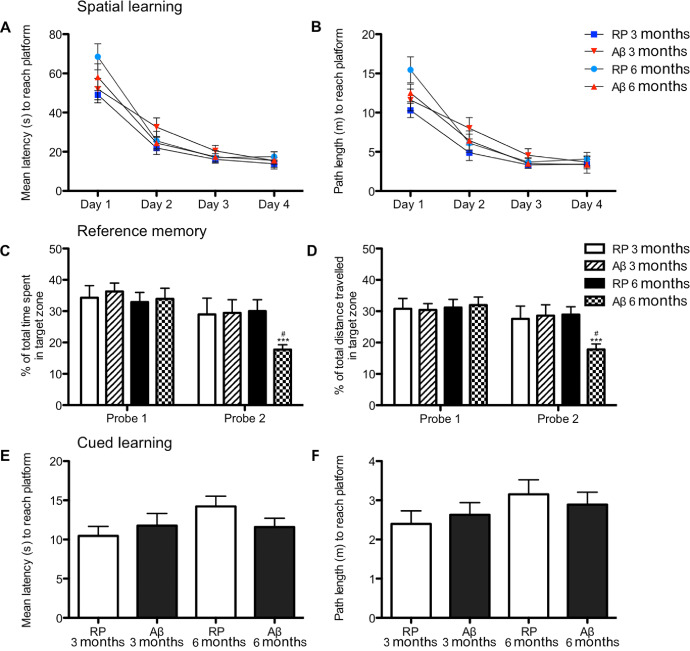
Cognitive impairment: Morris water maze (MWM). Learning and reference memory was assessed in the MWM in rats administered Aβ25–35 or the control reverse peptide (RP) Aβ35‐25 at 3 or 6 months of age. Spatial learning consisted of four trials per day for 4 consecutive days. (A) Mean latency and (B) path length to find the hidden platform in the MWM during spatial learning. Reference memory was measured as (C) the percentage of time spent and (D) the percentage of distance travelled in the quadrant where the platform was located 24 h following the last spatial learning trial (probe 1) and 8 days after the last spatial training trial (probe 2). (E) Latency to reach the platform and (F) path length to platform during the cued visible platform task. Data are presented as mean ± SEM, n = 8/9 animals/group; ***P < 0.001 for probe 1 vs. probe 2 within a group; #P < 0.05 within a probe trial, between groups.
To evaluate short‐term reference memory, rats were subjected to a probe trial (probe trial 1), 24 h following their last spatial learning trial. The percentage of time spent and the percentage of distance travelled in the target quadrant were taken as an index of rats' memory capacity. Two‐way ANOVA revealed a significant interaction of treatment group (Aβ vs. RP) and probe trials (probe 1 vs. probe 2) for percentage of distance travelled in the target zone (F 1,30 = 15.45, P < 0.0005 for probe trials; F 3,30 = 3.41, P < 0.05 for treatment group; and F 3,30 = 4.56, P < 0.001 for the interaction) and for percentage of time spent in the target zone (F 1,30 = 21.60, P < 0.0001 for probe trials; F 3,30 = 3.61, P < 0.05 for treatment group; and F 3.30 = 3.03, P < 0.05 for interaction). No differences in percentage of time spent or percentage of distance travelled in the target zone during probe 1 was identified between groups. To evaluate long‐term reference memory, an additional probe trial (probe 2) was given 1 week after the first probe trial. RP administered 3‐ and 6‐month‐old rats as well as 3‐month‐old Aβ administered animals travelled a greater distance in the target zone (all P < 0.05) than 6‐month‐old Aβ injected animals. To determine if there were any changes in reference memory across probe trials, performance on probe trial 1 was compared to that on probe 2 (Figure 4C,D). Six‐month‐old Aβ administered animals spent significantly less time (P < 0.01) and travelled a significantly shorter distance (P < 0.01) in the target zone during probe 2 compared to probe 1. No significant differences in time spent or distance travelled in the target quadrant between probe 1 and probe 2 was seen for 3‐month‐old RP, 3‐month‐old Aβ or 6‐month‐old RP administered animals.
To ensure that differences observed in the MWM were not attributed to either a difference in motivation to escape the water, or due to sensory‐motor deficits, cued learning using a visible platform was performed following the completion of the probe trials. Animals across groups showed no significant differences in the time it took them to locate the platform, or distance travelled to find the platform (Figure 4E,F). Average swimming speed was not significantly different between treatment groups (data not shown). Thus, regardless of age and Aβ administration, animals demonstrated similar motivation and abilities to escape from the water.
Discussion
The results of the present study demonstrate the age‐related consequences of Aβ toxicity on neuroinflammation, cholinergic loss and long‐term reference memory in rats. Aβ administration resulted in a significant increase in activated microglia in the MSN/VDB of 6‐ and 9‐month‐old rats in comparison to the control groups. Additionally, 6‐ and 9‐month‐old Aβ rats had an increase in microglial activation in this region when compared to 3‐month‐old treatment‐matched animals. Coinciding with microglial activation in the MSN/VDB of the basal forebrain was a significant decrease in the number of ChAT immunolabeled cholinergic neurons in Aβ administered animals 6 and 9 months of age. The interplay between neuroinflammation and cholinergic neuronal loss in the basal forebrain has not been extensively studied; however, neuroinflammation has been shown to occur in susceptible regions of the AD brain, and basal forebrain cholinergic cells have been shown to be selectively vulnerable to AD pathology 4, 38. In this study, microglial activation induced by Aβ toxicity was increased in the same region of the basal forebrain that displayed decreased cholinergic neuronal numbers. Correlation analysis revealed that as the number of activated microglia in the MSN/VDB increased, the number of cholinergic neurons in that same region decreased, suggesting that neuroinflammation and cholinergic degeneration may be linked.
Loss of cholinergic neurons in the MSN/VDB as demonstrated in 6‐ and 9 ‐month‐old rats is in agreement with previous studies that have demonstrated that both single injection and prolonged exposure to Aβ peptides induce degeneration of cholinergic neurons in vulnerable regions of the rodent forebrain 10, 18, 45, 47. Most of the studies examining cholinergic loss in response to Aβ toxicity however have directly injected Aβ peptides into various basal forebrain structures including the MSN and NBM 10, 37, 45. This study was able to demonstrate cholinergic hypofunction in the MSN/VDB in response to ICV Aβ administration. Demonstrating a loss of cholinergic neurons in association with microglial reactivity in the basal forebrain is of significance as it is believed to be one of the regions affected early in AD pathogenesis and may contribute to the cognitive impairment associated with the disease process.
Although these results would suggest that the microglial activation accompanying Aβ toxicity is related to cholinergic loss, there are other components of Aβ toxicity not examined in this study that could be responsible for the degeneration of cholinergic neurons. Studies have demonstrated that Aβ can interfere with and inhibit choline uptake and inhibit endogenous acetylcholine release directly, resulting in cholinergic hypofunction 22, 47. Additionally, release of reactive oxygen species, nitric oxide and excitatory amino acids have all been reported as consequences of Aβ toxicity and may contribute to cholinergic impairment 4. Degenerative changes in basal forebrain cholinergic neurons have also been reported as a consequence of age with a significant reduction in MSN/VDB cholinergic neurons being shown in age‐impaired rats compared with young animals 14, 15, 47. The rats used in this study may not have been of advanced enough age to demonstrate these age‐related cholinergic degenerative changes; however, the premise that cholinergic loss is not solely a consequence of neuroinflammatory processes is important to note.
Aβ‐induced toxicity was also associated with histopathological changes in the hippocampus. Thionin staining revealed a loss of pyramidal cells in the CA3 region of the hippocampus in Aβ administered 6‐ and 9‐month‐old animals. However, no changes in hippocampal cell numbers were identified in the CA1 hippocampal subfield. Cholinergic neurons in the basal forebrain are known to project to hippocampal CA1 and CA3 neurons. Thus, the loss of CA3 hippocampal neurons may be a consequence of decreased cholinergic projections from the MSN/VDB due to cholinergic loss in that area. The loss of hippocampal neurons in response to Aβ administration is in accordance with previous animal studies 43, 59, 60 and is consistent with the hippocampal loss observed in AD brains 54.
One pathological outcome measure not evaluated in this study was tau pathology. Based on the pathological definition of the disease, AD is characterized not only by abnormal Aβ accumulation but also by the presence of neurofibrillary tangles composed of hyperphosphorylated tau. This study did not evaluate tau‐related pathology, and focused primarily on Aβ pathology as Aβ accumulation is known to act upstream of and precede tau accumulation 20, 35. Evaluation of tau pathology in future work may be of importance in further validating the use of older animals and ICV Aβ administration as a model of AD.
Spatial learning and reference memory in rats 3 and 6 months of age were evaluated in the MWM. No differences in performance were identified between groups during the spatial learning task, indicating animals from all groups learned the task to the same degree. Other groups examining the learning capabilities of rats in the MWM following ICV injection of Aβ peptides, including Aβ25–35, have shown deficits in spatial learning 7, 12, 17, 28, 59, 60. The discrepancy between our finding and that of others could be attributed to differences in the time at which behavior testing was started, in this study spatial learning took place 8 days after Aβ injection, and thus the short time frame may not have been sufficient to allow for Aβ toxicity to impair spatial learning. Reference memory was assessed during the probe trials, with probe trial 1 being used to evaluate short‐term reference memory retention and probe trial 2 as an assessment of long‐term reference memory 29. Animals across age and treatment groups successfully remembered the platform location during the first probe trial, indicating normal memory consolidation. Additionally, no differences in performance between ages were identified, indicating at this time point, Aβ toxicity did not result in impairments in reference memory regardless of age. During the second probe trial, 6‐month‐old Aβ administered animals showed a decreased preference for the target zone compared to 3‐month‐old RP and Aβ administered animals and 6‐month‐old RP injected animals. Six‐month‐old Aβ injected animals also spent less time and travelled a shorter distance in the target zone during the second probe trial compared with the first probe trial. Thus, although Aβ toxicity did not induce full‐blown cognitive impairment, it did impair long‐term reference memory in 6‐month‐old animals. The deficits seen in long‐term reference memory could be a consequence of cholinergic neuronal loss in the MSN/VDB of the basal forebrain and CA3 neuronal loss in the hippocampus induced by Aβ toxicity in 6‐month‐old animals. Previous studies have demonstrated that lesions of the MSN and/or NBM of the basal forebrain and hippocampal damage impair MWM performance in rodents 13. The Aβ‐induced cholinergic deficits accompanied by impairments in long‐term reference memory in older animals demonstrated in this study are in accordance with the well‐described cholinergic dysfunction and memory impairments reported in AD.
Finally, the greater pathological changes seen in 6 and 9‐month‐old animals than in treatment matched 3‐month‐old animals demonstrates the importance of considering animal age when modeling Aβ toxicity. Six‐ and 9‐month‐old Aβ animals showed increased microglial activation in the thalamus and MSN/VDB, decreased number of cholinergic neurons in the basal forebrain, and a greater loss of CA3 hippocampal neurons than 3‐month‐old Aβ animals. The limited pathology seen in animals 3 months of age appears to contrast with some previously reported findings, which have demonstrated increased inflammation, cognitive deficits, hippocampal alterations and cholinergic impairment following ICV Aβ administration 41, 42, 56, 59. This study only showed minimal increases in microglial activation and a small loss of cholinergic neurons in the MSN/VDB in 3‐month‐old animals; however, this did not reach significance and was only modest compared with the older age groups. The discrepancy between our results and that of others could be attributed to the differences in amyloid preparations used in the study as many of these previous studies used pre‐aggregated Aβ whereas this study did not.
Nonetheless, the aim of this study was to determine whether 3‐, 6‐ and 9‐month‐old animals showed different pathological responses to Aβ toxicity. In light of the differences demonstrated, this study suggests that modeling Aβ toxicity in slightly older animals results in greater pathological changes. This is of importance because the majority of studies investigating Aβ toxicity in nontransgenic models of the disease administer Aβ in 2‐ to 3‐month‐old animals. However, AD is an adult‐onset disease that is prevalent in the elderly, with the most important nongenetic risk factor for late‐onset AD being age. A number of changes occur in the brain with age, including increased levels of reactive oxygen species increased production of inflammatory mediators, reduced functioning of antioxidant enzymes, and accumulation of modified lipids and proteins. While these changes alone may not manifest themselves as impairments, the progressive accumulation of them over time may alter the brain in such a way that renders it vulnerable to age‐associated disease processes 16, 19, 44. Interestingly, even at 6 and 9 months, we were able to show increased Aβ‐induced pathology, speaking to the important role that even these ages plays in rendering the brain vulnerable to insult. Although 6 and 9 months of age are not considered particularly old for a rat, these ages provide a more physiologically relevant equivalent to an adult brain than that of a 3‐month‐old animal, which could be considered to be a juvenile stage 36, 40. Therefore, ICV administration of Aβ in animals 6 or 9 month of age provides a model for adult‐onset Aβ toxicity with pathological changes that reflect the early stages of AD pathogenesis, including neuroinflammation, cholinergic loss and the beginning stages of memory impairment.
Acknowledgments
This research was supported by an emerging team grant from the Canadian Institutes of Health Research (CIHR, R1478A47) to D.F.C. We would like to thank Lin Wang for her invaluable technical assistance and Nathan Johnston for his assistance with thionin staining.
References
- 1. Akiyama H, Barger S, Barnum S, Bradt B, Bauer J, Cole GM et al (2000) Inflammation and Alzheimer's disease. Neurobiol Aging 21:383–421. [DOI] [PMC free article] [PubMed] [Google Scholar]
- 2. Amtul Z, Nikolova S, Gao L, Keeley RJ, Bechberger JF, Fisher AL et al (2014) Comorbid Abeta toxicity and stroke: hippocampal atrophy, pathology, and cognitive deficit. Neurobiol Aging 35:1605–1614. [DOI] [PubMed] [Google Scholar]
- 3. Amtul Z, Whitehead S, Keeley R, Bechberger J, Fisher A, McDonald R et al (2014) Co‐morbid rat model of ischemia and beta‐amyloid toxicity: striatal and cortical degeneration. Brain Pathol doi: 10.1111/bpa.12149; [Epub ahead of print]. [DOI] [PMC free article] [PubMed] [Google Scholar]
- 4. Auld DS, Kornecook TJ, Bastianetto S, Quirion R (2002) Alzheimer's disease and the basal forebrain cholinergic system: relations to beta‐amyloid peptides, cognition, and treatment strategies. Prog Neurobiol 68:209–245. [DOI] [PubMed] [Google Scholar]
- 5. Butterfield DA, Drake J, Pocernich C, Castegna A (2001) Evidence of oxidative damage in Alzheimer's disease brain: central role for amyloid beta‐peptide. Trends Mol Med 7:548–554. [DOI] [PubMed] [Google Scholar]
- 6. Cartier L, Hartley O, Dubois‐Dauphin M, Krause KH (2005) Chemokine receptors in the central nervous system: role in brain inflammation and neurodegenerative diseases. Brain Res Brain Res Rev 48:16–42. [DOI] [PubMed] [Google Scholar]
- 7. Chen SY, Wright JW, Barnes CD (1996) The neurochemical and behavioral effects of beta‐amyloid peptide(25–35). Brain Res 720:54–60. [DOI] [PubMed] [Google Scholar]
- 8. Cheng G, Whitehead SN, Hachinski V, Cechetto DF (2006) Effects of pyrrolidine dithiocarbamate on beta‐amyloid (25–35)‐induced inflammatory responses and memory deficits in the rat. Neurobiol Dis 23:140–151. [DOI] [PubMed] [Google Scholar]
- 9. Collerton D (1986) Cholinergic function and intellectual decline in Alzheimer's disease. Neuroscience 19:1–28. [DOI] [PubMed] [Google Scholar]
- 10. Colom LV, Castaneda MT, Banuelos C, Puras G, Garcia‐Hernandez A, Hernandez S et al (2010) Medial septal beta‐amyloid 1–40 injections alter septo‐hippocampal anatomy and function. Neurobiol Aging 31:46–57. [DOI] [PMC free article] [PubMed] [Google Scholar]
- 11. Coyle JT, Price DL, DeLong MR (1983) Alzheimer's disease: a disorder of cortical cholinergic innervation. Science 219:1184–1190. [DOI] [PubMed] [Google Scholar]
- 12. Delobette S, Privat A, Maurice T (1997) In vitro aggregation facilities beta‐amyloid peptide‐(25–35)‐induced amnesia in the rat. Eur J Pharmacol 319:1–4. [DOI] [PubMed] [Google Scholar]
- 13. D'Hooge R, De Deyn PP (2001) Applications of the Morris water maze in the study of learning and memory. Brain Res Brain Res Rev 36:60–90. [DOI] [PubMed] [Google Scholar]
- 14. Fischer W, Gage FH, Bjorklund A (1989) Degenerative changes in forebrain cholinergic nuclei correlate with cognitive impairments in aged rats. Eur J Neurosci 1:34–45. [DOI] [PubMed] [Google Scholar]
- 15. Fischer W, Chen KS, Gage FH, Bjorklund A (1992) Progressive decline in spatial learning and integrity of forebrain cholinergic neurons in rats during aging. Neurobiol Aging 13:9–23. [DOI] [PubMed] [Google Scholar]
- 16. Gemma C, Vila J, Bachstetter A, Bickford PC (2007) Oxidative stress and the aging brain: from theory to prevention. Chapter 15. In: Brain Aging: Models, Methods, and Mechanisms. Riddle DR (ed.), CRC Press: Boca Raton, FL. [PubMed] [Google Scholar]
- 17. Guo LL, Guan ZZ, Huang Y, Wang YL, Shi JS (2013) The neurotoxicity of beta‐amyloid peptide toward rat brain is associated with enhanced oxidative stress, inflammation and apoptosis, all of which can be attenuated by scutellarin. Exp Toxicol Pathol 65:579–584. [DOI] [PubMed] [Google Scholar]
- 18. Harkany T, De Jong GI, Soos K, Penke B, Luiten PG, Gulya K (1995) Beta‐amyloid (1–42) affects cholinergic but not parvalbumin‐containing neurons in the septal complex of the rat. Brain Res 698:270–274. [DOI] [PubMed] [Google Scholar]
- 19. Herrup K (2010) Reimagining Alzheimer's disease—an age‐based hypothesis. J Neurosci 30:16755–16762. [DOI] [PMC free article] [PubMed] [Google Scholar]
- 20. Huang Y, Mucke L (2012) Alzheimer mechanisms and therapeutic strategies. Cell 148:1204–1222. [DOI] [PMC free article] [PubMed] [Google Scholar]
- 21. Kaminsky YG, Kosenko EA (2008) Effects of amyloid‐beta peptides on hydrogen peroxide‐metabolizing enzymes in rat brain in vivo . Free Radic Res 42:564–573. [DOI] [PubMed] [Google Scholar]
- 22. Kar S, Slowikowski SP, Westaway D, Mount HT (2004) Interactions between beta‐amyloid and central cholinergic neurons: implications for Alzheimer's disease. J Psychiatry Neurosci 29:427–441. [PMC free article] [PubMed] [Google Scholar]
- 23. Kowall NW, McKee AC, Yankner BA, Beal MF (1992) In vivo neurotoxicity of beta‐amyloid [beta(1–40)] and the beta(25–35) fragment. Neurobiol Aging 13:537–542. [DOI] [PubMed] [Google Scholar]
- 24. Kubo T, Nishimura S, Kumagae Y, Kaneko I (2002) In vivo conversion of racemized beta‐amyloid ([D‐Ser 26]A beta 1–40) to truncated and toxic fragments ([D‐Ser 26]A beta 25–35/40) and fragment presence in the brains of Alzheimer's patients. J Neurosci Res 70:474–483. [DOI] [PubMed] [Google Scholar]
- 25. Mesulam MM, Mufson EJ, Wainer BH, Levey AI (1983) Central cholinergic pathways in the rat: an overview based on an alternative nomenclature (Ch1‐Ch6). Neuroscience 10:1185–1201. [DOI] [PubMed] [Google Scholar]
- 26. Millucci L, Raggiaschi R, Franceschini D, Terstappen G, Santucci A (2009) Rapid aggregation and assembly in aqueous solution of A beta (25–35) peptide. J Biosci 34:293–303. [DOI] [PubMed] [Google Scholar]
- 27. Minger SL, Esiri MM, McDonald B, Keene J, Carter J, Hope T, Francis PT (2000) Cholinergic deficits contribute to behavioral disturbance in patients with dementia. Neurology 55:1460–1467. [DOI] [PubMed] [Google Scholar]
- 28. Nabeshima T, Nitta A (1994) Memory impairment and neuronal dysfunction induced by beta‐amyloid protein in rats. Tohoku J Exp Med 174:241–249. [DOI] [PubMed] [Google Scholar]
- 29. Patil SS, Sunyer B, Hoger H, Lubec G (2009) Evaluation of spatial memory of C57BL/6J and CD1 mice in the Barnes maze, the multiple T‐maze and in the Morris water maze. Behav Brain Res 198:58–68. [DOI] [PubMed] [Google Scholar]
- 30. Paxinos G, Watson C (1986) The Rat Brain in Stereotaxic Coordinates. Academic Press, Inc.: San Diego, CA. [Google Scholar]
- 31. Pearson RC, Sofroniew MV, Cuello AC, Powell TP, Eckenstein F, Esiri MM, Wilcock GK (1983) Persistence of cholinergic neurons in the basal nucleus in a brain with senile dementia of the Alzheimer's type demonstrated by immunohistochemical staining for choline acetyltransferase. Brain Res 289:375–379. [DOI] [PubMed] [Google Scholar]
- 32. Perry EK, Tomlinson BE, Blessed G, Bergmann K, Gibson PH, Perry RH (1978) Correlation of cholinergic abnormalities with senile plaques and mental test scores in senile dementia. Br Med J 2:1457–1459. [DOI] [PMC free article] [PubMed] [Google Scholar]
- 33. Pike CJ, Walencewicz AJ, Glabe CG, Cotman CW (1991) In vitro aging of beta‐amyloid protein causes peptide aggregation and neurotoxicity. Brain Res 563:311–314. [DOI] [PubMed] [Google Scholar]
- 34. Pike CJ, Walencewicz‐Wasserman AJ, Kosmoski J, Cribbs DH, Glabe CG, Cotman CW (1995) Structure‐activity analyses of beta‐amyloid peptides: contributions of the beta 25–35 region to aggregation and neurotoxicity. J Neurochem 64:253–265. [DOI] [PubMed] [Google Scholar]
- 35. Querfurth HW, LaFerla FM (2010) Alzheimer's disease. N Engl J Med 362:329–344. [DOI] [PubMed] [Google Scholar]
- 36. Quinn R (2005) Comparing rat's to human's age: how old is my rat in people years? Nutrition 21:775–777. [DOI] [PubMed] [Google Scholar]
- 37. Scali C, Prosperi C, Giovannelli L, Bianchi L, Pepeu G, Casamenti F (1999) Beta(1–40) amyloid peptide injection into the nucleus basalis of rats induces microglia reaction and enhances cortical gamma‐aminobutyric acid release in vivo . Brain Res 831:319–321. [DOI] [PubMed] [Google Scholar]
- 38. Schliebs R (2005) Basal forebrain cholinergic dysfunction in Alzheimer's disease—interrelationship with beta‐amyloid, inflammation and neurotrophin signaling. Neurochem Res 30:895–908. [DOI] [PubMed] [Google Scholar]
- 39. Selkoe DJ (2001) Alzheimer's disease: genes, proteins, and therapy. Physiol Rev 81:741–766. [DOI] [PubMed] [Google Scholar]
- 40. Sengupta P (2011) A scientific review of age determination for a laboratory rat: how old is it in comparison to human age? Biomed Int 2:81–89. [Google Scholar]
- 41. Stepanichev M, Lazareva N, Tukhbatova G, Salozhin S, Gulyaeva N (2014) Transient disturbances in contextual fear memory induced by Abeta(25–35) in rats are accompanied by cholinergic dysfunction. Behav Brain Res 259:152–157. [DOI] [PubMed] [Google Scholar]
- 42. Stepanichev MY, Moiseeva YV, Lazareva NA, Onufriev MV, Gulyaeva NV (2003) Single intracerebroventricular administration of amyloid‐beta (25–35) peptide induces impairment in short‐term rather than long‐term memory in rats. Brain Res Bull 61:197–205. [DOI] [PubMed] [Google Scholar]
- 43. Stepanichev MY, Zdobnova IM, Zarubenko II, Moiseeva YV, Lazareva NA, Onufriev MV et al (2004) Amyloid‐beta(25–35)‐induced memory impairments correlate with cell loss in rat hippocampus. Physiol Behav 80:647–655. [DOI] [PubMed] [Google Scholar]
- 44. Swerdlow RH (2011) Brain aging, Alzheimer's disease, and mitochondria. Biochim Biophys Acta 1812:1630–1639. [DOI] [PMC free article] [PubMed] [Google Scholar]
- 45. Terranova JP, Kan JP, Storme JJ, Perreaut P, Le Fur G, Soubrie P (1996) Administration of amyloid beta‐peptides in the rat medial septum causes memory deficits: reversal by SR 57746A, a non‐peptide neurotrophic compound. Neurosci Lett 213:79–82. [DOI] [PubMed] [Google Scholar]
- 46. Tuppo EE, Arias HR (2005) The role of inflammation in Alzheimer's disease. Int J Biochem Cell Biol 37:289–305. [DOI] [PubMed] [Google Scholar]
- 47. Vaucher E, Aumont N, Pearson D, Rowe W, Poirier J, Kar S (2001) Amyloid beta peptide levels and its effects on hippocampal acetylcholine release in aged, cognitively‐impaired and ‐unimpaired rats. J Chem Neuroanat 21:323–329. [DOI] [PubMed] [Google Scholar]
- 48. Vorhees CV, Williams MT (2006) Morris water maze: procedures for assessing spatial and related forms of learning and memory. Nat Protoc 1:848–858. [DOI] [PMC free article] [PubMed] [Google Scholar]
- 49. Whitehead S, Cheng G, Hachinski V, Cechetto DF (2005) Interaction between a rat model of cerebral ischemia and beta‐amyloid toxicity: II. Effects of triflusal. Stroke 36:1782–1789. [DOI] [PubMed] [Google Scholar]
- 50. Whitehead SN, Hachinski VC, Cechetto DF (2005) Interaction between a rat model of cerebral ischemia and beta‐amyloid toxicity: inflammatory responses. Stroke 36:107–112. [DOI] [PubMed] [Google Scholar]
- 51. Whitehead SN, Bayona NA, Cheng G, Allen GV, Hachinski VC, Cechetto DF (2007) Effects of triflusal and aspirin in a rat model of cerebral ischemia. Stroke 38:381–387. [DOI] [PubMed] [Google Scholar]
- 52. Whitehead SN, Cheng G, Hachinski VC, Cechetto DF (2007) Progressive increase in infarct size, neuroinflammation, and cognitive deficits in the presence of high levels of amyloid. Stroke 38:3245–3250. [DOI] [PubMed] [Google Scholar]
- 53. Whitehouse PJ, Price DL, Struble RG, Clark AW, Coyle JT, Delon MR (1982) Alzheimer's disease and senile dementia: loss of neurons in the basal forebrain. Science 215:1237–1239. [DOI] [PubMed] [Google Scholar]
- 54. Wisse LE, Biessels GJ, Heringa SM, Kuijf HJ, Koek DH, Luijten PR et al (2014) Hippocampal subfield volumes at 7T in early Alzheimer's disease and normal aging. Neurobiol Aging doi: 10.1016/j.neurobiolaging.2014.02.021; [Epub ahead of print]. [DOI] [PubMed] [Google Scholar]
- 55. Wyss‐Coray T, Mucke L (2002) Inflammation in neurodegenerative disease—a double‐edged sword. Neuron 35:419–432. [DOI] [PubMed] [Google Scholar]
- 56. Yamaguchi Y, Kawashima S (2001) Effects of amyloid‐beta‐(25–35) on passive avoidance, radial‐arm maze learning and choline acetyltransferase activity in the rat. Eur J Pharmacol 412:265–272. [DOI] [PubMed] [Google Scholar]
- 57. Yankner BA, Dawes LR, Fisher S, Villa‐Komaroff L, Oster‐Granite ML, Neve RL (1989) Neurotoxicity of a fragment of the amyloid precursor associated with Alzheimer's disease. Science 245:417–420. [DOI] [PubMed] [Google Scholar]
- 58. Zheng WH, Bastianetto S, Mennicken F, Ma W, Kar S (2002) Amyloid beta peptide induces tau phosphorylation and loss of cholinergic neurons in rat primary septal cultures. Neuroscience 115:201–211. [DOI] [PubMed] [Google Scholar]
- 59. Zussy C, Brureau A, Delair B, Marchal S, Keller E, Ixart G et al (2011) Time‐course and regional analyses of the physiopathological changes induced after cerebral injection of an amyloid beta fragment in rats. Am J Pathol 179:315–334. [DOI] [PMC free article] [PubMed] [Google Scholar]
- 60. Zussy C, Brureau A, Keller E, Marchal S, Blayo C, Delair B et al (2013) Alzheimer's disease related markers, cellular toxicity and behavioral deficits induced six weeks after oligomeric amyloid‐beta peptide injection in rats. PLoS ONE 8:e53117. [DOI] [PMC free article] [PubMed] [Google Scholar]