

Abstract
Papillary tumor of the pineal region (PTPR) is a neuroepithelial brain tumor, which might pose diagnostic difficulties and recurs often. Little is known about underlying molecular alterations. We therefore investigated chromosomal copy number alterations, DNA methylation patterns and mRNA expression profiles in a series of 24 PTPRs. Losses of chromosome 10 were identified in all 13 PTPRs examined. Losses of chromosomes 3 and 22q (54%) as well as gains of chromosomes 8p (62%) and 12 (46%) were also common. DNA methylation profiling using Illumina 450k arrays reliably distinguished PTPR from ependymomas and pineal parenchymal tumors of intermediate differentiation. PTPR could be divided into two subgroups based on methylation pattern, PTPR group 2 showing higher global methylation and a tendency toward shorter progression‐free survival (P = 0.06). Genes overexpressed in PTPR as compared with ependymal tumors included SPDEF, known to be expressed in the rodent subcommissural organ. Notable SPDEF protein expression was encountered in 15/19 PTPRs as compared with only 2/36 ependymal tumors, 2/19 choroid plexus tumors and 0/23 samples of other central nervous system (CNS) tumor entities. In conclusion, PTPRs show typical chromosomal alterations as well as distinct DNA methylation and expression profiles, which might serve as useful diagnostic tools.
Keywords: copy number alterations, DNA methylation, ependymoma, mRNA expression, papillary tumor of the pineal region, prognosis, SPDEF
Introduction
Papillary tumor of the pineal region (PTPR) is a rare neuroepithelial tumor first described by Jouvet et al. in 2003, which was included in the World Health Organization (WHO) classification in 2007 10, 15. On histopathological examination, PTPR is characterized by an epithelial‐like, loose papillary growth pattern. Expression of cytokeratins is typical, whereas expression of epithelial membrane antigen (EMA) and glial fibrillary acidic protein (GFAP) is less common 10. On electron microscopy, abundant rough endoplasmic reticulum with secretory granules, microvilli and perinuclear intermediate filaments have been described 1, 10. Because of its location, papillary structure, immunohistochemical staining profile and ultrastructural features, an origin from the specialized ependymal cells of the subcommissural organ has been suggested 10. However, PTPR also shares histological and immunohistochemical features with other entities such as ependymomas and pineal parenchymal tumors 6, 14, which may result in diagnostic difficulties especially in small biopsy samples. After surgical resection, PTPR often recurs 3. Thus, far little is known on the prognostic value of histopathological features in PTPR. This uncertainty is also reflected by the current WHO classification, which allows for grading of PTPR as grade II or grade III 15. Recently, increased mitotic and proliferative activities have been shown to be associated with shorter progression‐free survival 7, but underlying tumorigenic mechanisms remain unclear 5, 6. We thus aimed to investigate chromosomal alterations, DNA methylation patterns and mRNA profiles as well as their potential diagnostic and prognostic values in PTPR.
Materials and Methods
Samples
Formalin fixed paraffin embedded (FFPE) samples from 24 cases with a file diagnosis of PTPR were retrieved from the archives of the Institute of Neuropathology of the University Hospital Münster, and the Centre de Pathologie et Neuropathologie Est, Hospices Civils de Lyon, Bron, as well as from further institutions in France, Germany, the Netherlands and Switzerland (see also Acknowledgments). From two of these cases, only fresh‐frozen material was available. Data on postoperative course and outcome (progression‐free survival and overall survival) were compiled by reviewing patient records. Follow‐up information on 11 PTPRs, which had been included in previous studies 3, 6, 7, was updated (see Supporting Information Table S1). The study received local ethical board approval (Münster 2012‐661‐f‐S).
Histopathology
Histopathology was reviewed according to current WHO criteria 15. Mitotic and proliferative activities were independently assessed by two raters (MH and SH) as described previously 7. Increased mitotic activity was defined as the presence of three or more mitoses/10 high‐power fields (HPFs). Proliferative activity was assessed using Ki67/MIB1 immunohistochemistry [Anti‐Ki67 (clone MIB, DAKO, Glostrup, Denmark), concentration 1:100, boiling pretreatment at pH 6.1] on an automated staining system (DAKO). For SPDEF immunohistochemistry, a rabbit polyclonal antibody [TA324209 (OriGene Technologies, Rockville, MD, USA)] was used at a concentration of 1:200 with boiling pretreatment in citrate buffer on an automated staining system. SPDEF immunohistochemistry was performed on 19 PTPR samples as well as to 20 ependymomas, 16 anaplastic ependymomas, 9 choroid plexus papillomas, 5 atypical choroid plexus papillomas, 5 choroid plexus carcinomas, 3 astroblastomas, 5 atypical teratoid/rhabdoid tumors, 3 pineocytomas, 3 pineal parenchymal tumors of intermediate differentiation (PPTID), and 9 papillary craniopharyngiomas that had been retrieved from the archives of the Institute of Neuropathology Münster. Staining intensity was rated as strong (+++), moderate (++), weak (+) or absent (−). Furthermore, the staining pattern (ie, presence of cytoplasmic and/or membranous SPDEF staining) was evaluated.
MIP SNP array
For molecular inversion probe single nucleotide polymorphism (MIP SNP) analysis, genomic DNA was isolated from FFPE samples using the Maxwell 16 FFPE Plus LEV DNA Purification Kit (Promega, Mannheim, Germany). A total of 75 ng DNA was submitted to OncoScan FFPE Express analysis (Affymetrix, Santa Clara, CA, USA). The MIP SNP array was performed as previously described 19. Data of 13 PTPR samples passed quality control criteria (median absolute pairwise difference (MAPD) value ≤ 0.6) and were further analyzed using Nexus 7 Copy Number Software (Biodiscovery, Hawthorne, CA, USA) with NCBI build 37 of the human genome. The SNP‐FASST2 segmentation algorithm and default settings for significance and number of probes per segment were used. Quadratic correction was chosen for systematic correction. The minimum loss of heterozygosity (LOH) requirement was set to 500 kb. By default, probe sets were centered to the median for all samples.
PTEN sequencing
For sequencing of exon 7 of the PTEN gene, genomic DNA was isolated from FFPE samples using the Maxwell 16 FFPE Plus LEV DNA Purification Kit. Amplification of PTEN exon 7 PCR products was carried out with 100 ng of genomic DNA and the following PCR primers: 5′‐GTTTGACAGTTAAAGGCATTTCC‐3′ and 5′‐CTCCCAATGAAAGTAAAGTACAAAC‐3′. PCRs were conducted with the GeneAmp® Fast PCR Master Mix (Life Technologies, Carlsbad, CA, USA). PCR conditions were chosen as follows: initial denaturation at 95°C for 10 s, denaturation at 94°C for 10 s and annealing at 63°C for 20 s for 40 cycles. Subsequent to the PCR amplification, PCR products were purified with MultiScreen® PCRμ96 Filter Plates (Merck Millipore, Darmstadt, Germany). Sequencing PCRs were performed with an initial denaturation at 96°C for 1 minute for 25 cycles at 96°C for 10 s, 50°C for 5 s and 60°C for 1.15 minutes using the BigDye® Terminator v3.1 Mix Cycle Sequencing Kit (Life Technologies) and the gene‐specific primers mentioned above for. After purification with MultiScreen‐HV Plates (Merck Millipore) and Sephadex G‐50 (GE Healthcare, Chalfont St Giles, UK) the PCR products were sequenced using a 96‐capillary 3730xl DNA Analyzer (Life Technologies).
Illumina 450K array
A total of 22 PTPRs were analyzed using the Illumina Infinium HumanMethylation450 Bead Chip according to the manufacturer's instruction at the German Cancer Research Center (DKFZ) Genomics and Proteomics Core Facility. The following criteria were applied to filter the data: removal of probes targeting sex chromosomes, removal of probes containing a single‐nucleotide polymorphism (dbSNP132 Common) within five base pairs of and including the targeted CpG‐site (n = 24 536), and probes not uniquely mapping to the human reference genome (hg19) allowing for one mismatch (n = 9993). In total, 438 370 probes were kept for analysis. Methylation data of the 22 PTPRs were compared with that of supratentorial ependymomas with C11orf95–RELA translocations (EPN_RELPOS; n = 10), ependymomas of posterior fossa group A (EPN_PFA, n = 10) and posterior fossa group B (EPN_PFB, n = 9) as well as PPTID (n = 11, five WHO grade II PPTID). Unsupervised agglomerative hierarchical clustering was performed using the Euclidean distances between samples calculated over the beta values of the 10 000 most variable methylated probes as measured by median absolute deviation (MAD). The cluster dendrogram was formed by using average linkage as agglomeration method. To reorder probes for the heatmap visualization, probes were clustered by agglomerative hierarchical clustering using 1‐centered Pearson correlation as distance measure and average linkage as agglomeration method. To establish summarized methylation values on the gene level, Ensembl gene annotations (release 64) were obtained from BioMart (http://www.biomart.org/). Probes within ± 5 kb of the transcription start site (TSS) of all protein‐coding genes were collapsed by taking the median of the 25% most variably methylated probes, as measured by MAD. This is similar to the approach used by Sturm et al. 18. In order to identify genes which are differentially methylated between PTPR group 1 and PTPR group 2, Student's t‐test was applied. To meet the normality assumption of the t‐test, collapsed beta values were transformed using the M‐value transformation. Correction for multiple testing was performed using the Benjamini–Hochberg method. Genes were considered significantly differentially methylated between groups when displaying an false discovery rate (FDR)‐adjusted P‐value < 0.05.
Expression array analysis
Expression array data were generated for four PTPR samples where good quality RNA from frozen tissue was available. The RNAs were run on the Affymetrix GeneChip Human Genome U133 Plus 2.0 Array at the Microarray Department of the University of Amsterdam, the Netherlands. Sample library preparation, hybridization and quality control were performed according to the manufacturer's protocols. The MAS5.0 algorithm of the GCOS program (Affymetrix Inc.) was used for normalization and assignment of detection P‐values. Array quality was ensured by inspection of beta‐actin and GAPDH 5′‐3′ ratios as well as the percentage of present calls. Analysis of differential expression between PTPR (n = 4) and ependymoma [n = 263; both published 9, 20 and unpublished data provided on an early‐access basis] was performed via the publicly available R2 software tool (http://r2.amc.nl). Differential expression was calculated from log2‐transformed expression values using an FDR‐corrected P‐value of 0.00001 (ANOVA), taking one probe set per gene. Only genes scored as “present” in at least three samples were considered.
Further statistical analysis
For comparison of clinical and histopathological factors between two PTPR subgroups, Fisher's exact test or Student's t‐test was used. For comparison of genetic alterations, the comparisons (paired) feature of Nexus software and Fisher's exact test were employed. The proportion of hypermethylated genes was compared using chi‐square test. Survival analysis was performed using Kaplan–Meier estimation of survival curves and the log‐rank test. P‐values < 0.05 were considered statistically significant.
Results
PTPRs occur mainly in the third and fourth decades and often recur after surgery
The median age of the 13 females and 11 males was 32 years (range 5–63 years; for patient characteristics see Table 1 and Supporting Information Table S1). On histopathological examination, all tumors were characterized by loose papillary structures and tumor cells forming broad perivascular processes showing cytokeratin expression. Increased mitotic activity (≥3 mitoses per 10 HPFs) was encountered in 9/22 tumors (41%), increased proliferative activity (Ki67/MIB1 index ≥ 10%) in 7/22 tumors (32%). Eleven of 23 patients experienced progression (48%), two died due to tumor‐related causes (9%). Estimated progression‐free survival was 79 (48–110) months (mean, 95% confidence interval). Among the clinical and histopathological factors examined, increased proliferative activity [Ki67/MIB1 ≥ 10%; 32 (9–55) months vs. 105 (65–145) months] was associated with shorter progression‐free survival (P = 0.005).
Table 1.
Patient characteristics. Patient characteristics, histopathological features, treatment, outcome and array data availability in a series of papillary tumors of the pineal region (PTPR) (n = 24)
| Patient characteristics | |
| Age (years, median, range) | 32 (5–63) |
| Sex (male : female) | 11:13 |
| Histopathology FFPE | |
| Increased mitotic activity (≥3 mitosis/10 HPF) | 9/22 (41%) |
| Increased proliferative activity (Ki67 ≥10%) | 7/22 (32%) |
| Treatment | |
| Gross total resection | 12/24 (50%) |
| Radiotherapy | 10/24 (42%) |
| Chemotherapy | 2/24 (8%) |
| Outcome (available for 23/24 patients) | |
| Progression | 11/23 (48%) |
| Death | 2/23 (9%) |
| Array data | |
| Methylation data (450k array) | 22/24 (91%) |
| CNV data (OncoScan) | 13/24 (60%) |
| mRNA expression data (Affymetrix) | 4/24 (17%) |
| Methylation data and CNV data | 11/24 (46%) |
| Methylation data and mRNA expression data | 4/24 (17%) |
PTPRs show typical genetic alterations
Losses of chromosome 10 were found in all 13 PTPRs, for which MIP SNP array data could be generated. Losses of chromosome 3 and chromosome 22q (each 54%), as well as gains of chromosome 8p (62%), chromosome 8 (54%) and chromosome 12 (46%), were also frequent (Figure 1). Among these aberrations, only 8p gain was associated with progression‐free survival [43 (22–64) vs. 92 (64–120) months; mean (95% confidence interval), log‐rank test P = 0.03]. Losses of chromosome 10 have been recently linked to exon 7 mutations of the PTEN gene in PTPR 4. However, on sequencing of 11 PTPR cases for which DNA of sufficient quality was available, no PTEN exon 7 mutations could be identified.
Figure 1.
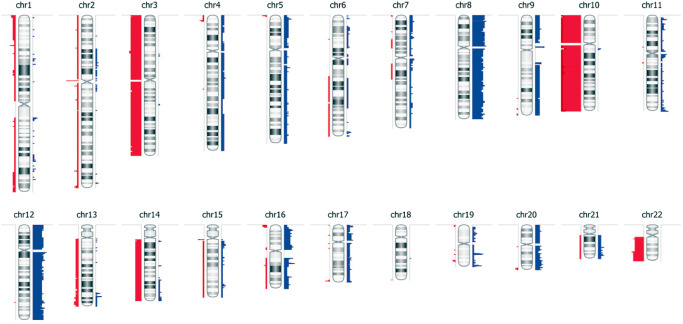
Genetic alterations in papillary tumors of the pineal region (PTPR): virtual karyogram showing the frequency of copy number losses (red bars) as well as gains (blue bars) as determined by molecular inversion probe single‐nucleotide polymorphism microarray. Bar width correlates with the frequency of the corresponding event (n = 13).
Methylation profiling discriminates PTPR from other tumor entities
On clustering analysis of methylation profiles, PTPR formed a distinct group, differing from supratentorial ependymomas with C11orf95–RELA translocations (EPN_RELPOS) 17 and ependymomas of posterior fossa group A (EPN_PFA) and posterior fossa group B (EPN_PFB) 20 as well as PPTID (Figure 2). Furthermore, within the group of PTPR, two subgroups could be identified: PTPR group 1 and PTPR group 2. As shown in Table 2, these PTPR subgroups did not differ with regard to clinical (age, sex), histopathological features (mitotic and proliferative activity) and chromosomal alterations. Of note, however, mean progression‐free survival of PTPR group 1 tended to be longer as compared with PTPR group 2 (125 months vs. 43 months, P = 0.056). We next examined genes that were differentially methylated between PTPR group 1 and PTPR group 2 (Supporting Information Table S2). A gene‐centric approach was utilized using the top 25% most variant probes for each gene (± 5 kb of the TSS). Among the top 2529 genes significantly differentially methylated (FDR‐adjusted P‐values < 0.05), only 12% genes were found to be hypermethylated in PTPR group 1 as compared with 88% genes hypermethylated in PTPR group 2, suggesting an overall higher methylation level in PTPR group 2 (Table 2 and Supporting Information Figure S1).
Figure 2.

Methylation profiling of papillary tumors of the pineal region (PTPR): heatmap of K‐means consensus clustering of methylation profiles of PTPR, supratentorial ependymomas carrying c11orf95–RELA translocations (RELPOS), posterior fossa group A (EPN_PFA) and group B (EPN_PFB) ependymomas as well as pineal parenchymal tumors of intermediate differentiation (PPTID). Note that PTPR can be divided in two subgroups (ie, PTPR group 1 and PTPR group 2).
Table 2.
Papillary tumors of the pineal region (PTPR) subgroups. Patient characteristics, histopathology, chromosomal alterations and epigenetic features of the two PTPR subgroups identified on clustering of methylation profiles
| PTPR group 1 (n = 6) | PTPR group 2 (n = 16) | P‐value | |
|---|---|---|---|
| Patient characteristics | |||
| Age (years, median, range) | 36 (10–63) | 29 (5–48) | n.s. |
| Sex (male : female) | 2:4 | 7:9 | n.s. |
| Histopathology | |||
| Increased mitotic activity (≥3 mitoses/10 HPF) | 1/6 (17%) | 7/14 (50%) | n.s. |
| Increased proliferative activity (Ki67 ≥10%) | 1/6 (17%) | 5/14 (36%) | n.s. |
| Outcome | |||
| Progression | 2/6 (33%) | 8/15 (53%) | n.s. |
| Death | 1/6 (17%) | 1/15 (7%) | n.s. |
| Time to progression [mean (95% confidence interval)] | 125 (62–188) months | 43 (29–58) months | 0.056 |
| Chromosomal alterations | |||
| Loss of chromosome 3 | 1/3 | 3/7 | n.s. |
| Loss of chromosome 10 | 3/3 | 7/7 | n.s. |
| Loss of 22q | 1/3 | 4/7 | n.s. |
| Gain of chromosome 4 | 2/3 | 0/7 | n.s. |
| Gain of 5 | 2/3 | 0/7 | n.s. |
| Gain of 8p | 1/3 | 5/7 | n.s. |
| Gain of 9 | 1/3 | 2/7 | n.s. |
| Gain of chromosome 12 | 2/3 | 4/7 | n.s. |
| Epigenetic alterations | |||
| Hypermethylated genes among 2529 differentially methylated genes (FDR < 0.05) | 304/2529 (12%) | 2225/2529 (88%) | P < 0.0001 |
PTPRs show a characteristic gene expression profile
Comparison of gene expression profiles obtained in four PTPRs with that of 263 ependymomas yielded a total of 166 genes significantly overexpressed in PTPR (Supporting Information Table S3). Of note, these involved genes known to be highly expressed in the rodent subcommissural organ such as CALCA (coding for calcitonin‐related polypeptide alpha; http://mouse.brain‐map.org/gene/show/), FERD3L (Fer3‐like bHLH transcription factor; Allen Mouse Brain Atlas, http://mouse.brain‐map.org/gene/show/77439); and SPDEF (SAM‐pointed domain‐containing Ets transcription factor; Allen Mouse Brain Atlas, http://mouse.brain‐map.org/gene/show/29762). As shown in Figure 3A, SPDEF was highly overexpressed on mRNA level as compared with ependymal tumors. Furthermore, distinct or strong cytoplasmic and also membranous expression of SPDEF protein was encountered in 15/19 PTPRs (79%, Figure 3B) as compared with only 2/36 (6%) ependymal tumors, 2/19 (11%) choroid plexus tumors and 0/23 samples of other central nervous system (CNS) tumor entities including pineocytomas and PPTID (chi‐square P < 0.00001, Figure 3C). Neither the two ependymomas showing distinct cytoplasmic and membranous SPDEF staining nor the two SPDEF‐positive choroid plexus tumors were located in the pineal region.
Figure 3.
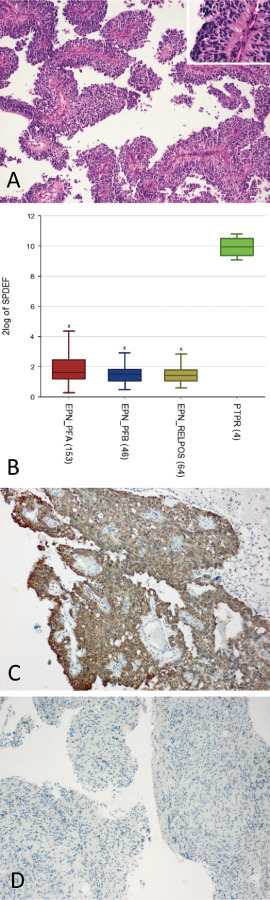
Expression of SPDEF in papillary tumors of the pineal region (PTPR): histopathology of PTPR (A) showing an epithelial‐like, loose papillary growth pattern (A). Note broad processes extending toward blood vessels at higher magnification (inset). Overexpression of SPDEF mRNA in PTPR (n = 4) as compared with ependymal tumors (n = 263; B). On immunohistochemistry, distinct cytoplasmic and membranous expression of SPDEF protein was present in the majority of PTPR (C: representative image of a SPDEF‐positive PTPR), but rarely observed in ependymomas, choroid plexus tumors or other brain tumors (D: representative image of an SPDEF‐negative ependymoma located in the vicinity of the third ventricle).
Discussion
The present study demonstrates that PTPR is a distinct entity showing typical chromosomal alterations as well as specific DNA methylation and mRNA expression profiles. These features allow for discrimination of close histopathological mimics, namely ependymomas and PPTID. The finding of frequent loss of chromosome 10 in PTPR is well in line with earlier results obtained by comparative genomic hybridization 2, 5, 6. Recently, chromosome 10 loss in PTPR has been linked to PTEN mutations and activation of the phosphoinositide 3‐kinase/Akt/mTOR signaling pathway 4. Even though loss of chromosome 10 was encountered in all PTPRs examined, this finding has also been reported in about 15% of intracranial ependymomas 12. This also holds true for PTEN mutations, which are more frequently encountered in gliomas 11.
We therefore generated genome‐wide DNA methylation profiles and performed clustering of PTPR together with entities that also occur in the pineal region and might show histopathological similarity (ie, ependymomas and PPTID). DNA methylation profiling has been successfully applied to FFPE tissue samples to delineate different tumor entities 8 and subgroups 8, 13. Indeed, clustering analysis revealed that PTPRs have a distinct methylation profile reliably distinguishing them from ependymomas as well as PPTID. Interestingly, PTPR could be divided into two subgroups based on methylation pattern, PTPR group 2 showing higher methylation levels. Even though no significant difference in clinical, histopathological, genetic and prognostic data could be identified between the two PTPR subgroups (which may be related to the relatively small sample size), the observation that hypermethylated PTPR group 2 tumors tended to have shorter progression‐free survival is of interest and should be further investigated in the context of future prospective trials.
On gene expression profiling, several subcommissural organ‐related genes were identified to be overexpressed in PTPR as compared with ependymomas, further suggesting a possible origin of PTPR from the specialized ependymal cells of the subcommissural organ. These involved transcription factor SPDEF, which in prostate epithelial cells has been shown to act as an androgen‐independent transactivator of prostate‐specific antigen 16. SPDEF expression has been linked to the rodent subcommissural organ and PTPR 2, but its role in the biology of PTPR remains to be determined. Investigations on the functional role of genetic and epigenetic alterations as well as differentially expressed genes in the biology of PTPR are hampered by the absence of animal or cell culture models for this rare tumor. Nevertheless, our data suggest that methylation profiling and immunohistochemistry using antibodies directed against SPDEF and products of other genes overexpressed in PTPR might be of diagnostic value.
In conclusion, PTPR is a distinct entity showing typical chromosomal alterations as well as specific DNA methylation and mRNA expression profiles, which might serve as valuable diagnostic tools.
Conflict of Interest Statement
The authors have no conflicts of interest to declare.
Supporting information
Figure S1. Differential methylation in PTPR subgroups.
Table S1. Detailed patients' characteristics.
Table S2. Methylation profiling.
Table S3. Expression profiling.
Acknowledgments
This article has been supported by Innovative Medizinische Forschung Münster (IMF HA 221211). Additional support came from the German Cancer Research Center–Heidelberg Center for Personalized Oncology (DKFZ‐HIPO) Personalized Oncology Program (POP). We would like to thank Till Acker (Giessen), Robert Behr (Fulda), Anne Marie Bergemer Fouquet (Tours), Ingmar Blümcke (Erlangen), Heinrich Ebel (Hamm), Jörg‐Olaf Habeck (Chemnitz), Christian Hartmann (Hannover), Kathy Keyvani (Essen), Klaus Kuchelmeister (Bonn), Christianto Benjamin Lumenta (München), Sven‐Axel May (Chemnitz), Sophie Michalak (Angers), Camelia Monoranu (Würzburg), Helmut Mühleisen (Ludwigsburg), Andreas Nerlich (München), Marc Polivka (Paris), Markus J. Riemenschneider (Regensburg), Ghislaine Saint Pierre (Lyon), Ronald Sträter (Münster), Nathalie Streichenberger (Lyon), Emmanuelle Uro‐Coste (Toulouse), Istvan Vajtai (Bern), Séverine Valmary‐Degano (Besançon) and Emmanuèle Lechapt‐Zalcman (Caen) for contribution of clinical information and/or samples.
References
- 1. Fevre Montange M, Vasiljevic A, Bergemer Fouquet AM, Bernier M, Champier J, Chretien F et al (2012) Histopathologic and ultrastructural features and claudin expression in papillary tumors of the pineal region: a multicenter analysis. Am J Surg Pathol 36:916–928. [DOI] [PubMed] [Google Scholar]
- 2. Fevre‐Montange M, Champier J, Szathmari A, Wierinckx A, Mottolese C, Guyotat J et al (2006) Microarray analysis reveals differential gene expression patterns in tumors of the pineal region. J Neuropathol Exp Neurol 65:675–684. [DOI] [PubMed] [Google Scholar]
- 3. Fevre‐Montange M, Hasselblatt M, Figarella‐Branger D, Chauveinc L, Champier J, Saint‐Pierre G et al (2006) Prognosis and histopathologic features in papillary tumors of the pineal region: a retrospective multicenter study of 31 cases. J Neuropathol Exp Neurol 65:1004–1011. [DOI] [PubMed] [Google Scholar]
- 4. Goschzik T, Gessi M, Denkhaus D, Pietsch T (2014) PTEN mutations and activation of the PI3K/Akt/mTOR signaling pathway in papillary tumors of the pineal region. J Neuropathol Exp Neurol 73:747–751. [DOI] [PubMed] [Google Scholar]
- 5. Gutenberg A, Brandis A, Hong B, Gunawan B, Enders C, Schaefer IM et al (2011) Common molecular cytogenetic pathway in papillary tumors of the pineal region (PTPR). Brain Pathol 21:672–677. [DOI] [PMC free article] [PubMed] [Google Scholar]
- 6. Hasselblatt M, Blumcke I, Jeibmann A, Rickert CH, Jouvet A, van de Nes JA et al (2006) Immunohistochemical profile and chromosomal imbalances in papillary tumours of the pineal region. Neuropathol Appl Neurobiol 32:278–283. [DOI] [PubMed] [Google Scholar]
- 7. Heim S, Beschorner R, Mittelbronn M, Keyvani K, Riemenschneider MJ, Vajtai I et al (2014) Increased mitotic and proliferative activity are associated with worse prognosis in papillary tumors of the pineal region. Am J Surg Pathol 38:106–110. [DOI] [PubMed] [Google Scholar]
- 8. Hovestadt V, Remke M, Kool M, Pietsch T, Northcott PA, Fischer R et al (2013) Robust molecular subgrouping and copy‐number profiling of medulloblastoma from small amounts of archival tumour material using high‐density DNA methylation arrays. Acta Neuropathol 125:913–916. [DOI] [PMC free article] [PubMed] [Google Scholar]
- 9. Johnson RA, Wright KD, Poppleton H, Mohankumar KM, Finkelstein D, Pounds SB et al (2010) Cross‐species genomics matches driver mutations and cell compartments to model ependymoma. Nature 466:632–636. [DOI] [PMC free article] [PubMed] [Google Scholar]
- 10. Jouvet A, Fauchon F, Liberski P, Saint‐Pierre G, Didier‐Bazes M, Heitzmann A et al (2003) Papillary tumor of the pineal region. Am J Surg Pathol 27:505–512. [DOI] [PubMed] [Google Scholar]
- 11. Knobbe CB, Merlo A, Reifenberger G (2002) PTEN signaling in gliomas. Neuro‐Oncol 4:196–211. [PMC free article] [PubMed] [Google Scholar]
- 12. Korshunov A, Witt H, Hielscher T, Benner A, Remke M, Ryzhova M et al (2010) Molecular staging of intracranial ependymoma in children and adults. J Clin Oncol 28:3182–3190. [DOI] [PubMed] [Google Scholar]
- 13. Lai RK, Chen Y, Guan X, Nousome D, Sharma C, Canoll P et al (2014) Genome‐wide methylation analyses in glioblastoma multiforme. PLoS ONE 9:e89376. [DOI] [PMC free article] [PubMed] [Google Scholar]
- 14. Lehman NL (2008) Central nervous system tumors with ependymal features: a broadened spectrum of primarily ependymal differentiation? J Neuropathol Exp Neurol 67:177–188. [DOI] [PubMed] [Google Scholar]
- 15. Louis DN, Ohgaki H, Wiestler OD, Cavenee WK, Burger PC, Jouvet A et al (2007) The 2007 WHO classification of tumours of the central nervous system. Acta Neuropathol 114:97–109. [DOI] [PMC free article] [PubMed] [Google Scholar]
- 16. Oettgen P, Finger E, Sun Z, Akbarali Y, Thamrongsak U, Boltax J et al (2000) PDEF, a novel prostate epithelium‐specific Ets transcription factor, interacts with the androgen receptor and activates prostate‐specific antigen gene expression. J Biol Chem 275:1216–1225. [DOI] [PubMed] [Google Scholar]
- 17. Parker M, Mohankumar KM, Punchihewa C, Weinlich R, Dalton JD, Li Y et al (2014) C11orf95‐RELA fusions drive oncogenic NF‐kappaB signalling in ependymoma. Nature 506:451–455. [DOI] [PMC free article] [PubMed] [Google Scholar]
- 18. Sturm D, Witt H, Hovestadt V, Khuong‐Quang DA, Jones DT, Konermann C et al (2012) Hotspot mutations in H3F3A and IDH1 define distinct epigenetic and biological subgroups of glioblastoma. Cancer Cell 22:425–437. [DOI] [PubMed] [Google Scholar]
- 19. Wang Y, Cottman M, Schiffman JD (2012) Molecular inversion probes: a novel microarray technology and its application in cancer research. Cancer Genet 205:341–355. [DOI] [PubMed] [Google Scholar]
- 20. Witt H, Mack SC, Ryzhova M, Bender S, Sill M, Isserlin R et al (2011) Delineation of two clinically and molecularly distinct subgroups of posterior fossa ependymoma. Cancer Cell 20:143–157. [DOI] [PMC free article] [PubMed] [Google Scholar]
Associated Data
This section collects any data citations, data availability statements, or supplementary materials included in this article.
Supplementary Materials
Figure S1. Differential methylation in PTPR subgroups.
Table S1. Detailed patients' characteristics.
Table S2. Methylation profiling.
Table S3. Expression profiling.