Abstract
Although the neuroprotective effects of hydrogen sulfide (H2S) have been demonstrated in several studies, whether H2S protects against early brain injury (EBI) and secondary cognitive dysfunction in subarachnoid hemorrhage (SAH) model remains unknown. This study was undertaken to evaluate the influence of H2S on both acute brain injury and neurobehavioral changes as well as the underlying mechanisms after SAH. The H2S donor, NaHS, was administered via an intraperitoneal injection at a dose of 5.6 mg/kg at 2 h, 6 h, 24 h, and 46 h after SAH in rat model. The results showed that NaHS treatment significantly improved brain edema and neurobehavioral function, and attenuated neuronal cell death in the prefrontal cortex, associated with a decrease in Bax/Bcl‐2 ratio and suppression of caspase‐3 activation at 48 h after SAH. NaHS also promoted phospho‐Akt and phospho‐ERK levels. Furthermore, NaHS treatment significantly enhanced the levels of brain‐derived neurotrophic factor (BDNF) and phospho‐CREB. Importantly, NaHS administration improved learning and memory performance in the Morris water maze test at 7 days post‐SAH in rats. These results demonstrated that NaHS, as an exogenous H2S donor, could significantly alleviate the development of EBI and cognitive dysfunction induced by SAH via Akt/ERK‐related antiapoptosis pathway, and upregulating BDNF‐CREB expression.
Keywords: brain‐derived neurotrophic factor, cognitive deficits, early brain injury, hydrogen sulfide, subarachnoid hemorrhage
Introduction
Early brain injury (EBI) is the primary cause of high mortality and morbidity for subarachnoid hemorrhage (SAH) patients 4. It has been known that multiple factors, including cell death, abnormal inflammatory responses, oxidative stress, as well as cerebral vasospasm, are involved in the mechanisms underlying the EBI after SAH 28. Thus, identification of early neuroprotective strategies for possible clinical use is urgent. Approximately 50% of all SAH patients die of EBI, and many of those that do survive experience lasting cognitive dysfunction 2. The treatment of cognitive deficits has also been considered as a major target in the management of patients who survive cerebral aneurysm rupture.
Hydrogen sulfide (H2S) has been classified as a novel gasotransmitter signaling molecule in the central nervous system (CNS) which was involved in the regulation of ion channels, neurotransmitter functions and other intracellular signaling molecules such as tyrosine kinases 36. Endogenous H2S is generated in mammalian tissues by two pyridoxal‐5′ phosphate‐dependent enzymes, cystathionine β synthase (CBS) and cystathionine γ lyase (CSE). Both enzymes use l‐cysteine as substrate. It has been proposed that CBS was responsible for H2S production in the brain 1, 12.
H2S plays multiple roles in the CNS under physiological and pathological states 36. Interestingly, accumulating evidence has been garnered which suggests that exogenous H2S can function as a powerful neuroprotective agent. Kimura et al were the first to demonstrate that H2S protected primary rat cortical neurons from oxidative stress‐induced injury 13. H2S also exerts a number of cytoprotective, anti‐inflammatory, antioxidant and antiapoptotic effects in CNS 10, 12, 35. Our previous studies showed that H2S exhibited a neuroprotective potential in animal model of cerebral hypoxia injury 37, 42. Importantly, we observed that H2S promoted proliferation and neuronal differentiation of neural stem cells, and protected hypoxia‐induced decrease in hippocampal neurogenesis 18. Although there is only limited information about the neuroprotective effects of H2S in SAH 6, the potential therapeutic value of H2S for SAH has been increasingly recognized.
In this study, we tested the hypothesis that whether posttreatment of hydrosulfide (NaHS), a H2S donor, could attenuate the development of EBI and neurobehavioral dysfunction post‐SAH in rats. We also sought to elucidate the underlying mechanisms of H2S on its neuroprotective properties.
Materials and Methods
SAH model
Male Wistar rats (280–350 g) were purchased from Laboratory Animal Center, Shandong University. Upon arrival, the animals were housed under standard laboratory conditions (temperature 20 ± 2°C, 12 h:12 h light/dark cycle, lights on 08:00 h), having free access to food and water and were allowed to habituate to the novel environment for 1 week.
Experimental SAH was induced in rats using Suzuki′s double blood injection model with modification according to a previous study 6. Briefly, rats were intraperitoneally anesthetized through administration of chloral hydrate (350 mg/kg). A catheter was inserted into the femoral artery under sterility procedures to withdraw blood and to measure blood pressure. Two‐hundred microliters of autologous blood was withdrawn from the femoral artery and injected into the cisterna magna over a 3 min period.
In the handling and care of all animals, the International Guiding Principles for Animal Research, as stipulated by the World Health Organization (1985) and as adopted by the Laboratory Animal Center at Shandong University were followed. All efforts were made to reduce the number of animal used and their suffering.
Drug administration and experimental groups
The rats were randomly divided into four groups: the sham + vehicle (saline) group, the sham + NaHS (5.6 mg/kg) group, the SAH + vehicle (saline) group and the SAH + NaHS (5.6 mg/kg) group. NaHS or equal volume of vehicle was injected intraperitoneally at 2 h, 6 h, 24 h and 46 h after SAH. The dosage of NaHS was decided according to our previous studies 6, 42.
In the first experimental setting, the rats were decapitated 48 h after SAH for tissue assays. In the second experiment, the rats were trained and evaluated in a Morris water maze (MWM) 7 days after SAH.
Neurological scoring
Three behavioral activity examinations of scoring system (Table 1) were performed at 48 h after SAH according to previous study 6. Scoring was performed to record appetite, activity and neurological deficits by two “blinded” investigators, while the sequence of testing for the given tasks was randomized. Neurological deficits of the experimental animals were graded as follows: (i) no neurologic deficit (score = 0); (ii) suspicious or minimum neurologic deficit (score = 1); (iii) mild neurologic deficit (score = 2–3); (iv) severe neurologic deficit (score = 4–6).
Table 1.
Behavior and activity scores.
| Category | Behavior | Score |
|---|---|---|
| Appetite | Finished meal | 0 |
| Left meal unfinished | 1 | |
| Scarcely ate | 2 | |
| Activity | Walk and reach at least three corners of the cage | 0 |
| Walk with some stimulations | 1 | |
| Almost always lying down | 2 | |
| Deficits | No deficits | 0 |
| Unstable walk | 1 | |
| Impossible to walk | 2 |
Brain water content
Brain edema was determined according to the wet/dry method where % brain water content = [(wet weight − dry weight)/wet weight] × 100%. Briefly, each brain sample was removed from the skull and weighed immediately. Then the sample of cerebral hemispheres was dried at 100°C for 48 h and weighed to determine the dry weight.
Hematoxylin and eosin staining
Animals were perfused under deep anesthesia with 10% chloral hydrate followed by 4% paraformaldehyde. The brains were then removed and postfixed in formalin. After fixation and dehydration with gradient ethanol, the brain tissues were embedded in paraffin and sliced into in the coronal plane at 4 μm thickness using a section cutter (Leica, Germany). The sections (3 sections/rat) were stained with hematoxylin and eosin (H&E). And 4 rats for each group were prepared for H&E staining. Morphology of prefrontal cortex (PFC, the cerebral cortex which covers the front part of the frontal lobe) was observed by a light microscope (Olympus Corporation, Japan).
TUNEL staining
Apoptosis was detected using terminal deoxynucleotidyl transferase dUTP nick end labeling (TUNEL) according to the manufacturer's protocol (DeadEnd Flurometric kit, Promega, WI, U.S.). Slides were then counter‐stained with 4′,6‐diamidino‐2‐phenylindole (DAPI), washed, coverslipped with a water‐based mounting medium and sealed with nail polish. Three microscope fields (20×) of TUNEL‐positive cells in brain cortex were chosen and imaged. The number of TUNEL/DAPI positive cells was calculated as the mean of the numbers obtained from the six pictures per rat. And 4 rats for each group were prepared for TUNEL staining. Counting was performed in a blinded manner.
Electron microscopy
The animals were perfused with a mixed aldehyde fixative composed of 2% paraformaldehyde and 3% glutaraldehyde in 0.1 M phosphate buffer, pH 7.2. After perfusion, the brains were removed and cut into 50 mm sections with a vibratome. The sections were routinely embedded in glycide for ultrastructural examination. After light microscopic examination of the embedded vibratome sections, selected PFC regions were collected. Tissue masses were then retained in glutaraldehyde (2.5%) for 24 h, followed by a series of processes involving dehydration, infiltration, embedment, and polymerization. Finally, ultrathin sections (50 nm) were cut and samples taken at intervals of six sections. Two copper screens were observed at compatible times, and at least three photos were taken from each animal for transmission electron microscopy (JEM‐1200EX, JEOL Ltd., Tokyo, Japan).
Immunofluorescence imaging
The slides were fixed in 4% paraformaldehyde for 20 min and blocked with 10% goat serum in PBS. Slides were incubated overnight in a humidified chamber at 4°C with the following primary antibody (NeuN, 1:100, Abcam, Cambridge, MA, USA; and cleaved caspase‐3, 1:100, Cell Signaling Tech. MA, USA). After primary antibody incubation, samples were washed and incubated with the appropriate fluorescent‐conjugated secondary antibody (1:500 dilution, Sigma‐Aldrich) for 1 h. Images were captured using a Nikon TE2000U microscope. Three microscope fields (20×) of active caspase‐3/NeuN double positive cells in brain cortex were chosen and imaged. The number of active caspase‐3/NeuN double positive cells was calculated as the mean of the numbers obtained from six pictures per rat. And 4 rats for each group were prepared for the staining. Counting was performed in a blinded manner.
Morris water maze (MWM) test
The spatial reference memory was assessed using MWM test as previously described with minor modifications 22. A black cylindrical tank (120 cm in diameter) was filled with water (21°C–24°C), made opaque with the addition of atoxic acrylic black color. The tank was divided into 4 quadrants and a circular escape platform 10 cm in diameter was placed at a fixed position in the center of one of the four quadrants, the target quadrant. The platform was set 2 cm below the water level where rats could not see it directly. A digital camera was positioned above the centre of the tank and linked to a tracking system to record the performance of rats (SMART polyvalent video‐tracking system, Panlab, Spain). Rats were allowed to swim freely for 60 s to become acclimatized to the apparatus before the test. From the next day, each rat was subjected to five consecutive acquisition trials to find the hidden platform. Each trial began by placing a rat into one of the four quadrants of the pool, facing the wall of the tank. The daily order of the entries into individual quadrants was fixed and all four quadrants were used once in a series of four trials every day. The time taken to escape onto the hidden platform (escape latency) was measured. Rats were given 60 s to find the hidden platform during each acquisition trial. If it failed to locate the platform within 60 s, it was guided onto the platform. The rat was allowed to stay on the platform for 20s.
Twenty‐four hours after the last place navigation test, the probe test was performed to measure reference memory during which the platform was withdrawn. Each rat was released from the quadrant opposite to where the platform had been located and its behavior was monitored for 60 s. The latency to enter the target quadrant and the total time spent in target quadrant were recorded.
Reverse transcription–polymerase chain reaction (RT‐PCR)
Total RNA was extracted from prefrontal cortex using the Trizol reagent (Gibco, Invitrogen) according to the manufacturer's instructions. RNA concentration was determined using a spectrophotometer (Bio‐Rad. Labs) at 260 nm. Identical amounts of RNA (2 µg) were reversely transcribed into cDNA using a commercial RT‐PCR kit (Fermentas, Vilnius, Lithuania) according to the manufacturer's instructions. Then cDNA was subsequently amplified by PCR with specific primers (Table 2). PCR products, separated on a 1.2% agarose/TAE gel, were visualized by staining with ethidium bromide. The densitometric calculations of these values were normalized to β‐actin. The intensity of bands was determined using Image‐Pro Plus 6.0 software.
Table 2.
PCR primers used in this study.
| Gene | Forword (5′→3′) | Reverse (5′→3′) |
|---|---|---|
| Bax | GGT TGC CCT CTT CTA CTT TGC | TCT TCC AGA TGG TGA GCG AG |
| Bcl‐2 | GGA TGA CTT CTC TCG TCG CTA C | TGA CAT CTC CCT GTT GAC GCT |
| BDNF | AGC TGA GCG TGT GTG ACA GT | ACC CAT GGG ATT ACA CTT GG |
| PTEN | TGT GGT CTG CCA GCT AAA GG | CGG CTG AGG GAA CTC AAA GT |
| β –actin | CTA TTG GCA ACG AGC GGT TCC | CAG CAC TGT GTT GGC ATA GAG G |
Western blot analysis
Protein concentration in the prefrontal cortex was determined using a BCA protein assay kit (Pierce Biotechnology, Inc.). A quantity of 30–50 μg of total proteins was loaded onto a 4%–20% gradient polyacrylamide gel, electrophoretically transferred to a polyvinylidene difluoride membrane and probed with the following primary antibodies: Bax antibody (1:1000, Santa Cruz Biotechnology, CA, USA), Bcl‐2 antibody (1:1000, Santa Cruz Biotechnology), cleaved caspase‐3 (1:500, Cell Signaling Tech. MA, USA), Caspase‐3 (1:1000, Cell Signaling), phospho‐extracellular signal‐regulated kinase (ERK)1/2 (1:2000, Cell Signaling), ERK1/2 (1:2000; Cell Signaling), phospho‐Akt (Ser473) (1:500, Cell Signaling), Akt (1:1000; Cell Signaling), brain‐derived neurotrophic factor (BDNF) (1:1000, Santa Cruz Biotechnology), phosphatase and tensin homologue deleted on chromosome 10 (PTEN) (1:500, Cell Signaling). β‐actin (1:2000; Sigma‐Aldrich) was used as an internal control. Secondary antibodies were horseradish peroxidase conjugated to goat/mouse anti‐rabbit IgG (1:8000, Sigma‐Aldrich). The membranes were developed using an enhanced chemiluminescence detection system (Pierce, Rockford, IL).
Statistical analysis
Quantitative data were presented as the mean ± SD. The data from the acquisition days in MWM were averaged for each rat (total data/total number of trials per day) and analyzed using repeated measures ANOVA. If the interaction between the day and treatment was significant, then one‐way ANOVA using post‐hoc Tukey test for the treatment effect for each day was performed. Mortality data from SAH + vehicle group and SAH + NaHS group were analyzed by Pearson chi‐squared test. Other data were analyzed statistically by the one‐way ANOVA using the post‐hoc Tukey test for multiple comparisons of means. Differences were considered statistically significant if the p value was <0.05.
Results
Effects of the NaHS on mortality, neurological behavior and brain edema after SAH
In total, 150 surgeries were performed. Twenty‐three rats died within 1 h after SAH (23/150 operated animals; total mortality: 15.3%) during which time the animals had not received either the drug or the vehicle yet. The mortality was sham 0% (0 of 50), sham + NaHS 0% (0 of 50), SAH + vehicle 34% (17 of 50), SAH + NaHS 12% (6 of 50) within 48 h after surgeries (Figure 1A). A Pearson chi‐squared analysis revealed that treatment with NaHS induced a significant decrease in mortality compared with vehicle treatment in SAH rats (p < 0.05) (Table 3). Thirteen rats were excluded owing to the low behavior and activity scores (8 animals in SAH + vehicle and 5 animals in SAH + NaHS groups, respectively). As shown in Figure 1B, the neurological deficits in SAH groups increased significantly compared with the sham group (p = 0.000). However, NaHS treatment reduced neurological deficits compared with those in the SAH + vehicle group after 48 h SAH (p = 0.003). Moreover, the brain water content increased markedly at 48 h after SAH in SAH groups in comparison with the sham group (p = 0.002), while after NaHS administration, the brain edema was attenuated markedly (p = 0.032, Figure 1C).
Figure 1.

Effects of the NaHS on mortality, neurological behavior impairment and brain edema after SAH. (A) Mortality was recorded at 48 h after SAH. (B) Neurological scores were recorded at 48 h after SAH, n = 15. (C) Brain water content of cerebral cortex was measured at 48 h after SAH, n = 6. Values represent the mean ± SD, **p < 0.01, ***p < 0.001 SAH vs. Sham; #p < 0.05, ##p < 0.01 SAH + NaHS vs. SAH.
Table 3.
Demographic information of SAH rats in different treatment (total sample size: n = 100).
| Group | ||||
|---|---|---|---|---|
| Characteristics | SAH + Vehicle | SAH + NaHS | Total number | p value |
| Dead number | 17 | 6 | 23 | <0.05 # |
| Survival number | 33 | 44 | 77 | |
| Total | 50 | 50 | 100 | |
#Pearson Chi‐squared test.
NaHS alleviates SAH‐induced brain injury
In the sham group, the brain had clear structural layers and cortical neurons presented clear borderline. In SAH group, cells were arranged sparsely and the cell outline was fuzzy. Moreover, obvious edema was found in the PFC which was pale, and neurons were shrunken in SAH group. Treatment with NaHS in SAH alleviated edema and this morphological damage (Figure 2).
Figure 2.
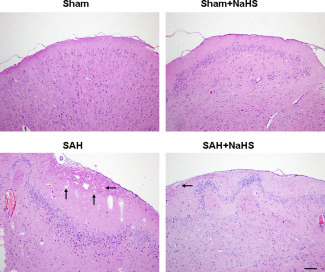
NaHS alleviates SAH‐induced brain injury. HE staining of the brain tissues was taken at 48 h after SAH, n = 4. Pathological injuries showing focal edema in the prefrontal cortex (marked by black arrow).
The TUNEL assay revealed that TUNEL‐positive neurons in PFC were significantly increased at 48h after SAH insult (p = 0.000). The apoptosis of cells induced by SAH was significantly attenuated by cotreated with NaHS (p = 0.002, Figure 3).
Figure 3.
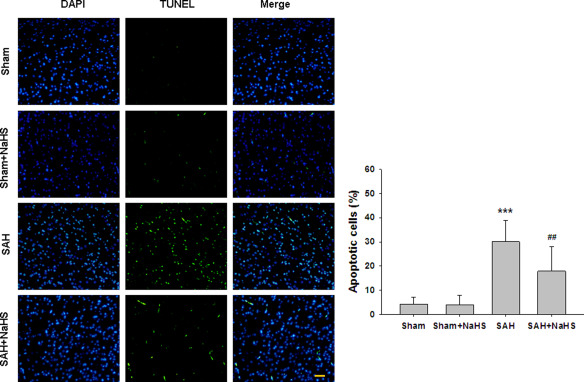
NaHS alleviates SAH‐induced apoptosis. (A) TUNEL staining of the brain tissues was taken at 48 h after SAH. (B) Bar graphs showing quantification of TUNEL‐positive cells. Scale bar = 50 μm. Values represent the mean ± SD, n = 4. ***p <0.001 SAH vs. Sham; ## p < 0.01 SAH+NaHS vs. SAH.
Ultrastructural alterations of cells in the PFC at 48 h after SAH insult were examined under electron microscopy. As shown in Figure 4, the nuclei of neurons in the PFC of sham controls were large, round or oval and contained a distinct nuclear envelope and nucleoli. The euchromatins were distributed homogeneously, and the structures of intracytoplasmic mitochondria and rough endoplasmic reticulum were clear and ribosomes abounded. Neurons in the sham + NaHS group were similar to those in the sham group. In contrast, neurons in the PFC region of SAH animals were necrotic presented with condensed cytoplasm and nuclei, and mitochondria that were swollen and vacuolized. Some neurons were fragmented with dissolved membranes. Treatment of SAH with NaHS alleviated this morphological damage. In these animals, most of the nuclear chromatins were distributed homogeneously, the ultramicrostructure was similar to those of neurons in sham group, swollen mitochondria mitigated, mitochondria were clearer and ribosomes were more abundant (Figure 4).
Figure 4.
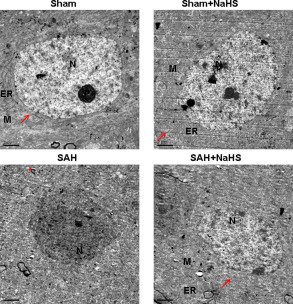
Effect of NaHS on SAH‐induced neuronal ultrastructure alteration. Representative electron micrographs images showing control neurons have prominent, well‐developed, organelles: nucleus, (N), rough endoplasmatic reticulum (ER), mitochondria, (M), and ribosomes abounded (arrow). n = 4. The necrotic cells in the PFC at 48 h after SAH were fragmented, membrane dissolved and mitochondria vacuolized (asterisk *). Scale bar = 2 μm.
The effect of NaHS on caspase‐3 activation after SAH
To investigate the potential protective mechanism of NaHS, we performed active caspase‐3/NeuN staining after SAH. Figure 5 showed that numerous active caspase‐3/NeuN double positive‐stained neurons were observed in brain cortex of SAH group as compared with sham group (p = 0.000). However, the active caspase‐3/NeuN double positive‐stained neurons were significantly reduced in NaHS‐treated SAH group compared with the vehicle‐treated SAH group (p = 0.005, Figure 5D). Moreover, Western blot analysis revealed that SAH significantly increased cleaved‐caspase‐3 protein levels (p = 0.000, Figure 5B,C) compared with the sham group. However, the level of cleaved‐caspase‐3 expression in NaHS treatment was dramatically reduced compared with the vehicle‐treated SAH group at 48 h after SAH (p = 0.023, Figure 5B,C).
Figure 5.

The effect of NaHS on caspase‐3 activation after SAH. (A) Representative images show double immunofluorescent staining of active caspase‐3 and NeuN of prefrontal cortex (PFC). Scale bar = 50 μm. (B) The PFC extracts were subjected to Western blot analysis using an antibody against cleaved caspase‐3, total caspase‐3 were used to evaluate protein loading. (C) Bar graphs showing quantification of the protein levels of cleaved caspase‐3 and caspase‐3 were determined by Image‐Pro Plus 6·0. Results were expressed as cleaved caspase‐3/caspase‐3 ratio. n = 3. (D) Bar graphs showing quantification of active caspase‐3/NeuN‐positive cells. n = 4. Values represent the mean ± SD. ***p < 0.001 SAH vs. Sham; #p < 0.05, ##p < 0.01 SAH + NaHS vs. SAH. 1 Sham, 2 Sham + NaHS, 3 SAH, 4 SAH + NaHS.
NaHS reverses SAH‐induced changes of Bcl‐2 and Bax after SAH
Because changes in expression of proapoptotic Bax and antiapoptotic Bcl‐2 control the mitochondrial pathway of apoptosis, we examined the expression of Bax and Bcl‐2 at the mRNA and proteins levels. As shown in Figure 6, SAH insult markedly increased the Bax/Bcl‐2 ratio at mRNA and protein levels at 48 h postinjury. However, the increase mentioned above was reduced by cotreated with NaHS, while NaHS treatment alone did not alter the Bax/Bcl‐2 ratio.
Figure 6.
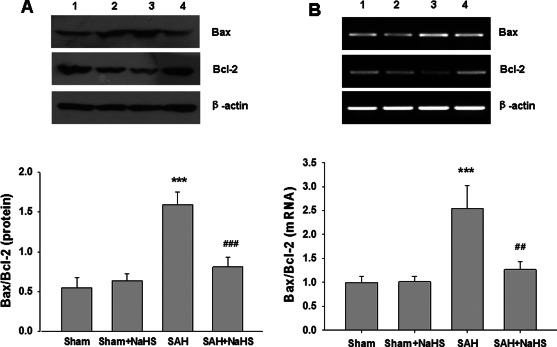
Effect of NaHS on the expression of Bax, Bcl‐2 mRNA and protein. (A) The levels of Bax and Bcl‐2 in the PFC at 48 h after SAH were measured by western blotting, and β‐actin was used to evaluate protein loading. Bar graphs showing quantification of the protein levels of Bax and Bcl‐2, which was determined by Image‐Pro Plus 6·0. n = 3. (B) The relative expression levels of Bax and Bcl‐2 mRNA in the PFC were analyzed by semiquantitative RT‐PCR. Each value was normalized to β‐actin. Bar graphs showing quantification of mRNA levels of Bax and Bcl‐2 were determined by Image‐Pro Plus 6·0, n = 3. Values represent the mean ± SD, ***p < 0.001 SAH vs. Sham; ##p < 0.01, ###p < 0.001 SAH + NaHS vs. SAH. 1 Sham, 2 Sham + NaHS, 3 SAH, 4 SAH + NaHS.
NaHS improves ERK1/2 and Akt phosphoryation after SAH
The roles of ERK1/2 and Akt pathways upon the neuroprotective effects of H2S were assessed using Western blot analysis. As shown in Figure 7, phosphorylation of ERK1/2 and Akt was decreased after SAH insult. And NaHS administration was effective in upregulating ERK1/2 and Akt activation in the SAH group.
Figure 7.

Effect of NaHS on ERK and Akt phosphorylation. (A) At 48 h after SAH, entire PFC extracts were subjected to western blot analysis using an antibody against phospho‐ERK(p‐ERK) and ERK, Bar graphs showing quantification of expression levels of p‐ERK/ERK was determined by the Image‐Pro Plus 6.0; n = 3. (B) At 48 h after SAH, entire PFC extracts were subjected to western blot analysis using an antibody against phospho‐Akt (p‐Akt) and Akt. Bar graphs showing quantification of expression levels of p‐Akt/Akt were determined by the Image‐Pro Plus 6.0; n = 3. Values represent the mean ± SD. **p < 0.01 SAH vs. Sham; #p < 0.05 SAH + NaHS vs. SAH. 1 Sham, 2 Sham + NaHS, 3 SAH, 4 SAH + NaHS.
Effects of the NaHS on PTEN expression after SAH
Because overexpression of PTEN is associated with decreased Akt activity, we examined the expression of PTEN. After SAH, the mRNA and protein levels of PTEN were increased in SAH group compared to sham group, while NaHS treatment did not affect the expression of PTEN after SAH (Figure 8A,B).
Figure 8.
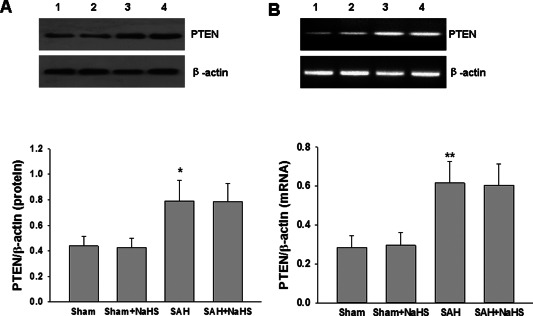
Effect of NaHS on PTEN expression. (A) The levels of PTEN in the PFC at 48 h after SAH were measured by western blotting, and β‐actin was used to evaluate protein loading. Bar graphs showing quantification of the protein levels of PTEN were determined by Image‐Pro Plus 6·0; n = 3. (B) The relative expression levels of PTEN mRNA in the PFC were analyzed by semiquantitative RT‐PCR. Each value was normalized to β‐actin. Bar graphs showing quantification of mRNA levels of PTEN was determined by Image‐Pro Plus 6·0, n = 3. Values represent the mean ± SD, *p < 0.05, **p < 0.01 SAH VS Sham. 1 Sham, 2 Sham + NaHS, 3 SAH, 4 SAH + NaHS.
Administration of NaHS improves BDNF expression after SAH
To examine whether NaHS could affect production of neuroprotective factors, the BDNF concentration of PFC was measured at 48 h after SAH. As shown in Figure 9A, BDNF mRNA expression was significantly decreased at 48 h after SAH as compared with the sham group (p = 0.003; Figure 9A). Treatments with NaHS significantly increased the expression of BDNF mRNA in PFC at 48 h post‐SAH exposure (p = 0.008; Figure 9A). Consistent with the changes in the mRNA, the decreased levels of BDNF protein induced by SAH were also reversed by NaHS treatment (Figure 9B).
Figure 9.

Effect of NaHS on BDNF expression. (A) The relative expression levels of BDNF mRNA in the PFC were analyzed by semiquantitative RT‐PCR. Each value was normalized to β‐actin. Bar graphs showing quantification of mRNA levels of BDNF were determined by Image‐Pro Plus 6·0. n = 4. (B) The levels of BDNF in the PFC at 48 h after SAH were measured by western blotting, and β‐actin was used to evaluate protein loading. Bar graphs showing quantification of the protein levels of BDNF were determined by Image‐Pro Plus 6·0; n = 4. Values represent the mean ± SD, **p < 0.01, ***p < 0.001 SAH vs. Sham; #p < 0.05, ##p < 0.01, SAH + NaHS vs. SAH. 1 Sham, 2 Sham + NaHS, 3 SAH, 4 SAH + NaHS.
Administration of NaHS improves CREB phosphorylation in vivo
The phosphorylated CREB regulates the transcription of several genes that code for molecules involved in neuronal plasticity including tyrosine hydroxylase, BDNF and neural cell adhesion molecule which related to stress response. Thus, we examined the expression of CREB phosphorylation after SAH and NaHS treatment. As shown in Figure 10A, phosphorylated CREB expression was significantly decreased at 48 h after SAH in comparison with the sham group (p = 0.001; Figure 10). Treatment with NaHS significantly increased the expression of phosphorylated CREB in PFC at 48 h post‐SAH exposure (p = 0.012; Figure 10).
Figure 10.
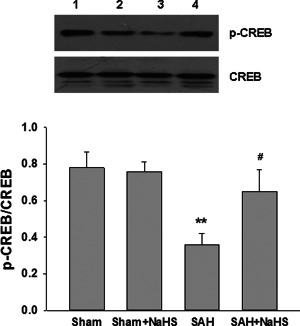
Effect of NaHS on CREB phosphorylation. (A) At 48 h after SAH, entire PFC extracts were subjected to western blot analysis using an antibody against phospho‐CREB (p‐CREB) and CREB. Bar graphs showing quantification of expression levels of p‐CREB/CREB were determined by the Image‐Pro Plus 6.0. Values represent the mean ± SD; n = 3. **p < 0.01 SAH vs. Sham; #p < 0.05 SAH + NaHS vs. SAH. 1 Sham, 2 Sham + NaHS, 3 SAH, 4 SAH + NaHS.
Effects of NaHS administration on MWM test after SAH
The escape latencies of the four groups during acquisition training (5 days) are presented in Figure 11A. All groups showed marked improvements in escape latencies over the 5 days of training [F(3,36) = 69.942, p = 0.000, repeated measures ANCOVA], indicating a memory for location of the escape platform. Repeated measures ANCOVA revealed no interaction between training days and groups [F(3,36 = 0.718, p = 0.732]. This suggested that all the animals effectively learned the task. In addition, the escape latency of the SAH group was shown to be significantly longer than that of the control group on day 4 (p = 0.01) and day 5 (p = 0.038). And NaHS administration significantly prevented such deficiencies on day 4 and day 5 (p = 0.039 and p = 0.033, respectively).
Figure 11.
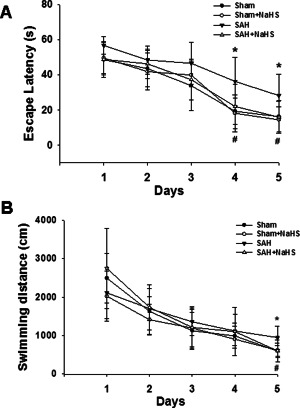
Effects of NaHS administration during the acquisition trials in the Morris water maze test. (A) Rats at 7 days after SAH were given 60 s to locate the hidden platform during each acquisition trial consisting of 4 trials per day for 5 days. Values presented indicate the escape latency (in seconds) in the navigation test trials. (B) Swim path length of 4 trials per day for 5 days. Values represent the mean ± SD, n = 10, *p < 0.05 SAH vs. Sham; #p < 0.05 SAH + NaHS vs. SAH.
Similarly, all groups showed marked improvements in swimming distance over the 5 days of training [F(3,36) = 68.389, p = 0.000, repeated measures ANCOVA], indicating a memory for location of the escape platform. Repeated measures ANCOVA revealed no interaction between training days and groups [F(3,36 = 1.245, p = 0.259]. This suggests that all the animals effectively learned the task. In addition, the distance of the SAH group was shown to be significantly longer than that of the control group on day 5 (p = 0.011). And NaHS administration significantly prevented such deficiencies on day 5 (p = 0.012).
After 5 days of acquisition training, animals learned to locate the escape platform position. To assess memory, on the sixth day, the rat was placed in the pool for 60 s without the escape platform and the time required to reach and remain in the target quadrant where the escape platform was located during the training was recorded. Post‐hoc analysis indicated that the SAH rats spent more time reaching the position of the hidden platform, compared with that of the sham group (p = 0.012; Figure 12A,B). However, the SAH + NaHS group exhibited an enhanced memory response, reaching the position of the hidden platform in a shorter latency as compared with SAH group (p = 0.045; Figure 12 A,B).
Figure 12.
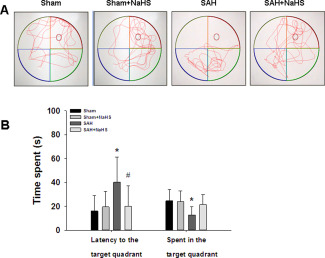
Effects of NaHS administration during probe trial in the Morris water maze test. (A) Display of tracks of all groups on the sixth day, when the training platform (small blue circles) was removed and activity was monitored for 60 s. (B) The escape latency and percent time spent in the target quadrant in the spatial exploratory test was recorded and analyzed. Values represent the mean ± SD, n = 10, *p < 0.05, SAH vs. Sham; #p < 0.05 SAH + NaHS vs. SAH.
Similar, post‐hoc analysis indicated that the SAH group spent less time in the target quadrant compared with that of the sham group (p = 0.017; Figure 12B). However, the SAH + NaHS group spent more time in the target quadrant as compared with the SAH group, but not statistically significant (p = 0.115; Figure 12B). Moreover, no difference in swimming speed was found between the four groups, which suggested that motor ability did not differ between the experiment groups (data not shown here).
Discussion
A growing body of evidence has suggested that EBI, which occurs during the 24–72 h following aneurysm rupture, largely contributes to unfavorable outcome 4. The treatment of EBI is a major goal in the management of patients surviving SAH. The possible mechanisms of EBI after SAH include the rapid rise of intracranial pressure, the reduction in cerebral perfusion pressure, brain edema, BBB disruption, oxidative stress and neural death 28. In this study, we found that NaHS was able to inhibit cell death, attenuate brain edema, neurological deficits and mortality and finally improve cognitive dysfunction following SAH. Another major finding was that the possible neuroprotective benefits of H2S might be through Akt/ERK‐related antiapoptosis pathway, as well as upregulating BDNF‐CREB expression.
Apoptosis is considered to be one of the most crucial factors that can cause early brain injury after SAH. Moreover, injured neurons following SAH may be associated with delayed neurological deterioration and poor long‐term outcomes 26. Akt and ERK pathways are involved in numerous crucial cell functions, such as proliferation, differentiation, motility and survival 25, 39. Akt is an initiator of the downstream pathways that inhibit apoptosis. It phosphorylates Bad and ultimately inhibits the release of cytochrome c through blocking the channel formed by Bcl‐2‐associated Bax in the mitochondrial membrane 39. Activation of the ERK cascade can also result in the phosphorylation of the antiapoptotic Mcl‐1 protein and the proapoptotic Bim protein, and lead to the prevention of apoptosis 21. A previous study reported that p‐ERK was significantly decreased in the dentate gyrus in SAH model and elevating its expression could prevent SAH‐induced apoptosis 17. Moreover, the neuroprotective effect of Akt pathway in SAH plays an important role in regulating neuronal apoptosis in SAH. In agreement with these studies, we found that the levels of p‐ERK and p‐Akt were decreased after SAH compared with the sham group, while treatment with NaHS prevented these decreases, along with significantly enhanced Akt and ERK phosphorylation.
The mechanisms responsible for neuroprotective benefits of H2S are not yet fully elucidated, but a number of suggestions have been provided. There were data indicating that H2S exerted its neuroprotective benefits against excitotoxic insult both in vitro 9, 20 and in vivo in neurons 15, 37. Moreover, previous studies have shown that H2S possessed neuroprotective effects in various models, some of which were dependent on the activity of the ERK and PI3K/Akt signaling pathway. For example, H2S therapy significantly suppressed the caspase‐3 activation and decreased myocardial injury via activating the ERK signaling pathway 24. Furthermore, by activating the PI3K/Akt signaling pathway, H2S can increase Bcl‐2 protein levels, inhibit activation of the cytochrome c‐caspase‐3/9 apoptosis pathway, and promote the survival of cells 41. Similarly, we observed that the upregulation of Bax/Bcl‐2 ratio and caspase‐3 activation after SAH were reversed by injection of NaHS. In addition, NaHS administration significantly activated the ERK and Akt signaling pathway. Taken together, these findings suggested that H2S exerted its protective properties in SAH, at least in part, via the activation of Akt and ERK pathway to the inhibition of apoptosis.
PTEN is a major negative regulator of the PI3K/Akt signaling pathway, and plays a key role in cell growth, proliferation, survival and apoptosis 16. Activation of PTEN is regulated by a balance of phosphorylation and dephosphorylation of the protein, and phosphorylation of PTEN leads to a decrease both in function and stability of PTEN 33. Previous studies reported that specific downregulation of PTEN protein level protected against ischemic neuronal death, which was accompanied with increased Akt activation. Furthermore, decreased PTEN expression with specific inhibitor was able to significantly alleviate brain injury after SAH, associated with Akt activation 5, 8. In agreement with these studies, our results showed that the levels of PTEN were increased after SAH compared with the sham group. However, NaHS did not influence PTEN expression after SAH. Thus, there might be other signaling pathways responsible for the activation of Akt and ERK by NaHS treatment.
BDNF is a growth factor and plays a vital role in neuronal survival, plasticity and neurogenesis 19. For example, BDNF attenuates glutamate toxicity and rescues cerebellar neurons from cell death 3. Numerous studies showed that BDNF infusion reduced ischemic‐induced brain damage, and improved functional recovery 27. In fact, previous studies have demonstrated that BDNF polymorphism was associated with poor recovery from SAH patients 30, 34. Animal studies showed that BDNF infusion or upregulation of its protein expression improved neurobehavioral outcome after SAH 32, 43. As for the mechanisms underlying BDNF‐induced protection against neuronal apoptosis, some studies have demonstrated that these effects were dependent on stimulation of the ERK and/or PI‐3K/Akt signaling cascade, which subsequently activated phosphorylation of CREB and promoted survival of neuronal cells 23, 40. It was also reported that H2S upregulated the levels of BDNF protein and that the blockage of BDNF‐TrkB pathway reversed the protection of H2S against cytotoxicity, oxidative stress and apoptosis in neurons 11, 38. In addition, H2S was able to activate CREB signaling pathway and prevented brain injury from ischemia‐reperfusion 7. In our study, the expression of p‐CREB and BDNF protein was increased after NaHS administration, suggesting H2S could activate the CREB signal pathway and promote expression of its downstream pro‐survival gene, BDNF. More importantly, these findings raise the possibility that H2S, via upregulation of pCREB and BDNF in the PFC, produced antiapoptotic effects.
Clinically, a substantial portion of survivors of SAH have neurocognitive deficits 2, 14. These impairments include deficits in attention, memory, learning, executive functions and language 2. Animal studies showed that experimental SAH in rats reliably resulted in prolonged vestibulomotor and cognitive dysfunction 29, 31. Importantly, cognitive dysfunction is correlated with selective neuronal loss in the hippocampus and cortex after SAH 31, and reduced neuronal loss could alleviate the development of cognitive dysfunction 29. Various mechanisms including suppression of microglia activation, inhibition of glutamate‐induced toxicity and reduced oxidative stress have been proposed to reduce neuronal loss in vivo and in vitro with H2S 36. In our study, learning deficits induced by SAH was markedly alleviated after NaHS administration. The cognitive deficits induced by SAH could be explained by direct or indirect actions of microglial activation. Thus, we hypothesized that the protective effects of H2S on SAH‐induced neurobehavioral dysfunction might be associated with the inhibition of neuronal loss.
In this regard, it is important to note that a recent study indicated the therapeutic efficacy of H2S treatment for 3 days after SAH in Sprague‐Dawley rats 6. The report demonstrated that H2S protected against brain edema and apoptosis induced by SAH. Importantly, H2S treatment reduced EBI at least partially mediated by its anti‐inflammatory and antioxidative stress activities. In agreement with the study, we also found the neuroprotective benefits of H2S in EBI after SAH, while we focused the signaling pathway involved in antiapoptotic effect of H2S in our study. Toward this end, we found the activation of Akt/ERK and BDNF/CREB were possibly involved in the H2S protective property in SAH.
There are several limitations to our study. First, we excluded 13 rats from the statistics of scores owing to the low behavior and activity scores in the study. It was possible that surgery procedure was not effective in these animals. Thus, more effective surgery needs to perform in the further study. Second, although apoptosis is a major contributor to EBI, other factors, including inflammation, oxidative stress and cerebral vasospasm, may also be responsible for the development of EBI and neurological dysfunction. Determining whether H2S has a beneficial effect on these factors and exploring the possible mechanism will require further study. Third, how H2S upregulates expression of BDNF, and how the factors affect the neurological function were not determined. Finally, the route, timing and dosage of H2S treatment needs to be further elucidated.
In summary, H2S treatment could alleviate the development of EBI and cognitive dysfunction induced by SAH through multiple mechanisms, including activating Akt/ERK‐related antiapoptosis pathway, and upregulating BDNF‐CREB expression.
Authors Contribution
GL and ZW involved in study design, data interpretation and writing of the manuscript; TL performed the majority of the laboratory work and contributed to the analysis of data; HSL, HX, JSZ, XH and SFY were responsible for the animal model; SSB, SL and LY were responsible for western blot; LD involved in manuscript editing. The authors have no conflict of interest to declare.
Acknowledgments
This work was supported by funding from National Natural Science Foundation of China (81571284 and 81200879) and The Fundamental Research Funds of Shandong University (2015JC008).
Contributor Information
Gang Li, Email: ligangqiluhospital@163.com.
Zhen Wang, Email: wangzhen@sdu.edu.cn.
References
- 1. Abe K, Kimura H (1996) The possible role of hydrogen sulfide as an endogenous neuromodulator. J Neurosci 16:1066–1071. [DOI] [PMC free article] [PubMed] [Google Scholar]
- 2. Al‐Khindi T, Macdonald RL, Schweizer TA (2010) Cognitive and functional outcome after aneurysmal subarachnoid hemorrhage. Stroke 41:e519–e536. [DOI] [PubMed] [Google Scholar]
- 3. Almeida RD, Manadas BJ, Melo CV, Gomes JR, Mendes CS, Graos MM, et al (2005) Neuroprotection by BDNF against glutamate‐induced apoptotic cell death is mediated by ERK and PI3‐kinase pathways. Cell Death Differentiation 12:1329–1343. [DOI] [PubMed] [Google Scholar]
- 4. Bederson JB, Connolly ES, Jr. , Batjer HH, Dacey RG, Dion JE, Diringer MN, et al (2009) Guidelines for the management of aneurysmal subarachnoid hemorrhage: a statement for healthcare professionals from a special writing group of the Stroke Council, American Heart Association. Stroke 40:994–1025. [DOI] [PubMed] [Google Scholar]
- 5. Chen Y, Luo C, Zhao M, Li Q, Hu R, Zhang JH, et al (2015) Administration of a PTEN inhibitor BPV(pic) attenuates early brain injury via modulating AMPA receptor subunits after subarachnoid hemorrhage in rats. Neurosci Lett 588:131–136. [DOI] [PubMed] [Google Scholar]
- 6. Cui Y, Duan X, Li H, Dang B, Yin J, Wang Y, et al (2015) Hydrogen sulfide ameliorates early brain injury following subarachnoid hemorrhage in rats. Mol Neurobiol [Epub ahead of prints]. [DOI] [PubMed] [Google Scholar]
- 7. Dai HB, Ji X, Zhu SH, Hu YM, Zhang LD, Miao XL, et al (2015) Hydrogen sulphide and mild hypothermia activate the CREB signaling pathway and prevent ischemia‐reperfusion injury. BMC Anesthesiol 15:119. [DOI] [PMC free article] [PubMed] [Google Scholar]
- 8. Hasegawa Y, Suzuki H, Altay O, Chen H, Zhang JH (2013) Treatment with sodium orthovanadate reduces blood‐brain barrier disruption via phosphatase and tensin homolog deleted on chromosome 10 (PTEN) phosphorylation in experimental subarachnoid hemorrhage. J Neurosci Res 90:691–697. [DOI] [PMC free article] [PubMed] [Google Scholar]
- 9. Hu LF, Lu M, Wu ZY, Wong PT, Bian JS (2009) Hydrogen sulfide inhibits rotenone‐induced apoptosis via preservation of mitochondrial function. Mol Pharmacol 75:27–34. [DOI] [PubMed] [Google Scholar]
- 10. Hu LF, Wong PT, Moore PK, Bian JS (2007) Hydrogen sulfide attenuates lipopolysaccharide‐induced inflammation by inhibition of p38 mitogen‐activated protein kinase in microglia. J Neurochem 100:1121–1128. [DOI] [PubMed] [Google Scholar]
- 11. Jiang JM, Zhou CF, Gao SL, Tian Y, Wang CY, Wang L, et al (2014) BDNF‐TrkB pathway mediates neuroprotection of hydrogen sulfide against formaldehyde‐induced toxicity to PC12 cells. PloS One 10:e0119478. [DOI] [PMC free article] [PubMed] [Google Scholar]
- 12. Kimura H (2013) Physiological role of hydrogen sulfide and polysulfide in the central nervous system. Neurochem Int 63:492–497. [DOI] [PubMed] [Google Scholar]
- 13. Kimura Y, Kimura H (2004) Hydrogen sulfide protects neurons from oxidative stress. Faseb J 18:1165–1167. [DOI] [PubMed] [Google Scholar]
- 14. Kreiter KT, Copeland D, Bernardini GL, Bates JE, Peery S, Claassen J, et al (2002) Predictors of cognitive dysfunction after subarachnoid hemorrhage. Stroke 33:200–208. [DOI] [PubMed] [Google Scholar]
- 15. Li Z, Wang Y, Xie Y, Yang Z, Zhang T (2011) Protective effects of exogenous hydrogen sulfide on neurons of hippocampus in a rat model of brain ischemia. Neurochem Res 36:1840–1849. [DOI] [PubMed] [Google Scholar]
- 16. Lim HJ, Crowe P, Yang JL (2015) Current clinical regulation of PI3K/PTEN/Akt/mTOR signalling in treatment of human cancer. J Cancer Res Clin Oncol 141:671–689. [DOI] [PMC free article] [PubMed] [Google Scholar]
- 17. Lin CL, Dumont AS, Tsai YJ, Huang JH, Chang KP, Kwan AL, et al (2009) 17Beta‐estradiol activates adenosine A(2a) receptor after subarachnoid hemorrhage. J Surg Res 157:208–215. [DOI] [PubMed] [Google Scholar]
- 18. Liu D, Wang Z, Zhan J, Zhang Q, Wang J, Zhang Q, et al (2014) Hydrogen sulfide promotes proliferation and neuronal differentiation of neural stem cells and protects hypoxia‐induced decrease in hippocampal neurogenesis. Pharmacol Biochem Behav 116:55–63. [DOI] [PubMed] [Google Scholar]
- 19. Lu B (2003) BDNF and activity‐dependent synaptic modulation. Learning Memory 10:86–98. [DOI] [PMC free article] [PubMed] [Google Scholar]
- 20. Luo Y, Yang X, Zhao S, Wei C, Yin Y, Liu T, et al (2013) Hydrogen sulfide prevents OGD/R‐induced apoptosis via improving mitochondrial dysfunction and suppressing an ROS‐mediated caspase‐3 pathway in cortical neurons. Neurochem Int 63:826–831. [DOI] [PubMed] [Google Scholar]
- 21. McCubrey JA, Steelman LS, Chappell WH, Abrams SL, Wong EW, Chang F, et al (2007) Roles of the Raf/MEK/ERK pathway in cell growth, malignant transformation and drug resistance. Biochimica et Biophysica Acta 1773:1263–1284. [DOI] [PMC free article] [PubMed] [Google Scholar]
- 22. Morris R (1984) Developments of a water‐maze procedure for studying spatial learning in the rat. J Neurosci Met 11:47–60. [DOI] [PubMed] [Google Scholar]
- 23. Papadia S, Hardingham GE (2007) The dichotomy of NMDA receptor signaling. Neuroscientist 13:572–579. [DOI] [PMC free article] [PubMed] [Google Scholar]
- 24. Peake BF, Nicholson CK, Lambert JP, Hood RL, Amin H, Amin S, et al (2013) Hydrogen sulfide preconditions the db/db diabetic mouse heart against ischemia‐reperfusion injury by activating Nrf2 signaling in an Erk‐dependent manner. Am J Physiol 304:H1215–H1224. [DOI] [PMC free article] [PubMed] [Google Scholar]
- 25. Rauch J, Volinsky N, Romano D, Kolch W (2011) The secret life of kinases: functions beyond catalysis. Cell Commun Signal 9:23. [DOI] [PMC free article] [PubMed] [Google Scholar]
- 26. Sabri M, Kawashima A, Ai J, Macdonald RL (2008) Neuronal and astrocytic apoptosis after subarachnoid hemorrhage: a possible cause for poor prognosis. Brain Res 1238:163–171. [DOI] [PMC free article] [PubMed] [Google Scholar]
- 27. Schabitz WR, Schwab S, Spranger M, Hacke W (1997) Intraventricular brain‐derived neurotrophic factor reduces infarct size after focal cerebral ischemia in rats. J Cereb Blood Flow Metab 17:500–506. [DOI] [PubMed] [Google Scholar]
- 28. Sehba FA, Hou J, Pluta RM, Zhang JH (2012) The importance of early brain injury after subarachnoid hemorrhage. Progr Neurobiol 97:14–37. [DOI] [PMC free article] [PubMed] [Google Scholar]
- 29. Sherchan P, Lekic T, Suzuki H, Hasegawa Y, Rolland W, Duris K, et al (2011) Minocycline improves functional outcomes, memory deficits, and histopathology after endovascular perforation‐induced subarachnoid hemorrhage in rats. J Neurotrauma 28:2503–2512. [DOI] [PMC free article] [PubMed] [Google Scholar]
- 30. Siironen J, Juvela S, Kanarek K, Vilkki J, Hernesniemi J, Lappalainen J (2007) The Met allele of the BDNF Val66Met polymorphism predicts poor outcome among survivors of aneurysmal subarachnoid hemorrhage. Stroke 38:2858–2860. [DOI] [PubMed] [Google Scholar]
- 31. Takata K, Sheng H, Borel CO, Laskowitz DT, Warner DS, Lombard FW (2008) Long‐term cognitive dysfunction following experimental subarachnoid hemorrhage: new perspectives. Exp Neurol 213:336–344. [DOI] [PubMed] [Google Scholar]
- 32. Tang J, Hu Q, Chen Y, Liu F, Zheng Y, Tang J, et al (2015) Neuroprotective role of an N‐acetyl serotonin derivative via activation of tropomyosin‐related kinase receptor B after subarachnoid hemorrhage in a rat model. Neurobiol Disease 78:126–133. [DOI] [PMC free article] [PubMed] [Google Scholar]
- 33. Vazquez F, Ramaswamy S, Nakamura N, Sellers WR (2000) Phosphorylation of the PTEN tail regulates protein stability and function. Mol Cell Biol 20:5010–5018. [DOI] [PMC free article] [PubMed] [Google Scholar]
- 34. Vilkki J, Lappalainen J, Juvela S, Kanarek K, Hernesniemi JA, Siironen J (2008) Relationship of the Met allele of the brain‐derived neurotrophic factor Val66Met polymorphism to memory after aneurysmal subarachnoid hemorrhage. Neurosurgery 63:198–203; discussion. [DOI] [PubMed] [Google Scholar]
- 35. Wang JF, Li Y, Song JN, Pang HG (2014) Role of hydrogen sulfide in secondary neuronal injury. Neurochem Int 64:37–47. [DOI] [PubMed] [Google Scholar]
- 36. Wang R (2012) Physiological implications of hydrogen sulfide: a whiff exploration that blossomed. Physiol Rev 92:791–896. [DOI] [PubMed] [Google Scholar]
- 37. Wang Z, Zhan J, Wang X, Gu J, Xie K, Zhang Q, et al (2013) Sodium hydrosulfide prevents hypoxia‐induced behavioral impairment in neonatal mice. Brain Res 1538:126–134. [DOI] [PubMed] [Google Scholar]
- 38. Wei HJ, Xu JH, Li MH, Tang JP, Zou W, Zhang P, et al (2014) Hydrogen sulfide inhibits homocysteine‐induced endoplasmic reticulum stress and neuronal apoptosis in rat hippocampus via upregulation of the BDNF‐TrkB pathway. Acta Pharmacologica Sinica 35:707–715. [DOI] [PMC free article] [PubMed] [Google Scholar]
- 39. White BC, Sullivan JM, DeGracia DJ, O'Neil BJ, Neumar RW, Grossman LI, et al (2000) Brain ischemia and reperfusion: molecular mechanisms of neuronal injury. J Neurol Sci 179:1–33. [DOI] [PubMed] [Google Scholar]
- 40. Xia Y, Wang CZ, Liu J, Anastasio NC, Johnson KM (2010) Brain‐derived neurotrophic factor prevents phencyclidine‐induced apoptosis in developing brain by parallel activation of both the ERK and PI‐3K/Akt pathways. Neuropharmacology 58:330–336. [DOI] [PMC free article] [PubMed] [Google Scholar]
- 41. Zhang Q, Fu H, Zhang H, Xu F, Zou Z, Liu M, et al (2013) Hydrogen sulfide preconditioning protects rat liver against ischemia/reperfusion injury by activating Akt‐GSK‐3beta signaling and inhibiting mitochondrial permeability transition. PloS One 8:e74422. [DOI] [PMC free article] [PubMed] [Google Scholar]
- 42. Zhang Q, Yuan L, Liu D, Wang J, Wang S, Zhang Q, et al (2014) Hydrogen sulfide attenuates hypoxia‐induced neurotoxicity through inhibiting microglial activation. Pharmacol Res 84:32–44. [DOI] [PubMed] [Google Scholar]
- 43. Zhang ZY, Yang MF, Wang T, Li DW, Liu YL, Zhang JH, et al (2015) Cysteamine alleviates early brain injury via reducing oxidative stress and apoptosis in a rat experimental subarachnoid hemorrhage model. Cell Mol Neurobiol 35:543–553. [DOI] [PMC free article] [PubMed] [Google Scholar]


