

Abstract
We investigated the mechanisms underlying abnormal vascular endothelial growth factor (VEGF) production in amyotrophic lateral sclerosis (ALS). We immunohistochemically studied VEGF, its receptors VEGFR1 and 2, and hypoxia‐inducible factor‐1α (HIF‐1α) in autopsied ALS spinal cords. We also chronologically assessed the expression of HIF‐1α, karyopherin β1, karyopherin β‐cargo protein complex inhibitors and nuclear pore complex proteins in G93A mutant superoxide dismutase 1 (mSOD1) transgenic mice at presymptomatic, symptomatic and end stages. In ALS patients, compared with controls, HIF‐1α immunoreactivity in the cytoplasm of anterior horn cells (AHCs) was significantly increased, while immunoreactivities for VEGF and VEGFRs were significantly decreased. Similar changes in HIF‐1α and VEGF levels were observed in mSOD1 transgenic mice. HIF‐1α co‐localized with karyopherin β1 in the cytoplasm of AHCs and karyopherin β1 co‐localized with nucleoporin 62 (Nup62) on the nuclear envelope. From the presymptomatic stage of mSOD1 transgenic mice, karyopherin β1 immunoreactivity in AHC nuclei significantly decreased and morphological irregularities of the Nup62‐immunostained nuclear envelope became more pronounced with disease progression. Thus, in AHCs from mSOD1 transgenic mice, transport of cytoplasmic HIF‐1α to the nuclear envelope and into the nucleus is impaired from the presymptomatic stage, suggesting that impaired cytoplasmic–nuclear transport of HIF‐1α through the nuclear pore might precede motor neuron degeneration.
Keywords: amyotrophic lateral sclerosis, hypoxia‐inducible factor‐1α, impaired cytoplasmic–nuclear transport, mutant superoxide dismutase 1, vascular endothelial growth factor
Introduction
Amyotrophic lateral sclerosis (ALS) is a progressive, fatal neurodegenerative disease in which loss of motor neurons in the spinal cord, brainstem and motor cortex causes progressive motor paralysis. Although glutamate excitotoxicity 10, 44, oxidative stress 1, 5, 6, neuroinflammation 26, 32 and neurotrophic factor failure 31, 34, 35 have been proposed to explain the pathogenesis of ALS, the mechanisms underlying ALS remain to be elucidated.
We previously reported a trend toward increased amounts of vascular endothelial growth factor (VEGF) in the cerebrospinal fluid (CSF) of ALS patients, which showed a tendency to be negatively correlated with disease severity 41. VEGF, originally characterized as an angiogenic factor, is now regarded as a protective and trophic factor for neurons and glial cells 14, 42, 43. Deletion of the hypoxia‐responsive element (HRE) from the promoter of the mouse VEGF gene caused lower motor neuron degeneration 27. Crossbreeding of Vegfa knock‐out mice with mutant superoxide dismutase 1 (mSOD1) transgenic mice produced mice with more severe motor neuron degeneration 20, while neuronal overexpression of either VEGF 46 or its receptor VEGF receptor (VEGFR) 2 36, which mediates angiogenesis and neurotrophic activity 8, delayed the onset of motor impairment and prolonged the survival of mSOD1 transgenic mice 4, 36. Thus, VEGF is now considered an integral factor for motor neuron survival.
For VEGF production, hypoxia‐inducible factor‐1α (HIF‐1α) is an indispensable transcriptional mediator that binds to the HRE in the 5′ promoter of the VEGF gene 9. HIF‐1α moves from the cytoplasm to the nucleus through a classical cytoplasmic–nuclear pathway after forming a complex with karyopherin family proteins, which are regarded as a group of representative carrier proteins 9. Prior to its transport into the nucleus, karyopherin β1 binds to nucleoporin 62 (Nup62), a component of nuclear pore complexes (NPCs), on the cytoplasmic surface of the nuclear envelope of anterior horn cells [AHCs; reviewed in 28]. Karyopherin family cargo protein complexes are formed in an energy‐independent manner, and nuclear RanGTP, which is involved in cargo protein discharge, dissociates karyopherin β‐cargo complexes after their transfer through NPCs 23.
Recent studies have suggested that impaired cytoplasmic–nuclear transport might be involved in some neurological diseases 18, 25, 33, 49, in which aberrant intracytoplasmic accumulation of proteins, such as karyopherin β1, occurs 18, 49. It has also been shown that competitive inhibitors suppress the formation of karyopherin family member cargo protein complexes 25 such that beneficial signals are not successfully transported into the nucleus. Aberrant intracytoplasmic accumulation of karyopherin β1 was reported in AHCs from the mSOD1 transgenic ALS model mice 49.
In the present study, we aimed to clarify the mechanisms underlying the dysregulation of VEGF production in ALS. We first studied VEGF, its receptors VEGFR1 and 2, and HIF‐1α in AHCs from ALS patients using semiquantitative immunohistochemical analysis. Second, we chronologically assayed alterations in the cytoplasmic–nuclear transport of HIF‐1α in AHCs from mSOD1 transgenic mice at several different ages, focusing on cytoplasmic–nuclear transport‐related proteins, namely HIF‐1α, karyopherin β1, karyopherin β‐cargo protein complex inhibitors [TAT‐interacting protein 30 kDa (TIP30), heat shock protein (Hsp) 90 and Hsp60] and NPC proteins.
Materials and Methods
Tissue sources of autopsied spinal cord
Spinal cord specimens were obtained at autopsy from ALS patients (n = 6) and neurological disease‐free controls (n = 6). Patient characteristics are shown in Table 1. The post‐mortem interval ranged from 2.5 to 10 h (mean: 5.5 h). For immunostaining of HIF‐1α and VEGF, post‐mortem specimens from ALS patients (A1–6) and neurological disease‐free controls (C1–6) were fixed for several days in 10% buffered formalin, embedded in paraffin and then sliced into 6‐μm‐thick horizontal sections. The Ethical Committee concerning human autopsied materials of The Neurological Institute, Kyushu University approved the study.
Table 1.
Demographic features of amyotrophic lateral sclerosis patients and neurological disease‐free controls. A = amyotrophic lateral sclerosis; C = control; NA = not applicable
| Patient | Age (years) | Gender | Onset | Disease duration (years) | Mechanical ventilation | Cause of death |
|---|---|---|---|---|---|---|
| A1 | 55 | Female | Bulbar | 2 | − | Respiratory failure |
| A2 | 60 | Female | Upper limbs | 7 | − | Respiratory failure |
| A3 | 53 | Male | Upper limbs | 6 | − | Respiratory failure |
| A4 | 61 | Female | Bulbar | 6.5 | + | Respiratory failure |
| A5 | 67 | Male | Lower limbs | 1.6 | − | Respiratory failure |
| A6 | 65 | Male | Bulbar | 9 | + | Respiratory failure |
| C1 | 90 | Male | NA | NA | − | Gastric cancer |
| C2 | 68 | Male | NA | NA | − | Rectal cancer |
| C3 | 76 | Female | NA | NA | − | Renal failure |
| C4 | 72 | Male | NA | NA | − | Hepatocellular carcinoma |
| C5 | 73 | Male | NA | NA | − | Lung cancer |
| C6 | 48 | Male | NA | NA | − | Chronic renal failure |
Transgenic mice and tissue preparation
Transgenic mice carrying human G93A mSOD1 (B6SJL‐TgN [SOD1‐G93A] 1Gur, G1H line) were obtained from the Jackson Laboratory (Bar Harbor, ME, USA). Hemizygotes were maintained by breeding transgenic males with non‐transgenic C57BL/6 females at our animal facility. Transgenic offspring were genotyped by polymerase chain reaction (PCR) of DNA obtained from tail biopsies. These animals exhibited a predictable disease onset at about 16 weeks after birth, with leg tremor and decreased stride and muscle strength, and died at almost 20 weeks after birth. In the present study, female and male mice were sacrificed at presymptomatic (aged 8 as well as 12 weeks), early symptomatic (aged 16 weeks) and end (aged 18 weeks) stages. At least three transgenic and three non‐transgenic mice in each age group were analyzed. To obtain spinal cord tissues, mice were deeply anesthetized and perfused transcardially with phosphate‐buffered saline (PBS), and then with 4% paraformaldehyde in 0.1 M phosphate buffer. The spinal cords were carefully dissected to identify the lumbar segments. Tissue blocks were cryoprotected in 30% phosphate‐buffered sucrose overnight at 4°C, and a cryostat at −20°C was used to serially cut 15‐m‐thick sections at the L1–3 levels in the horizontal plane. This study was approved by the Recombinant DNA Experiment Safety Committee of The Neurological Institute, Kyushu University. Animals were handled in conformity with the Guidelines for the Care and Use of Laboratory Animals at our institution.
Antibodies for immunohistochemistry
The following primary antibodies were used for immunohistochemical investigations: anti‐VEGF mouse monoclonal (1:200; Millipore, Baltimore, MD, USA; clone JH121) and rabbit polyclonal (1:200; Santa Cruz Biotechnology, Santa Cruz, CA, USA) antibodies; anti‐HIF‐1α mouse monoclonal (1:200; Novus, Littleton, CO, USA; clone H1alpha67) and rabbit polyclonal (1:200; Upstate, Lake Placid, NY, USA) antibodies; anti‐VEGFR1 and VEGFR2 rabbit polyclonal antibodies (1:200; Abcam, Cambridge, UK); anti‐glial fibrillary acidic protein (GFAP) mouse monoclonal antibody (1:200; Sigma, St. Louis, MO, USA; clone G‐A‐5); anti‐neuronal nuclei (NeuN) mouse monoclonal antibody (1:200; Chemicon, Temecula, CA, USA; clone A60); anti‐karyopherin β1 rabbit polyclonal antibody (1:200; Abcam); anti‐karyopherin β1 mouse monoclonal antibody (1:200; Abcam; clone H‐7); anti‐karyopherin α3 rabbit polyclonal antibody (1:200; Bethyl, Montgomery, TX, USA); anti‐Nup62 mouse monoclonal antibody (1:200; MBL, Nagoya, Aichi, Japan; clone 53/nucleoporin p62); anti‐β‐catenin rabbit polyclonal antibody (1:4000; Chemicon); anti‐TIP30 rabbit polyclonal antibody (1:200; Abcam) and anti‐Hsp60 rabbit polyclonal antibody (1:200; Abcam); and anti‐Hsp90 rabbit polyclonal antibody (1:200; Abcam). The secondary antibodies used were horseradish peroxidase‐conjugated anti‐rabbit (PI‐1000) antibody, horseradish peroxidase‐conjugated anti‐mouse (PI‐2000) antibody (1:500; both from Vector Laboratories, Burlingame, CA, USA), Alexa Fluor® goat anti‐rabbit IgG (1:500; Invitrogen, Carlsbad, CA, USA) and Alexa Fluor® goat anti‐mouse IgG (1:500; Invitrogen).
Immunohistochemical analysis of autopsied spinal cord
Immunohistochemistry was performed using an indirect immunoperoxidase method as described previously 16, 17. Deparaffinized sections were hydrated in ethanol and then incubated with 0.3% hydrogen peroxide in absolute methanol for 30 minutes at room temperature to inhibit endogenous peroxidase. After rinsing with tap water, the sections were completely immersed in distilled water and then heated in 0.01 M citrate buffer (pH 6.0) in a microwave for 10 minutes for antigen retrieval. After this pretreatment, the sections were incubated with a primary antibody diluted in 5% normal goat serum in 20 mM Tris HCl (pH 7.6) containing 0.5 M NaCl, 0.05% NaN3 and 0.05% Tween 20 (TBST) at 4°C overnight, and then with a 1:200 dilution of the appropriate secondary antibody for 1 h at room temperature. The colored reaction product was developed using a 3,3′‐diaminobenzidine tetrahydrochloride (DAB) solution (0.02% DAB, 0.003% H2O2, 50 mM Tris HCl, pH 7.6). Spinal cord specimens from ALS patients and neurological disease‐free controls were processed simultaneously in the same reaction trays to obtain comparable staining intensities. To assess immunoreactivities in each ALS patient and control subject, all AHCs in one section at the L3 level of the spinal cord were evaluated. To conduct densitometry, the numbers of AHCs (average per patient) identified in ALS patients were as follows: 109 18 for VEGF‐positive AHCs and 104 17 for HIF‐1α‐positive AHCs. The numbers of AHCs (average per control) identified in neurological disease‐free controls were as follows: 185 30 for VEGF‐positive AHCs, 193 32 for VEGFR1‐positive AHCs, 193 32 for VEGFR2‐positive AHCs and 199 36 for HIF‐1α‐positive AHCs. Images of the AHCs were captured using a BioZero BZ‐8000 microscope (Keyence, Osaka, Japan). Densitometric analysis was performed using Image J software version 1.38 (National Institutes of Health, Bethesda, MD, USA). The quantity of immunoreactive proteins in AHCs was expressed as the optical density (OD) (pixels/μm2/cytoplasm) in accordance with a previous report 40. Relative values were calculated as follows: cytoplasm of AHCs, (mean OD of the entire cytoplasm of AHCs) − (mean OD of the posterior funiculus) 40; nucleus of AHCs, (mean OD of the entire nucleus of AHCs) − (mean OD of the posterior funiculus); and nuclear envelope of AHCs, (mean OD of the nuclear envelope of AHCs) − (mean OD of the posterior funiculus). The area of the nuclear envelope was calculated as follows: (the entire nucleus of AHCs) − [the area labeled by 4′,6‐diamidino‐2‐phenylindole (DAPI)]. Nup62 immunoreactivity in the nuclear envelope of AHCs from ALS patients and control subjects was determined by densitometry. Furthermore, samples with nuclei showing morphological irregularities were classified into the following four categories: (i) discontinuous, >75% lack of the smooth arch in the nuclear envelope; (ii) moderately irregular, 50%–75% lack; (iii) slightly irregular, 25%–49% lack; and (iv) smooth, <25% lack. The percentage of cells in each group was calculated 18.
Immunohistochemistry of spinal cords from transgenic and non‐transgenic mice
Cryopreserved sections were pretreated with 5% bovine serum albumin in PBS for 1 h at room temperature. For double‐fluorescence immunohistochemistry, the anti‐VEGF antibody was used together with the anti‐GFAP or anti‐NeuN antibody, and the anti‐HIF‐1α antibody was used together with the anti‐GFAP, anti‐NeuN, anti‐karyopherin β1, anti‐Nup62, anti‐TIP 30, anti‐Hsp 90 or anti‐Hsp 60 antibody. Sections were incubated with primary antibodies in PBS at 4°C overnight. Alexa Fluor® goat anti‐rabbit IgG and Alexa Fluor® goat anti‐mouse IgG were used as secondary antibodies. After incubation with the relevant secondary antibodies, the sections were mounted in Fluoromount™ (Vector Laboratories) and observed on a FluoView® FV300 fluorescent microscope (Olympus, Tokyo, Japan). Karyopherin β1 immunoreactivities in AHCs from three nonconsecutive lumbar spinal cord sections of each mouse from three age groups (12, 16 and 18 weeks) were assessed; mice aged 8 weeks (early presymptomatic) were also assessed to identify when these pathological changes occur. The numbers of tissue slices (average per lumbar spinal cord section) prepared for the immunohistochemistry of karyopherin β1‐immunoreactive AHCs in the four groups of mSOD1 transgenic mice aged 8, 12, 16 and 18 weeks were 156 15, 125 11, 81 7 and 74 6, respectively. The numbers of tissue slices (average per lumbar spinal cord section) prepared for the immunohistochemistry of karyopherin β1‐immunoreactive AHCs in four controls aged 8, 12, 16 and 18 weeks were 241 20, 128 11, 108 10 and 98 8, respectively. The examiner was blind to the genotype and age of each mouse. Immunoreactivity for Nup62 in the nuclear envelope of AHCs from non‐transgenic mice and mSOD1 transgenic mice aged 8, 12, 16 and 18 weeks was determined by densitometry. Furthermore, morphological irregularities were classified into four categories described earlier.
Statistical analysis
Statistical analyses of the differences in the corrected OD values obtained from densitometry of motor neurons in ALS patients and controls, and of differences in densitometric measurements of the nucleus or nuclear envelope of AHCs at each stage (n = 3–5) between mSOD1 transgenic mice and non‐transgenic mice, were made using Student's unpaired t‐test. A P‐value of <0.05 was considered statistically significant. The numbers of immunoreactive cells in mice in each group were assessed, and the nonparametric multiple comparison Steel test was used to compare differences in the mean percentages of immunoreactive cells between transgenic and non‐transgenic mice.
Results
Immunohistochemical changes in VEGF, VEGFR1, VEGFR2 and HIF‐1α in AHCs from ALS patients and disease‐free controls
We first investigated autopsied spinal cord specimens from ALS patients using an immunohistochemical method targeting VEGF, its receptors VEGFR1 and VEGFR2, and one of its transcription factors, HIF‐1α. Immunoreactivity for VEGF was observed in the cytoplasm of AHCs in all six ALS cases and all six controls (Figure 1A,B). VEGFR1 (Figure 1C,D) and VEGFR2 immunoreactivities (Figure 1E,F) were also detected in the cytoplasm of AHCs in all six ALS cases and all six controls. We also observed HIF‐1α immunoreactivity in the cytoplasm of AHCs from all six ALS cases and all six controls (Figure 1G,H). HIF‐1α immunoreactivity was only slightly enhanced in ALS cases that had limited numbers of AHCs with shrunken nuclei (Figure 1, inset). The corrected OD values for VEGF, VEGFR1 and VEGFR2 immunoreactivities in the AHCs were significantly lower in the ALS cases than in the controls (P < 0.0001, P = 0.0078 and P = 0.0048, respectively) (Figure 1I,J,K). Moreover, although it is difficult to capture in pathology images, densitometric analysis showed that a considerable fraction of ALS motor neurons had a marked decrease in the corrected VEGFR2 OD value compared with controls, but no such a trend was observed for VEGFR1. In contrast, the corrected OD values for HIF‐1α immunoreactivity in the cytoplasm of AHCs were significantly higher in ALS cases than in controls (P < 0.0001) (Figure 1L). Double immunostaining revealed that VEGF immunoreactivity was present in the cytoplasm of GFAP‐positive astrocytes in ALS cases (Figure 1M–O).
Figure 1.
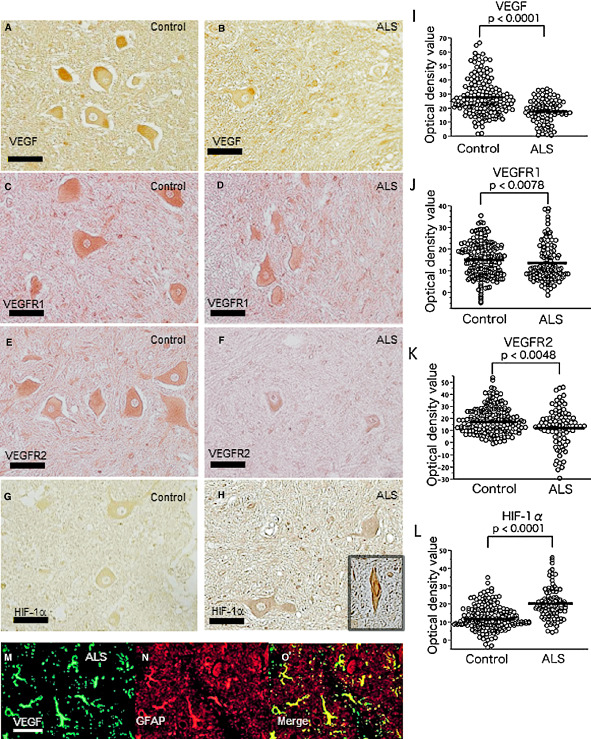
Immunohistochemistry for vascular endothelial growth factor (VEGF), vascular endothelial growth factor receptor 1(VEGFR1) and VEGFR2, and hypoxia‐inducible factor‐1α (HIF‐1α) in the spinal cord from a representative autopsied amyotrophic lateral sclerosis (ALS) patient and a control. The immunoreactivities for VEGF, VEGFR1 and VEGFR2 are less intense in the ALS patient (B, D and F, respectively) than in the control (A, C and E, respectively), whereas that for HIF‐1α in the cytoplasm of anterior horn cells (AHCs) is greater in the ALS patient (H) than in the control (G). HIF‐1α immunoreactivity is slightly enhanced with only limited numbers of shrunken AHC nuclei in ALS cases (H, inset). The corrected optical density (OD) values for the immunoreactivities of VEGF, VEGFR1 and VEGFR2, and HIF‐1α in six ALS patients and six controls are plotted (15–21 plots/patient for each protein) (I–L). The corrected OD values for VEGF, VEGFR1 and VEGFR2 are significantly lower in ALS patients than in controls (P < 0.0001; P = 0.0078; P = 0.0048, respectively) (I–K), whereas those for HIF‐1α are significantly higher (P < 0.0001) in ALS patients than in controls (l). Double immunostaining for VEGF and glial fibrillary acidic protein (GFAP) in AHCs from ALS patients (M–O) reveals that GFAP‐positive astrocytes (N) clearly express VEGF (M, O). Scale bar: 50 μm. *P < 0.0001; **P = 0.0078; ***P = 0.0048.
Immunohistochemical changes in VEGF, NeuN, HIF‐1α and GFAP in the spinal cords of mSOD1 transgenic and non‐transgenic mice
Immunostaining for VEGF and HIF‐1α was carried out in non‐transgenic mice and mSOD1 transgenic mice to assess chronological changes in the levels of these proteins during motor neuron disease progression. Double immunostaining for HIF‐1α and NeuN revealed a greater immunostaining intensity for HIF‐1α in the cytoplasm of AHCs from mSOD1 transgenic mice aged 12–18 weeks compared with that seen in their non‐transgenic counterparts (Figure 2A–I,J–R). Furthermore, in comparison with non‐transgenic mice, the immunostaining intensity for HIF‐1α in AHCs was already elevated in mSOD1 transgenic mice at 12 weeks and this elevation was sustained until 18 weeks. The nuclei of AHCs from non‐transgenic mice were not immunopositive for HIF‐1α at any of the ages examined. In mSOD1 transgenic mice, nuclear staining for HIF‐1α was not observed at 12 weeks, and only limited numbers of shrunken AHCs in mSOD1 transgenic mice had nuclei that were immunopositive for HIF‐1α at 16 and 18 weeks. Double immunostaining for VEGF and NeuN revealed that VEGF was stained less intensely in AHCs of mSOD1 transgenic mice than in those of non‐transgenic mice at ages 12–18 weeks (Figure 2S–A′,B′–J′). Compared with non‐transgenic mice, the immunostaining intensity for VEGF in AHCs of mSOD1 transgenic mice began to reduce at 12 weeks of age and continued to decline until 18 weeks of age. In contrast, the immunostaining intensity for VEGF in reactive astrocytes was greater in mSOD1 transgenic mice than in their non‐transgenic counterparts from the age of 12 weeks (Figure 2K′–M′,N′–P′).
Figure 2.
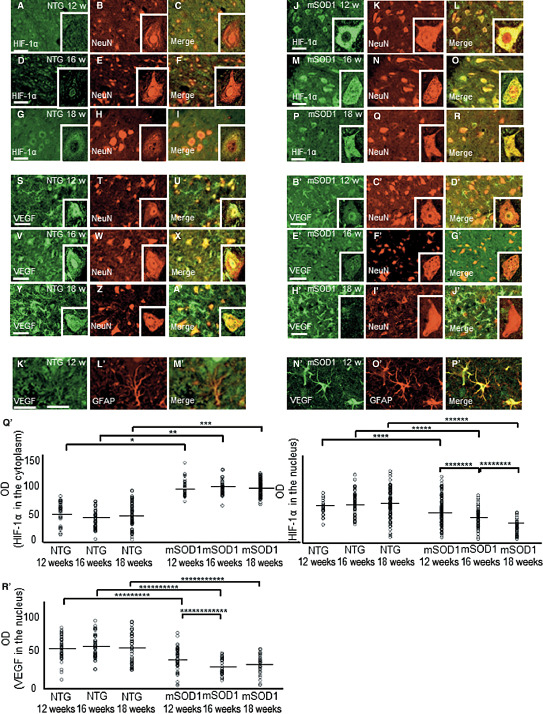
Double immunohistochemistry for hypoxia‐inducible factor‐1α (HIF‐1α) and anti‐neuronal nuclei (NeuN) (A–I, J–R), for vascular endothelial growth factor (VEGF) and NeuN (S–A′, B′–J′), and for VEGF and glial fibrillary acidic protein (GFAP) (K′–M′, N′–P′) in the spinal cords of non‐transgenic (NTG) (A–I, S–A′, K′–M′) and mutant superoxide dismutase 1 (mSOD1) transgenic (J–R, B′–J′, N′–P′) mice aged 12, 16 and 18 weeks. The immunostaining intensity for HIF‐1α in the cytoplasm of anterior horn cells (AHCs) is greater in mSOD1 transgenic mice (J–R) aged 12–18 weeks compared with their NTG counterparts (A–I). The immunostaining intensity for VEGF is less pronounced in mSOD1 transgenic mice than in NTG mice. Compared with NTG mice (S–A ′), the immunostaining intensity for VEGF in AHCs from mSOD1 transgenic mice decreases gradually from 12 to 18 weeks of age (B ′ –J ′). In contrast, the immunostaining intensity of VEGF in reactive astrocytes is greater in mSOD1 transgenic mice (N ′ –P ′) than in their littermate controls (K ′ –M ′) from the age of 12 weeks. The corrected optical density (OD) values for immunostaining intensity of HIF‐1α and VEGF in the nucleus of AHCs are significantly lower in mSOD1 transgenic mice aged 12, 16 and 18 weeks compared with those in their NTG counterparts (Q ′ , R ′). Scale bar: 100 μm (A–Z, A ′ –P ″). *P = 0.0008; **P = 0.0072; ***P = 0.0066; ****P = 0.031; *****P = 0.021; ******P = 0.016; *******P = 0.045; ********P = 0.029; *********P = 0.043; **********P = 0.026; ***********P = 0.017; ************P = 0.020.
Furthermore, the corrected OD values for immunostaining intensity of HIF‐1α in the cytoplasm of AHCs were significantly higher in the mSOD1 transgenic mice aged 12, 16 and 18 weeks than in their non‐transgenic counterparts (P = 0.0008, P = 0.0072 and P = 0.0066, respectively), while these were significantly lower (P = 0.031, P = 0.021 and P = 0.016, respectively) in the nucleus of AHCs. Intragroup comparisons revealed significant differences in immunostaining intensity of HIF‐1α in mSOD1 transgenic mice between 12 and 16 weeks of age, and between 16 and 18 weeks of age (P = 0.045 and P = 0.029, respectively) (Figure 2Q′). Significant decreases were also found in the immunostaining intensity of VEGF in mSOD1 transgenic mice between 12 and 16 weeks of age, and in mice aged 12, 16 and 18 weeks compared with non‐transgenic counterparts (P = 0.020, P = 0.043, P = 0.026 and P = 0.017, respectively; Figure 2R′). The number of neurons in mSOD1 transgenic mice spinal cords decreased as the disease progressed, probably reflecting a decrease in the number of disease‐modifying AHCs rather than a decrease in the number of age‐related AHCs. In AHCs from mutant SOD1 transgenic mice, the immunostaining intensities of HIF‐1α and VEGF were persistently low.
Immunohistochemical changes in the levels of karyopherin β1, karyopherin α and β‐catenin in AHCs from mSOD1 transgenic and non‐transgenic mice
Double immunostaining for HIF‐1α and karyopherin β1 showed co‐localization of these proteins in the nucleus and cytoplasm of AHCs from non‐transgenic mice aged 12 weeks, with labeling being more intense in the nucleus than in the cytoplasm (Figure 3A–C). In contrast, in mSOD1 transgenic mice aged 12 weeks, the proteins were co‐localized in the cytoplasm of AHCs, but nuclear staining was less intense (Figure 3D–F). Furthermore, neither karyopherin β1 nor HIF‐1α co‐localized with TIP30, Hsp60 or Hsp90 in AHCs from mSOD1 transgenic mice or non‐transgenic mice (Figure 3G–I), suggesting a lack of complex formation among these proteins. Double immunostaining using karyopherin β1 (representing the HIF‐1α–karyopherin β1 complex) and Nup62 was performed in AHCs from mSOD1 transgenic mice aged 12 weeks (Figure 3J–K) and revealed co‐localization of karyopherin β1 and Nup62 on the nuclear envelope (Figure 3L). Similar findings were obtained in AHCs from non‐transgenic mice. AHCs from non‐transgenic mice aged 8, 12, 16 and 18 weeks showed enhanced nuclear immunostaining for karyopherin β1 at 8–18 weeks of age (Figure 3M–P). In contrast, nuclear staining for karyopherin β1 in mSOD1 transgenic mice successively decreased as the disease progressed, while cytoplasmic staining for karyopherin β1 was unchanged or increased in mSOD1 transgenic mice (Figure 3Q–T). The cytoplasm of AHCs from mSOD1 transgenic mice showed increased immunostaining intensity for karyopherin α and β‐catenin as the disease progressed (Figure 3U–V,W–X). We then compared the corrected OD values for karyopherin β1 immunoreactivity in the nuclei of AHCs between non‐transgenic and mSOD1 transgenic mice aged 8, 12, 16 and 18 weeks (Figure 3Y). Intergroup comparisons revealed that the corrected OD values for karyopherin β1 immunoreactivity were significantly lower (P < 0.05) in mSOD1 transgenic mice aged 12, 16 and 18 weeks as compared with their non‐transgenic counterparts (P = 0.045, P = 0.035 and P = 0.0029, respectively). Intragroup comparisons revealed significant differences in karyopherin β1 immunoreactivity in mSOD1 transgenic mice between 8 and 12 weeks of age, between 12 and 16 weeks of age, and between 16 and 18 weeks of age (P = 0.050, P = 0.0029 and P = 0.018, respectively).
Figure 3.
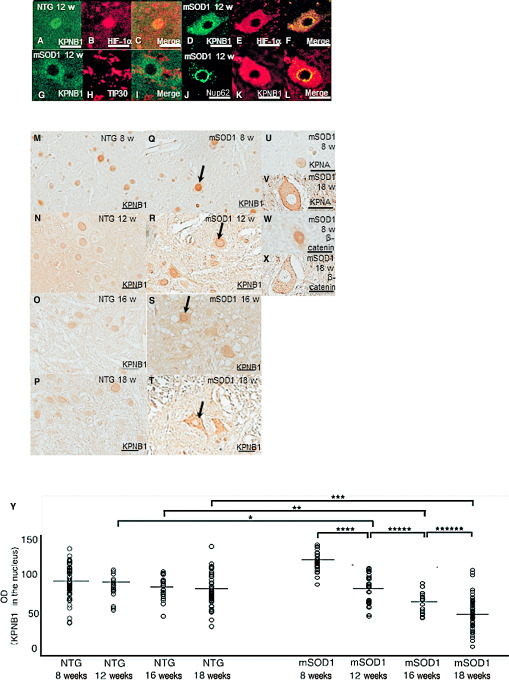
Immunohistochemistry for hypoxia‐inducible factor‐1α (HIF‐1α), karyopherin β1 (KPNB1), TAT‐interacting protein 30 kDa (TIP30), karyopherin α (KPNA) and β‐catenin in anterior horn cells (AHCs) from non‐transgenic (NTG) and mutant superoxide dismutase 1 (mSOD1) transgenic mice. Double immunostaining for KPNB1 and HIF‐1α in AHCs from 12‐week‐old NTG mice (A–C) and mSOD1 transgenic mice (D–F). Confocal microscopy of AHCs double‐immunostained for KPNB1 and HIF‐1α shows co‐localization of both proteins in the nucleus (C) and cytoplasm of AHCs (F) from 12‐week‐old NTG mice and mSOD1 transgenic mice. Confocal microscopic findings of KPNB1 and TIP30 in AHCs from 12‐week‐old mSOD1 transgenic mice (G–I). TIP30 is undetectable in AHCs (H) and is not co‐localized with KPNB1 (I). Double immunostaining for KPNB1 and nucleoporin 62 (Nup62) (J–L) in AHCs from 12‐week‐old mSOD1 transgenic mice. Confocal microscopy of AHCs double‐immunostained for KPNB1 and Nup62 shows co‐localization of both proteins on the nuclear envelope (l) of AHCs from 12‐week‐old mSOD1 transgenic mice. AHCs from NTG mice aged 8, 12, 16 and 18 weeks show nuclear immunoreactivity for KPNB1 at all examined ages (M–P), whereas nuclear immunoreactivity for KPNB1 in mSOD1 transgenic mice successively decreases as the disease progresses (allows; Q–T). The cytoplasm of AHCs from mSOD1 transgenic mice is immunopositive for KPNA (U–V) and β‐catenin (W–X), and their immunoreactivities increase as the disease progresses. The corrected OD values for KPNB1 immunoreactivity are significantly lower in mSOD1 transgenic mice aged 12, 16 and 18 weeks compared with their NTG counterparts (P < 0.05), and the value decreases significantly as the disease progresses (P < 0.05) (Y). Scale bar: 50 μm (A–K, U–X) and 100 μm (M–T). *P = 0.045; **P = 0.035; ***P = 0.0029; ****P = 0.050; *****P = 0.0029; ******P = 0.018.
Morphological changes in the nuclear envelope of AHCs from mSOD1 transgenic and non‐transgenic mice
AHCs from mSOD1 transgenic and non‐transgenic mice aged 8, 12, 16 and 18 weeks were immunostained for Nup62 (Figure 4A–D,E–H). AHCs from non‐transgenic mice aged 8–18 weeks exhibited smooth staining of the nuclear envelope. At 8 weeks, AHCs from mSOD1 transgenic mice also had a smooth nuclear envelope, but uneven Nup62 immunoreactivity and morphological irregularities of the nuclear envelope were seen at 12 weeks, and these changes worsened as the disease progressed. We then compared the corrected OD values for Nup62 in the nuclear envelope of AHCs between non‐transgenic and mSOD1 transgenic mice aged 8, 12, 16 and 18 weeks (Figure 4I). Intergroup comparisons revealed that the corrected OD values were significantly lower in mSOD1 transgenic mice aged 12, 16 and 18 weeks than in their non‐transgenic counterparts (P = 0.043, P = 0.038 and P = 0.0068, respectively). Furthermore, intragroup comparisons of the corrected OD values for nuclear envelope immunoreactivity for Nup62 revealed significant decreases in non‐transgenic mice between 8 and 12 weeks and in mSOD1 transgenic mice between 8 and 12, 16 and 18, and 8 and 18 weeks (P = 0.048, P = 0.045, P = 0.030 and P = 0.0022, respectively).
Figure 4.
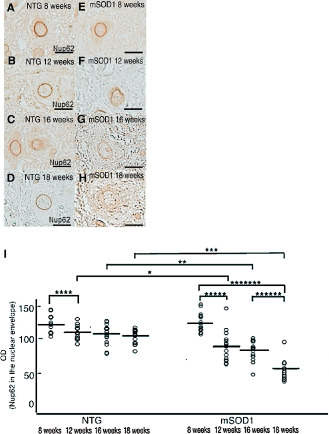
Immunoreactivity for nucleoporin 62 (Nup62) in anterior horn cells (AHCs) from non‐transgenic (NTG) (A–D) and mutant superoxide dismutase 1 (mSOD1) transgenic mice (E–H) aged 8, 12, 16 and 18 weeks. AHCs from NTG mice show normal smooth nuclear envelope staining for Nup62. At 8 weeks, mSOD1 transgenic mice have a smooth nuclear envelope, while mSOD1 transgenic mice aged 12–18 weeks show uneven, irregular nuclear envelope staining patterns. I. The corrected optical density (OD) values for Nup62 immunoreactivity are significantly lower in mSOD1 transgenic mice aged 12, 16, and 18 weeks compared with their NTG counterparts (P < 0.05), and show a tendency to be negatively correlated with disease progression. Scale bar: 50 μm (A–H), *P = 0.043; **P = 0.038; ***P = 0.0068; ****P = 0.048; *****P = 0.045; ******P = 0.030; *******P = 0.0022.
Morphological irregularities of the nuclear envelope were assessed according to four categories (smooth, slightly irregular, moderately irregular and discontinuous) in non‐transgenic and mSOD1 transgenic mice aged 8, 12, 16 and 18 weeks, and the percentages for each category were calculated (Figure 5). Intergroup comparisons of the percentages in these four categories revealed a significant difference between non‐transgenic and mSOD1 transgenic mice aged 12, 16 and 18 weeks; greater morphological irregularities were found in mSOD1 transgenic mice than in non‐transgenic mice according to nonparametric multiple comparisons (P = 0.0025, P = 0.0027 and P = 0.010, respectively). Furthermore, intragroup comparisons of the percentages showed significant differences (P < 0.05) between non‐transgenic mice aged 8 and 12 weeks, and among mSOD1 transgenic mice aged 8, 12, 16 and 18 weeks; that is, greater morphological irregularities were found in aged mice (P = 0.038, P = 0.015, P = 0.037 and P = 0.020, respectively).
Figure 5.
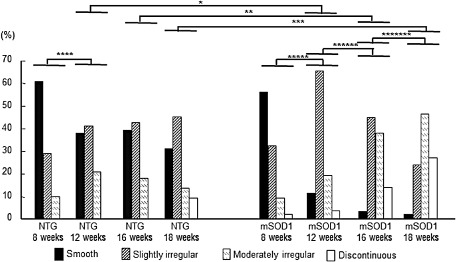
Chronological changes in the morphology of anterior horn cells (AHCs) immunostained for nucleoporin 62 (Nup62) from non‐transgenic (NTG) and mutant superoxide dismutase 1 (mSOD1) transgenic mice. The percentages of AHCs calculated according to the four morphological categories revealed a significant difference between NTG and mSOD1 transgenic mice aged 12, 16 and 18 weeks. Nonparametric multiple comparisons of intergroup differences revealed greater morphological irregularities in mSOD1 transgenic mice than in NTG mice at the ages of 12, 16 and 18 weeks (P = 0.0025; P = 0.0027; P = 0.010, respectively). There was also a significant difference between NTG mice aged 8 and 12 weeks, and among mSOD1 transgenic mice aged 8, 12, 16 and 18 weeks, with staining being more irregular in aged mice (P = 0.038; P = 0.015; P = 0.037; P = 0.020, respectively). *P = 0.0025; **P = 0.0027; ***P = 0.010; ****P = 0.038; *****P = 0.015; ******P = 0.037; *******P = 0.020.
Immunohistochemical changes in AHCs and morphological changes in the nuclear envelope of AHCs from ALS patients and disease‐free controls
AHCs from ALS patients and disease‐free controls were immunostained for karyopherin β1. Nuclear staining for karyopherin 1 decreased in AHCs from ALS patients, while AHCs from disease‐free controls showed enhanced nuclear immunostaining for karyopherin β1 (Figure 6A,B). Immunostaining for Nup62 was performed in AHCs from ALS patients and disease‐free controls to assess the immunoreactivity and morphological irregularities. AHCs from disease‐free controls exhibited smooth staining of the nuclear envelope, but uneven Nup62 immunoreactivity and morphological irregularities of the nuclear envelope were seen in AHCs from ALS patients (Figure 6C,D). We then evaluated the corrected OD values for these immunoreactivity and these morphological irregularities of the nuclear envelope for Nup62. The corrected OD values for karyopherin β1 nuclear staining and Nup62 nuclear envelope immunoreactivity revealed significant decreases in AHCs from ALS patients compared with those from disease‐free controls (P = 0.0007 and P < 0.0001, respectively; Figure 6E,F). The percentages in these four categories revealed a significant difference between ALS patients and disease‐free controls; greater morphological irregularities were found in ALS patients (P < 0.0001; Figure 6F).
Figure 6.
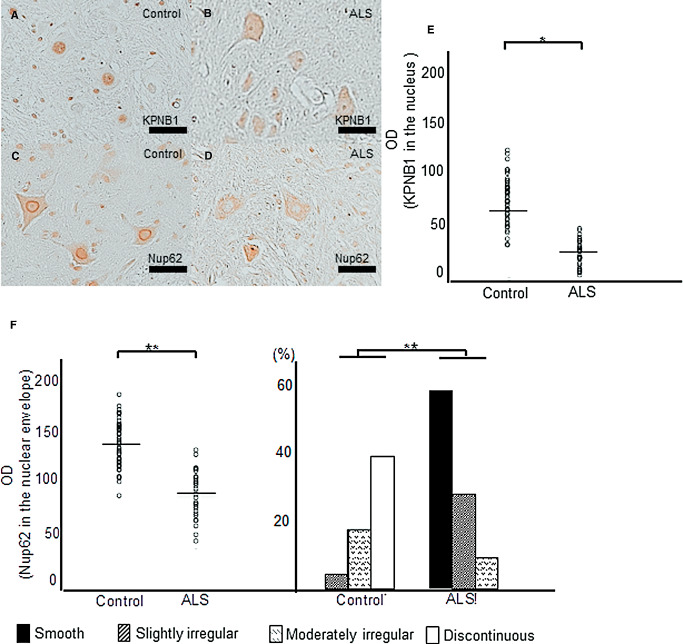
Immunohistochemical changes in anterior horn cells (AHCs) and morphological changes in the nuclear envelope of AHCs from amyotrophic lateral sclerosis (ALS) patients and disease‐free controls. Nuclear staining for karyopherin β1 (KPNB1) in AHCs from ALS patients decreases, while AHCs from disease‐free controls show enhanced nuclear immunostaining for KPNB1 (A, B). AHCs from disease‐free controls show smooth nucleoporin 62 (Nup62) staining of the nuclear envelope (C), but the nuclear envelope of AHCs from ALS patients shows uneven Nup62 immunoreactivity and morphological irregularities (D). The corrected optical density (OD) values for KPNB1 nuclear staining and nuclear envelope Nup62 immunoreactivity reveal significant decreases in ALS patients compared with that in disease‐free controls (P = 0.0007; P < 0.0001, respectively) (E, F). The percentages in these four categories reveal a significant difference between ALS patients and disease‐free controls (P < 0.0001); greater morphological irregularities are found in ALS patients (F). Scale bar: 50 μm. *P = 0.0007; **P < 0.0001.
Discussion
The main findings of this study are as follows 1. In post‐mortem ALS patients, immunoreactivity for HIF‐1α in the cytoplasm of AHCs was significantly increased compared with neurological disease‐free controls, despite the paucity of nuclear staining 2. Nevertheless, immunoreactivity for VEGF in the cytoplasm of AHCs was significantly decreased in ALS patients compared with disease‐free controls, while immunoreactivity for VEGF in reactive astrocytes was increased in ALS patients compared with controls 3. Similar to humans, increased immunoreactivity for HIF‐1α and decreased immunoreactivity for VEGF in the cytoplasm of AHCs from mSOD1 transgenic mice were seen at the presymptomatic stage, while immunostaining intensity for VEGF was also increased in reactive astrocytes in mSOD1 transgenic mice 4. HIF‐1α in the cytoplasm of AHCs formed a complex with the cytoplasmic–nuclear HIF‐1α transporter, karyopherin β1, in mSOD1 transgenic mice. Similar to non‐transgenic mice, in AHCs from mSOD1 transgenic mice at the presymptomatic stage, karyopherin β1 bound to Nup62 on the nuclear envelope, suggesting that it was successfully transported from the cytoplasm to the nuclear envelope 5. Immunoreactivity for karyopherin β1 in the nuclei of AHCs from mSOD1 transgenic mice aged 12 weeks (presymptomatic stage) was significantly lower than that in non‐transgenic mice of the same age and in mSOD1 transgenic mice aged 8 weeks. In contrast, immunoreactivity for karyopherin β1 in the cytoplasm was unchanged or increased. The amount of nuclear immunostaining for karyopherin β1 successively decreased as the disease progressed 6. Morphological irregularities of the nuclear envelope of AHCs immunostained with Nup62 were significantly more common in mSOD1 transgenic mice compared with non‐transgenic mice, even at the presymptomatic stage. Such morphological changes of the nuclear envelope of AHCs became more pronounced as the disease progressed in mSOD1 transgenic mice 7. Nup62 immunoreactivity in the nuclear envelope of AHCs from mSOD1 transgenic mice also showed a progressive decrease as the disease progressed. No such decrease was observed in non‐transgenic mice 8. In AHCs from ALS patients, nuclear immunoreactivity for karyopherin β1 and nuclear envelope immunoreactivity for Nup62 revealed significant decreases compared with that in disease‐free controls.
To the best of our knowledge, we are the first to focus on the transcriptional mediator HIF‐1α in terms of its potential roles in the mechanisms underlying ALS. It was reported that a rat model of focal cerebral ischemia 38 showed elevated intracerebral levels of VEGF. In response to hypoxia, HIF‐1α is rapidly upregulated and induces expression of VEGF and other genes acting to reduce neuronal damage 38. Under normoxic conditions, HIF‐1α undergoes HIF‐1α‐prolyl‐4‐hydroxylase‐mediated prolyl hydroxylation (PHD), which induces immediate ubiquitination and subsequent proteasomal degradation. Under a hypoxic state, HIF‐1α levels in the cytoplasm of AHCs are increased, which may be caused by the decreased activity of HIF‐1α‐prolyl‐4‐hydroxylase. Subsequently, increased binding of HIF‐1α to the HRE in the 5′ promoter region of VEGF enhances its expression, leading to increased intracellular levels of VEGF 7. In addition to hypoxia, intracellular levels of HIF‐1α are upregulated by proinflammatory cytokines, such as IL‐1 and TNF 3, 30, 47 growth factors 11, and mutant proteins such as mSOD1 21, 22, which is presumably caused by suppression of HIF‐1α‐PHD 21, 22. Elevated intrathecal levels of a variety of proinflammatory cytokines in ALS patients 24 are likely to contribute to the increase in the level of HIF‐1α. We found that HIF‐1α immunoreactivity in the cytoplasm of AHCs persistently increased in ALS patients, as also observed in mSOD1 transgenic mice at all disease stages. Nonetheless, immunoreactivity for VEGF was not increased in AHCs from ALS patients or mSOD1 transgenic mice, while immunoreactivity for VEGF in reactive astrocytes was markedly elevated. Increased production of VEGF in astrocytes may contribute to a tendency toward elevation of VEGF levels in the CSF from ALS patients 41 and is presumed to be a host defense mechanism supplementing for decreased autocrine secretion of VEGF via a paracrine mechanism. However, during ALS disease progression, the effect of astrocyte‐produced VEGF on AHCs may be diminished because of the marked downregulation of VEGF receptors, especially VEGFR2 36, as revealed in the present study.
One possible explanation for the decreased intracellular levels of VEGF in spite of increased HIF‐1α levels in the AHC cytoplasm is that the cytoplasmic–nuclear transport of HIF‐1α is impaired in AHCs. Although inhibition of the formation of cargo protein karyopherin family complexes impairs cytoplasmic–nuclear transport in ALS with mutant TAR DNA‐binding protein 43 2, 29, 48 and in ALS with fused in sarcoma/translocated in liposarcoma mutations 12, 13, 19, 45, as well as in multiple sclerosis 25, inhibition of cargo protein binding by karyopherin β1 inhibitors, such as TIP30, Hsp60 or Hsp90, was not observed. In contrast, our data indicate the binding of HIF‐1α to karyopherin β1 in the cytoplasm of AHCs and the successful transport of karyopherin β1 to Nup62 on the cytoplasmic side of NPCs on the nuclear envelope. Thus, it is conceivable that the impairment in cytoplasmic–nuclear transport, which is already seen at the presymptomatic stage in mSOD1 transgenic mice, probably occurs at NPCs. Such a hypothesis is consistent with previous findings that karyopherin β1, a cytoplasmic–nuclear transporter, and its related proteins accumulate in the cytoplasm of AHCs from ALS patients and mSOD1 transgenic mice, while their levels were decreased in nuclei 19, 49.
Our chronological study revealed a significant decrease in the immunoreactivity for karyopherin β1 in the nuclei of AHCs in mSOD1 transgenic mice, whereas karyopherin β1 immunoreactivity in the cytoplasm was unchanged or increased. Other cytoplasmic–nuclear transporters, namely karyopherin α‐ and β‐catenin, showed gradual increases in immunoreactivity in the cytoplasm of AHCs with disease progression, suggesting chronologically impaired cytoplasmic–nuclear transport of these cargo proteins. Our study further illustrates the exaggeration of nuclear envelope irregularities and the decrease in Nup62 nuclear envelope staining coinciding with disease progression in mSOD1 transgenic mice, consistent with the findings of previous studies using antibodies for other transporters (eg, Nup88 and Nup153) 18. In particular, a significant difference in the proportion of AHCs with nuclear envelope irregularities from mSOD1 transgenic mice aged 8–12 weeks suggests the occurrence of nuclear envelope alterations in the presymptomatic stage of the disease. The functional consequences of the reported nuclear membrane indentations are not yet known in detail 39; however, nucleoporins, such as Nup50, Nup62 and Nup98, have been shown to interact with chromatin in the nucleoplasm and to enhance transcription of developmentally active genes 15. Our findings thus suggest that the decreased expression of nucleoporins in mSOD1 transgenic ALS model mice may exert deleterious effects on transcriptionally active genes inside the nucleoplasm. The mutations in triple A syndrome, which presents with a progressive involvement of upper and lower motor neurons, selectively affect a karyopherin β‐mediated import pathway, decreasing nuclear accumulation of karyopherin β and cargo proteins 37. Therefore, it is also possible that an impairment of cytoplasmic–nuclear transport at NPCs may constitute a common pathway in motor neuron degeneration in both hereditary and sporadic ALS.
In conclusion, dysregulation of VEGF and decreased immunoreactivity for VEGFR2, which mediates the neuroprotective effects of VEGF in vitro 27 and in vivo 36, in AHCs from post‐mortem ALS patients was identified as one possible cause of the disease. The findings of the present study suggest that impaired cytoplasmic–nuclear transport of HIF‐1α at NPCs might precede the motor neuron degeneration in ALS and play a role in VEGF dysregulation at presymptomatic and subsequent stages. Such an impairment of cytoplasmic–nuclear transport may be one component of the mechanism underlying ALS, in which the neuroprotective VEGF‐VEGFR2 pathway 8 is dampened.
Conflict of interest
The authors declare that they have no conflict of interest.
Acknowledgments
This work was supported by a Grant‐in‐Aid for Young Scientists (B) from the Ministry of Education, Culture, Sports, Science and Technology, Japan.
References
- 1. Andrus PK, Fleck TJ, Gurney ME, Hall ED (1998) Protein oxidative damage in a transgenic mouse model of familial amyotrophic lateral sclerosis. J Neurochem 71:2041–2048. [DOI] [PubMed] [Google Scholar]
- 2. Arai T, Hasegawa M, Akiyama H, Ikeda K, Nonaka T, Mori H et al (2006) TDP‐43 is a component of ubiquitin‐positive tau‐negative inclusions in frontotemporal lobar degeneration and amyotrophic lateral sclerosis. Biochem Biophys Res Comm 351:602–611. [DOI] [PubMed] [Google Scholar]
- 3. Argaw AT, Zhang Y, Snyder BJ, Zhao ML, Kopp N, Lee SC et al (2006) IL‐1beta regulates blood‐brain barrier permeability via reactivation of the hypoxia‐angiogenesis program. J Immunol 177:5574–5584. [DOI] [PubMed] [Google Scholar]
- 4. Azzouz M, Ralph GS, Storkebaum E, Walmsley LE, Mitrophanous KA, Kingsman SM et al (2004) VEGF delivery with retrogradely transported lentivector prolongs survival in a mouse ALS model. Nature 429:413–417. [DOI] [PubMed] [Google Scholar]
- 5. Barber SC, Mead RJ, Shaw PJ (2006) Oxidative stress in ALS: a mechanism of neurodegeneration and a therapeutic target. Biochim Biophys Acta 1762:1051–1067. [DOI] [PubMed] [Google Scholar]
- 6. Beal MF, Ferrante RJ, Browne SE, Matthews RT, Kowall NW, Brown RH Jr (1997) Increased 3‐nitrotyrosine in both sporadic and familial amyotrophic lateral sclerosis. Ann Neurol 42:644–654. [DOI] [PubMed] [Google Scholar]
- 7. Bergeron M, Gidday JM, Yu AY, Semenza GL, Ferriero DM, Sharp FR (2000) Role of hypoxia‐inducible factor‐1 in hypoxia‐induced ischemic tolerance in neonatal rat brain. Ann Neurol 48:285–296. [PubMed] [Google Scholar]
- 8. Brockington A, Wharton SB, Fernando M, Gelsthorpe CH, Baxter L, Ince PG et al (2006) Expression of vascular endothelial growth factor and its receptors in the central nervous system in amyotrophic lateral sclerosis. J Neuropathol Exp Neurol 65:26–36. [DOI] [PubMed] [Google Scholar]
- 9. Depping R, Steinhoff A, Schindler SG, Friedrich B, Fagerlund R, Metzen E et al (2008) Nuclear translocation of hypoxia‐inducible factors (HIFs): involvement of the classical importin α/β pathway. Biochim Biophys Acta Mol Cell Res 1783:394–404. [DOI] [PubMed] [Google Scholar]
- 10. Fujita Y, Yamauchi Y, Shibayami K, Ando M, Honda M, Nagata Y (1996) Decreased cytochrome oxidase c but unchanged superoxide dismutase and glutathione peroxidase activities in the spinal cord of patients with amyotrophic lateral sclerosis. J Neurosci Res 45:276–281. [DOI] [PubMed] [Google Scholar]
- 11. Fukuda R, Hirota K, Fan F, Young DJ, Lee ME, Gregg LS (2002) Insulin like growth factor 1 induces HIF‐1α‐mediated VEGF expression, which is dependent on MAP kinase and phosphatidylinositol 3‐kinase signalling in colon cancer cells. J Biol Chem 277:38205–38211. [DOI] [PubMed] [Google Scholar]
- 12. Fushimi K, Long C, Jayaram N, Chen X, Li L, Wu JY (2011) Expression of human FUS/TLS in yeast leads to protein aggregation and cytotoxicity, recapitulating key features of FUS proteinopathy. Protein Cell 2:141–149. [DOI] [PMC free article] [PubMed] [Google Scholar]
- 13. Ito D, Seki M, Tsunoda Y, Uchiyama H, Suzuki N (2010) Nuclear transport impairment of amyotrophic lateral sclerosis‐linked mutations in FUS/TLS. Ann Neurol 69:152–162. [DOI] [PubMed] [Google Scholar]
- 14. Jin K, Zhu Y, Sun Y, Mao XO, Xie L, Greenberg DA (2002) Vascular endothelial growth factor (VEGF) stimulates neurogenesis in vitro and in vivo . Proc Natl Acad Sci U S A 99:11946–11950. [DOI] [PMC free article] [PubMed] [Google Scholar]
- 15. Kalverda B, Pickersgill H, Shloma V, Fornerod M (2010) Nucleoporins directly stimulate expression of developmental and cell‐cycle genes inside the nucleoplasm. Cell 140:360–371. [DOI] [PubMed] [Google Scholar]
- 16. Kikuchi H, Furuta A, Nishioka K, Suzuki SO, Nakabeppu Y, Iwaki T (2002) Impairment of mitochondrial DNA repair enzymes against accumulation of 8‐oxo‐guanine in the spinal motor neurons of amyotrophic lateral sclerosis. Acta Neuropathol 103:408–414. [DOI] [PubMed] [Google Scholar]
- 17. Kikuchi H, Yamada T, Furuya H, Doh‐ura K, Ohyagi Y, Iwaki T, Kira J (2003) Involvement of cathepsin B in the motor neuron degeneration of amyotrophic lateral sclerosis. Acta Neuropathol 105:462–468. [DOI] [PubMed] [Google Scholar]
- 18. Kinoshita Y, Ito H, Hirano A, Kengo F, Wate R, Nakamura M et al (2009) Nuclear contour irregularity and abnormal transporter protein distribution in anterior horn cells in ALS. J Neuropathol Exp Neurol 68:1184–1192. [DOI] [PubMed] [Google Scholar]
- 19. Kwiatkowski JTJ, Bosco DA, LeClerc LA, Tamrazian E, Vanderburg CR, Russ C et al (2009) Mutations in the FUS/TLS gene on chromosome 16 cause familial amyotrophic lateral sclerosis. Science 323:1205–1208. [DOI] [PubMed] [Google Scholar]
- 20. Lambrechts D, Storkebaum E, Morimoto M, Del‐Favero J, Desmet F, Marklund SL et al (2003) VEGF is a modifier of amyotrophic lateral sclerosis in mice and humans and protects motoneurons against ischemic death. Nat Genet 34:383–394. [DOI] [PubMed] [Google Scholar]
- 21. Mali Y, Zisapels N (2008) Gain of interaction of ALS‐linked G93A superoxide dismutase with cytosolic malate dehydrogenase. Neurobiol Dis 32:133–141. [DOI] [PubMed] [Google Scholar]
- 22. Mali Y, Zisapels N (2010) A novel decoy that interrupts G93A‐superoxide dismutase gain of interaction with malate dehydrogenase improves survival in an amyotrophic lateral sclerosis cell model. J Med Chem 52:5442–5448. [DOI] [PubMed] [Google Scholar]
- 23. Melchior F, Guan T, Yokoyama N, Nishimoto T, Gerace L (1995) GTP hydrolysis by Ran occurs at the nuclear pore complex in an early step of protein import. J Cell Biol 131:571–581. [DOI] [PMC free article] [PubMed] [Google Scholar]
- 24. Mitchell RM, Freeman WM, Randazzo WT, Stephens HE, Beard JL, Simmons Z, Connor JR (2009) A CSF biomarker panel for identification of patients with amyotrophic lateral sclerosis. Neurology 72:14–19. [DOI] [PubMed] [Google Scholar]
- 25. Nakahara J, Kanekura K, Nawa M, Aiso S, Suzuki N (2009) Abnormal expression of TIP30 and arrested nucleocytoplasmic transport within oligodendrocyte precursor cells in multiple sclerosis. J Clin Invest 119:169–181. [DOI] [PMC free article] [PubMed] [Google Scholar]
- 26. Neusch C, Bähr M, Schneider‐Gold C (2007) Glia cells in amyotrophic lateral sclerosis: new clues to understanding an old disease? Muscle Nerve 35:712–724. [DOI] [PubMed] [Google Scholar]
- 27. Oosthuyse B, Moons L, Storkebaum E, Beck H, Nuyens D, Brusselmans K et al (2001) Deletion of the hypoxia‐response element in the vascular endothelial growth factor promoter causes motor neuron degeneration. Nat Genet 28:131–138. [DOI] [PubMed] [Google Scholar]
- 28. Pemberton LF, Paschal PM (2005) Mechanisms of receptor‐mediated nuclear import and nuclear export. Traffic 6:187–198. [DOI] [PubMed] [Google Scholar]
- 29. Pesiridis GS, Virginia M, Lee Y, Trojanowski JQ (2009) Mutations in TDP‐43 link glycine‐rich domain functions to amyotrophic lateral sclerosis. Hum Mol Genet 18:156–162. [DOI] [PMC free article] [PubMed] [Google Scholar]
- 30. Ristimaki A, Narko K, Enholm B, Joukov V, Alitalo K (1998) Proinflammatory cytokines regulate expression of the lymphatic endothelial mitogen vascular endothelial growth factor‐C. J Biol Chem 273:8413–8418. [DOI] [PubMed] [Google Scholar]
- 31. Rosenstein JM, Mani N, Khaibullina A, Krum JM (2003) Neurotrophic effects of vascular endothelial growth factor on organotypic cortical explants and primary cortical neurons. J Neurosci 23:11036–11044. [DOI] [PMC free article] [PubMed] [Google Scholar]
- 32. Sargsyan SA, Monk PN, Shaw PJ (2005) Microglia as potential contributors to motor neuron injury in amyotrophic lateral sclerosis. Glia 51:241–253. [DOI] [PubMed] [Google Scholar]
- 33. Shefield LG, Miskiewicz HB, Tannenbaum LB, Mirra SS (2006) Nuclear pore complex proteins in Alzheimer disease. J Neuropathol Exp Neurol 65:45–54. [DOI] [PubMed] [Google Scholar]
- 34. Silverman WF, Krum JM, Mani N, Rosenstein JM (1999) Vascular, glial and neuronal effects of vascular endothelial growth factor in mesencephalic explant cultures. Neuroscience 90:1529–1541. [DOI] [PubMed] [Google Scholar]
- 35. Sondell M, Lundborg G, Kanje M (1999) Vascular endothelial growth factor stimulates Schwann cell invasion and neovascularization of acellular nerve grafts. Brain Res 846:219–228. [DOI] [PubMed] [Google Scholar]
- 36. Storkebaum E, Lambrechts D, Dewerchin M, Moreno‐Murciano MP, Appelmans S, Oh H et al (2005) Treatment of motoneuron degeneration by intracerebroventricular delivery of VEGF in a rat model of ALS. Nat Neurosci 8:85–92. [DOI] [PubMed] [Google Scholar]
- 37. Storr HL, Clark AJL, Priestley JV, Michael JG (2005) Identification of the sites of expression of triple a syndrome mRNA in the rat using in situ hybridisation. Neuroscience 131:113–123. [DOI] [PubMed] [Google Scholar]
- 38. Sun Y, Jin K, Xie L, Childs J, Mao XO, Logvinova A, Greenberg DA (2003) VEGF‐induced neuroprotection, neurogenesis, and angiogenesis after focal cerebral ischemia. J Clin Invest 111:1843–1851. [DOI] [PMC free article] [PubMed] [Google Scholar]
- 39. Takahashi H, Egawa S, Piao YS, Hayashi S, Yamada M, Shimohata T et al (2001) Neuronal nuclear alterations in dentatorubral‐pallidoluysian atrophy: ultrastructural and morphometric studies of the cerebellar granule cells. Brain Res 2001:12–19. [DOI] [PubMed] [Google Scholar]
- 40. Tanaka M, Kikuchi H, Ishizu T, Minohara M, Osoegawa M, Motomura K et al (2006) Intrathecal upregulation of granulocyte colony stimulating factor and its neuroprotective actions on motor neurons in amyotrophic lateral sclerosis. J Neuropathol Exp Neurol 65:816–825. [DOI] [PubMed] [Google Scholar]
- 41. Tateishi T, Yamasaki R, Tanaka M, Matsushita T, Kikuchi H, Isobe N et al (2010) CSF chemokine alterations related to the clinical course of amyotrophic lateral sclerosis. J Neuroimmunol 222:76–81. [DOI] [PubMed] [Google Scholar]
- 42. Tolosa L, Mir M, Asensio VJ, Olmos G, Llado J (2008) Vascular endothelial growth factor protects spinal cord motoneurons against glutamate‐induced excitotoxicity via phosphatidylinositol 3‐kinase. J Neurochem 105:1080–1090. [DOI] [PubMed] [Google Scholar]
- 43. Tolosa L, Mir M, Olmos G, Llado J (2009) Vascular endothelial growth factor protects motoneurons from serum deprivation‐induced cell death through phosphatidylinositol 3‐kinase‐mediated p38 mitogen‐activated protein kinase inhibition. Neuroscience 158:1348–1355. [DOI] [PubMed] [Google Scholar]
- 44. Van Den Bosch L, Van Damme P, Bogaert E, Robberecht W (2006) The role of excitotoxicity in the pathogenesis of amyotrophic lateral sclerosis. Biochim Biophys Acta 1762:1068–1082. [DOI] [PubMed] [Google Scholar]
- 45. Vance C, Rogelj B, Hortobágyi T, De Vos KJ, Nishimura AL, Sreedharan J et al (2009) Mutations in FUS, an RNA processing protein, cause familial amyotrophic lateral sclerosis type 6. Science 323:1208–1211. [DOI] [PMC free article] [PubMed] [Google Scholar]
- 46. Wang Y, Mao XO, Xie L, Banwait S, Marti HH, Greenberg DA, Jin K (2007) Vascular endothelial growth factor overexpression delays neurodegeneration and prolongs survival in amyotrophic lateral sclerosis mice. J Neurosci 27:304–307. [DOI] [PMC free article] [PubMed] [Google Scholar]
- 47. Westra J, Brouwer E, Bos R, Doornbos‐van der Meer B, Kallenberg CG, Limburg PC (2007) Regulation of cytokine‐induced HIF‐1alpha expression in rheumatoid synovial fibroblasts. Ann New York Acad Sci 1108:340–348. [DOI] [PubMed] [Google Scholar]
- 48. Xu Y, Gendron TF, Zhang YJ, Lin WL, D'Alton S, Sheng H et al (2010) Wild‐type human TDP‐43 expression causes TDP‐43 phosphorylation, mitochondrial aggregation, motor deficits, and early mortality in transgenic mice. J Neurosci 30:10851–10859. [DOI] [PMC free article] [PubMed] [Google Scholar]
- 49. Zhang J, Ito H, Wate R, Ohnishi S, Nakano S, Kusaka H (2006) Altered distributions of nucleocytoplasmic transport‐related proteins in the spinal cord of a mouse model of amyotrophic lateral sclerosis. Acta Neuropathol 112:673–680. [DOI] [PubMed] [Google Scholar]