

Abstract
We investigated gene expression and functional differences between Ts1Cje mice and wild‐type (WT) littermates in adult cerebral cortex and hippocampus. These two brain regions are affected in people with Down syndrome, but have not been previously molecularly characterized in Ts1Cje mice. Total RNA was prepared from the brains of 8–10‐week‐old Ts1Cje mice (n = 6) and WT littermates (n = 5) and hybridized to Affymetrix 1.0 ST gene mouse arrays. Differentially regulated genes were identified and used to perform in silico functional analyses to better characterize dysregulated pathways in both brain regions. Hippocampus had more significantly differentially expressed genes compared with cortex (30 vs. 7 at a Benjamini‐Hochberg false discovery rate of 20%). We identified novel genes that were differentially regulated in adult brains, including Cyb5r1, Fsbp, Vmn2r110, Snd1 and Zhx2. Functional analyses in Ts1Cje mice highlighted the importance of NFAT signaling, oxidative stress, neuroinflammation and olfactory perception via G‐protein signaling. In a comparison of adult Ts1Cje and WT brains, we identified new genes and pathway differences in the cortex and hippocampus. Our analyses identified physiologically relevant pathways that can serve as targets for the development of future treatments to improve neurocognition in Down syndrome.
Keywords: Brain, Down syndrome, gene expression, mouse model, pathway dysregulation
Introduction
Down syndrome (DS) is characterized by a complex phenotype that includes developmental disabilities and congenital anomalies 25. In children and young adults with DS, magnetic resonance imaging studies show a generalized microcephaly that is more pronounced in the frontal lobe, hippocampus and cerebellum. The volume of these regions is 15%–30% smaller in people with DS compared with controls 43, 56, 61. DS‐associated microcephaly originates during fetal life, with a significant reduction in brain weight that begins as early as 15 weeks of gestation and accelerates during the third trimester 16, 51. Analyses of fetal and adult post‐mortem brains from individuals with DS have demonstrated decreased neurogenesis and neuronal density in the frontal lobe, hippocampus and cerebellum, as well as a significant delay in synapse formation and axon myelination 1, 15, 28, 51. These developmental brain morphogenetic changes are thought to be the underlying basis of the cognitive disabilities in DS 38, 58, 63.
To better understand the pathophysiology of DS, several mouse models have been constructed. Of these, Ts65Dn and Ts1Cje strains are the most widely used 8, 48, although there are far fewer publications on Ts1Cje (39 entries on PubMed up to February 2014) compared with Ts65Dn (281 entries for the same period). Ts1Cje mice are trisomic for 77 mouse chromosome 16 (MMU16) genes that are orthologous to genes on human chromosome 21 (HSA21). This duplication is the result of a translocation involving an MMU16 fragment distal to Sod1 and the chromosome 12 subtelomeric region with a translocation breakpoint mapped to Dnahc11 11. Ts1Cje mice exhibit hypoplasia of the hippocampus and the cerebellum, reduced neurogenesis and abnormal synaptogenesis 24, 41. They also display delayed spatial memory in the Morris water maze, as well as decreased long‐term potentiation and increased long‐term depression in the hippocampus, suggesting altered balances in excitatory/inhibitory neuronal transmission that are important for normal learning 49, 53.
Despite available information on the gross anatomical and histological abnormalities in human subjects and mouse models of DS, very little is known about the molecular changes and signaling pathways that lead to functional differences in neurocognition. To date, three studies have investigated gene expression changes in human adult and fetal post‐mortem brains 31, 32, 33. These studies identified functional abnormalities in adult prefrontal cortex and fetal cerebrum or cerebellum. In Ts1Cje mice, the few published gene expression data on brain tissue are limited to the whole brain 2 or the cerebellum 29, 44. Other groups have investigated gene expression changes in cultured neurospheres isolated from the subventricular zone of post‐mortem human fetuses with DS or from Ts1Cje mice 13, 18, 37. Gene expression data for clinically affected regions, such as hippocampus and cortex, have not yet been obtained.
To address this gap in knowledge, we investigated gene expression changes in the cerebral cortex and the hippocampus of adult Ts1Cje mice using whole transcriptome mouse gene 1.0 ST arrays. This study was performed to identify genes and signaling pathways that are consistently affected in the different brain regions, and to accurately describe the effects of the translocation between MMU12 and MMU16 on gene expression in the brain. The long‐term goal of this work is to identify functional abnormalities that can serve as targets for future neurocognitive treatments in humans with DS.
Materials and Methods
Animals and genotyping
All experiments were conducted according to international ethical standards and approved by the Institutional Animal Care and Use Committee of Tufts University (Protocol B2011‐37). Mice were housed in standard cages with food and water ad libitum under a controlled environment (temperature = 20°C; humidity = 60%) and a light/dark cycle of 12 h. Ts1Cje colony founders were kindly provided by Dr. Roger Reeves (Johns Hopkins University, Baltimore, MD, USA). At Tufts, Ts1Cje males were backcrossed to C57Bl/6J females (Jackson Laboratories, Bar Harbor, ME, USA) for six generations before our experiments started. Ts1Cje mice and their littermate controls were obtained from three different litters with 3–4 mice/litter.
Genomic DNA was purified from tails using a standard isopropanol precipitation protocol 14.
Genotyping was carried out on 100 ng of genomic DNA using the multiplex PCR protocol previously described 41. PCR products were subjected to 2% agarose gel electrophoresis and visualized under ultraviolet light. Ts1Cje mice were identified by the presence of the 270 bp neomycin cassette amplicon.
Brain dissection and RNA isolation
For the microarray experiments, 8–10‐week‐old Ts1Cje females (n = 6) and their wild‐type (WT) littermates (n = 5) were euthanized by cervical dislocation followed by decapitation. The brains were rapidly removed. The whole cerebral cortex and the hippocampus from both hemispheres were dissected on a cold platform and snap frozen in liquid nitrogen before storage at −80°C.
Total RNA was isolated using the NucleoSpin RNA L and RNA II kits for the cortex and hippocampus respectively, following the manufacturer's instructions (Macherey‐Nagel, Bethlehem, PA, USA). RNA concentrations were measured as absorbance at 260 nm on the Nanodrop instrument (Thermo Fisher Scientific, Waltham, MA, USA). RNA quality was analyzed with the Bioanalyzer (Agilent Biotechnologies, Santa Clara, CA, USA) using the RNA 6000 Nano kit according to the manufacturer's instructions. Only samples displaying an A260/A280 ratio of 2.0–2.1 and a RNA integrity number >9 were used for hybridization to the arrays.
Microarray experiments
RNA was further processed for hybridization to Affymetrix mouse gene 1.0 ST arrays (Affymetrix, Santa Clara, CA, USA). RNA amplification, biotin labeling and hybridization, washing and scanning were carried out according to Affymetrix protocols (http://www.affymetrix.com). Eleven arrays were used for each tissue (six Ts1Cje and five WT). Each array corresponded to labeled RNA from one brain region of one individual sample. Quality control and normalization were performed using the pipeline at the www.arrayanalysis.org website (Maastricht University, Maastricht, the Netherlands) 12.
Normalization was performed using the robust multichip average algorithm 22 and the MBNI custom CDF (http://brainarray.mbni.med.umich.edu/) version #15 for the mouse gene 1.0 ST array 7. All arrays passed the quality control steps. Normalization output consisted of data for 21 225 probe sets each corresponding to unique Entrez Gene IDs.
Bioinformatics analysis of microarray data
Statistical analyses were carried out on the normalized data using R software (version 2.13.1, R Foundation for Statistical Computing, Vienna, Austria) unless indicated otherwise. Gene expression data between WT and Ts1Cje tissue were compared using an unpaired t‐test. Analyses were performed using Benjamini‐Hochberg false discovery rates (BH‐FDR) of 5% and 20% as cut‐offs 4. Gene expression data were further visualized in R by means of a heatmap combined with hierarchical clustering (Euclidean distance metric, Ward linkage).
Whole transcriptome analysis of functional gene set regulation was determined by Gene Set Enrichment Analysis (GSEA) 55, using pre‐ranked Ts1Cje/WT median gene expression ratios as input, and default analysis parameters. Gene sets used were from the c1.all (chromosomal positions), c2.cp (canonical pathways) and c5.all (Gene Ontology; GO) collections downloaded from the Molecular Signatures Database (MSigDB, www.broadinstitute.org/gsea/msigdb/) v3.1. Gene sets were considered regulated if the GSEA P‐value, derived using gene permutation because of the small number of samples, was <0.05 for both cortex and hippocampus, and their regulation had the same direction in both of these tissues.
Because the small number of differentially regulated genes at a BH‐FDR <20% limited pathway discovery, functional enrichment analysis was performed on the top 1% genes based on Ts1Cje/WT median expression fold change. Overrepresentation analysis for functional databases, such as GO and UniProt, was carried out using the Database for Annotation, Visualization, and Integrated Discovery (DAVID) (http://david.abcc.ncifcrf.gov) 20. Significant terms in both upregulated or downregulated gene lists were identified according to the DAVID algorithm.
We used the cortex and hippocampus data for in silico functional analyses, using GSEA and DAVID software tools, to identify gene sets from multiple annotation classes (chromosomal loci, GO terms and canonical pathways) that were consistently disrupted in both brain regions of Ts1Cje mice. DAVID was used to identify gene sets that were overrepresented among the genes showing individual, significant differential expression, and GSEA was used to find sets of genes with significant, consistent trends even if some of the individual genes did not, by themselves, meet the significance criteria used.
As a control on trisomic/monosomic chromosomal loci, (geometric) average gene expression ratios between Ts1Cje and euploid mice were calculated and plotted against the average chromosomal position of the corresponding genes (NCBI mouse genome map, build 38.1). The mouse gene 1.0 ST array covers 100% of the MMU16 trisomic genes (77 genes) and MMU12 monosomic genes (seven genes) present in the Ts1Cje mice, with multiple probes per gene, thus increasing the confidence of our analysis.
Copy number and gene expression quantitative PCR analyses
Reverse transcription was performed using the Retroscript kit with 1 μg of total RNA according to the manufacturer's instructions (Life Technologies, Grand Island, NY, USA). For quantitative PCR experiments, 100 ng of cDNA was added to the PCR mixture (TaqMan gene expression 2X and TaqMan gene expression assay 20X) for a final volume of 20 μL in 96‐well plate according to TaqMan protocol (Life Technologies). PCR amplification was conducted on an AB7900HT Fast RT‐PCR system (Life Technologies). The TaqMan gene expression assays used are listed in Supporting Information Appendix S1. Amplification plots and predicted threshold cycle (Ct) values were obtained with the Sequence Detection Software (SDS 2.2, Applied Biosystems, Grand Island, NY, USA). Expression data were normalized against β‐actin as a reference gene and analyzed using the ΔΔCt relative quantification method described previously 62. Mean expression ratios from Ts1Cje (n = 6) and WT (n = 6) mice were compared. For quantitative PCR experiments, tissues from three mice represented in the array experiments were analyzed along with three new mice for each tissue. Itgb8 and Macc1 copy numbers were analyzed using purified genomic DNA according to the same protocol cited above.
Sod1 enzyme activity
For Sod1 enzyme activity experiments, 8‐week‐old Ts1Cje females (n = 6) and their WT littermates (n = 6) were euthanized by cervical dislocation followed by decapitation. The brains were rapidly removed and the cerebral cortices were dissected on a cold platform and immediately homogenized in the Sod1 lysis buffer (20 mM HEPES pH = 7.2 containing 1 mM EGTA, 210 mM mannitol and 70 mM sucrose). Protein concentration was measured using a BCA protein assay kit (Thermo Scientific, Rockford, IL, USA). One microgram of total protein was used for the assay, according to the manufacturer's instructions (Cayman Chemical, Ann Arbor, MI, USA). Sod1 activity (expressed in U/mL) was calculated using a Sod1 standard curve (concentration ranges from 0 U/mL to 0.25 U/mL).
Statistical analysis
For quantitative PCR comparisons between Ts1Cje and WT mice, the Mann–Whitney non‐parametric test was performed. Graphs were plotted as mean ± standard deviation (SD). All statistical analyses were performed using the StatView 5.5 software package (SAS Institute Inc, Cary, NC, USA).
Molecular mapping
To precisely characterize the translocation breakpoints in Ts1Cje using the mouse 1.0 ST array, we calculated gene expression ratios between Ts1Cje and euploid mice for all genes and mapped these to their chromosomal positions on the mouse genome (NCBI mouse genome map, build 38.1). The data have been uploaded to the Gene Expression Omnibus (GEO) site where they are publically available (GEO accession: GSE49635)
Results
Ts1Cje hippocampus has more differentially expressed genes than cortex
We first examined the number of differentially regulated genes using the BH correction at an FDR <5% to control for false‐positive results. This high stringency cut‐off identified 14 dysregulated genes in the hippocampus (12 upregulated, two down‐regulated) and five differentially regulated genes in the cortex (all upregulated). This number of genes was too small for subsequent functional analysis (data not shown).
To discover more genes that were physiologically relevant to the DS brain phenotype and could be used for pathway analyses, we therefore chose a BH‐FDR <20% cut‐off (Table 1). At this level of stringency, seven genes were significantly differentially expressed in Ts1Cje cortex. One of these genes, Tmem196, located on the MMU12 translocated region, was downregulated, however, Dnahc11, which also maps to this region, was highly overexpressed. Four genes (Rcan1, Synj1, Dyrk1a and Gart) that map to the MMU16 duplicated region, as well as Cyb5r1 (located on MMU1) were significantly upregulated. In the hippocampus, 30 genes were differentially expressed (Table 1). Most of these mapped to the aneuploid MMU16 and MMU12 regions. All upregulated genes were located on MMU16, except Dnahc11 on MMU12, Vmn2r110 on MMU17 and Fsbp on MMU4. Downregulated genes included Tmem196 and Itgb8 on MMU12, Snd1 on MMU6, Dcaf7 on MMU11 and Zhx2 on MMU15. Using quantitative RT‐PCR analysis, we confirmed gene expression changes of several genes, including Dyrk1a and Dscr3 (three copies); Itgb8 (one copy); Cyb5r1, Zhx2 and Dcaf7 (two copies) (Supporting Information Table S1).
Table 1.
Differentially expressed genes in the cerebral cortex and hippocampus of Ts1Cje mice at Benjamini‐Hochberg false discovery rate <20%. Abbreviations: *C = cortex; H = hippocampus; WT = wild‐type
| Symbol | Gene name | Ratio cortex DS/WT | Ratio hippocampus DS/WT | Chr | Significant in* | Gene copies |
|---|---|---|---|---|---|---|
| Dnahc11 | Dynein, axonemal, heavy chain 11 | 7.34 | 8.70 | 12 | C,H | Rearranged |
| Sod1 | Superoxide dismutase 1, soluble | 1.54 | 1.67 | 16 | H | 3/1 non‐functional |
| Mrps6 | Mitochondrial ribosomal protein S6 | 1.47 | 1.20 | 16 | H | 3 |
| Ets2 | E26 avian leukemia oncogene 2, 3′ domain | 1.47 | 1.35 | 16 | H | 3 |
| Wrb | Tryptophan rich basic protein | 1.43 | 1.36 | 16 | H | 3 |
| Ifngr2 | Interferon gamma receptor 2 | 1.42 | 1.28 | 16 | H | 3 |
| Dscam | Down syndrome cell adhesion molecule | 1.40 | 1.39 | 16 | H | 3 |
| Ifnar1 | Interferon (alpha and beta) receptor 1 | 1.40 | 1.38 | 16 | H | 3 |
| Cryzl1 | Crystallin, zeta (quinone reductase)‐like 1 | 1.39 | 1.38 | 16 | H | 3 |
| Dscr3 | Down syndrome critical region gene 3 | 1.38 | 1.39 | 16 | H | 3 |
| Brwd1 | Bromodomain and WD repeat domain containing 1 | 1.36 | 1.33 | 16 | H | 3 |
| Son | Son DNA binding protein | 1.36 | 1.36 | 16 | H | 3 |
| Rcan1 | Regulator of calcineurin 1 | 1.36 | 1.31 | 16 | C,H | 3 |
| Synj1 | Synaptojanin 1 | 1.35 | 1.33 | 16 | C,H | 3 |
| 1110004E09Rik | RIKEN cDNA 1110004E09 gene | 1.33 | 1.28 | 16 | H | 3 |
| Dopey2 | Dopey family member 2 | 1.32 | 1.31 | 16 | H | 3 |
| Itsn1 | Intersectin 1 (SH3 domain protein 1A) | 1.31 | 1.33 | 16 | H | 3 |
| Gart | Phosphoribosylglycinamide formyltransferase | 1.30 | 1.23 | 16 | C,H | 3 |
| Urb1 | URB1 ribosome biogenesis 1 homolog (S. cerevisiae) | 1.29 | 1.29 | 16 | H | 3 |
| Hunk | Hormonally upregulated Neu‐associated kinase | 1.29 | 1.31 | 16 | H | 3 |
| Dyrk1a | Dual‐specificity tyrosine‐(Y)‐phosphorylation regulated kinase 1a | 1.19 | 1.27 | 16 | C,H | 3 |
| Scaf4 | SR‐related CTD‐associated factor 4 | 1.19 | 1.28 | 16 | H | 3 |
| Pcp4 | Purkinje cell protein 4 | 1.10 | 1.21 | 16 | H | 3 |
| Cyb5r1 | Cytochrome b5 reductase 1 | 1.19 | 1.16 | 1 | C | 2 |
| Snd1 | Staphylococcal nuclease and tudor domain containing 1 | 1.05 | 0.93 | 6 | H | 2 |
| Vmn2r110 | Vomeronasal 2, receptor 110 | 0.95 | 1.43 | 17 | H | 2 |
| Dcaf7 | DDB1 and CUL4 associated factor 7 | 0.95 | 0.89 | 11 | H | 2 |
| Zhx2 | Zinc fingers and homeoboxes 2 | 0.93 | 0.86 | 15 | H | 2 |
| Fsbp | Fibrinogen silencer binding protein | 0.90 | 1.50 | 4 | H | 2 |
| Tmem196 | Transmembrane protein 196 | 0.63 | 0.75 | 12 | C,H | 1 |
| Itgb8 | Integrin beta 8 | 0.57 | 0.57 | 12 | H | 1 |
Thirty‐one genes are significantly differentially expressed by ANOVA (BH‐FDR < 20%) (seven in cortex, 30 in hippocampus, six in both). Among these genes, 22 are present in three copies. Data are represented with the fold change in Ts1Cje compared with WT littermate controls.
The transcriptome profiles in the cerebral cortex and hippocampus were highly correlated. This was independent of the genotype (mainly because of the subtle effect of the MMU16 trisomy). Interestingly, the direction of regulation of differentially regulated genes (up or down) was also consistent in both tissues, even when one was statistically significant and the other was not (Figure 1 and Supporting Information Figure S1).
Figure 1.
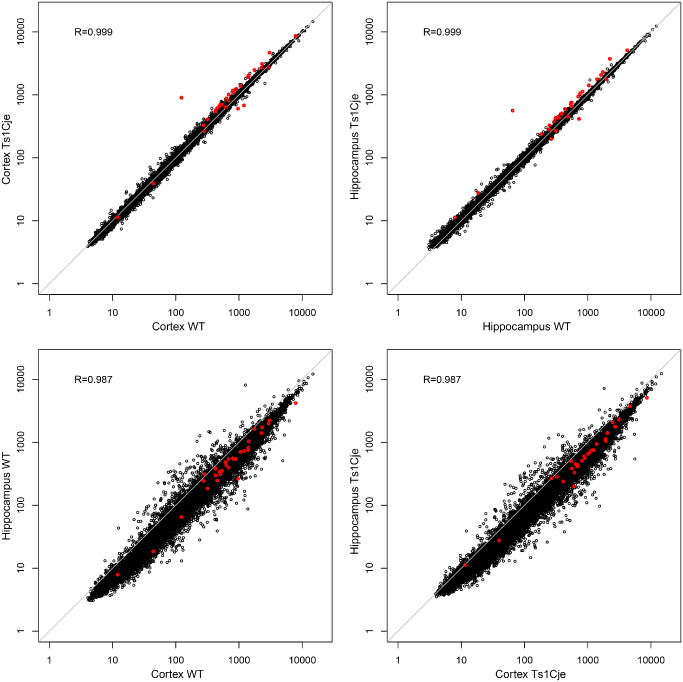
Gene expression correlation between the cerebral cortex and hippocampus. Correlation analyses were performed to compare expression profiles between the two genotypes (WT vs. Ts1Cje) for the same brain region, or between the two brain regions (cortex vs. hippocampus) for the same genotype. Expression profiles are highly correlated for the whole genome (black dots) and the differentially regulated genes (red dots).
In silico functional pathway analyses
Functional analysis was performed on the top 1% regulated genes representing a total number of 424 genes (212 downregulated and 212 upregulated genes), including 38 and 28 trisomic genes in the cerebral cortex and hippocampus, respectively. Supporting Information Table S2 lists the top 1% dysregulated genes in the cortex and hippocampus.
Functional analysis using GSEA
GSEA analysis indicated that orthologs to human chromosome 21 genes were highly enriched in our dataset (Table 2). These genes map to the MMU16 duplicated region, including those found on human 21q22. Several pathways were affected in both the cerebral cortex and hippocampus, including interferon signaling (P = 0.00 for the cortex, P = 0.04 for the hippocampus), apoptosis (P = 0.012 for the cortex, P = 0.04 for the hippocampus), NFAT signaling (P = 0.02 for the cortex, P = 0.02 for the hippocampus) and glutathione transferase activity (P = 0.03 for the cortex, P = 0.046 for the hippocampus). Moreover, amine derived hormone metabolism (P cortex = 0.03; P hippocampus = 0.04) as well as the integrin complex (P cortex = 0.01; P hippocampus = 0.01) were significantly altered in Ts1Cje brains. Supporting Information Table S3 summarizes the complete list of the different cellular processes that were significantly altered in Ts1Cje as well as the upregulation or downregulation of the genes implicated in these processes.
Table 2.
Gene Set Enrichment Analysis (GSEA) results of the Ts1Cje brain gene expression data
| GSEA gene set | Gene set collection | Number of genes | NES cortex | NES hippocampus | P value cortex | P value hippocampus | Examples of regulated genes |
|---|---|---|---|---|---|---|---|
| CHR21Q22 | c1 | 130 | 2.69 | 2.36 | 0 | 0 | Atp5o, Synj1, Ifnar2, Dscr3, Morc3, Rcan1, Dyrk1a |
| Reactome interferon signaling | c2.cp | 120 | 2.40 | 1.36 | 0 | 0.04 | Ifnar1, Ifnar2, Ifit1, Ifit3, Irf7, Irf9, Egr1, Stat1 |
| Apoptotic changes and cell‐component disassembly | c5 | 17 | 1.51 | 1.51 | 0.012 | 0.04 | Tpd52L1, Nrg1, Hrsp12 |
| Pid_Nfat_3 Pathway | c2.cp | 53 | 1.63 | 1.60 | 0.018 | 0.017 | Rcan1, Sfn (14.3.3 σ), MAPK3, NR4A1, PrkCd, PrkCh, Ywhaz |
| Glutathione transferase activity | c5 | 15 | 1.60 | 1.52 | 0.031 | 0.046 | Gsta2, Gsta3, Gstm4, Mgst1 |
| Pid‐Reg‐GR‐pathway | c2.cp | 75 | 1.60 | 1.45 | 0.002 | 0.02 | Fkbp5, Nr4a1, Il5, Il6, Egr1, Sfn, Fos, Csf2, Stat1, Bglap |
| Secondary metabolic process | c5 | 26 | −1.49 | −1.43 | 0.037 | 0.045 | Alad, Ppox, Gpr143, Dct, Oca2 |
| Reactive amine derived hormones | c2.cp | 15 | −1.60 | −1.55 | 0.032 | 0.043 | Dio3, Pnmt, Th |
| Integrin complex | c5 | 19 | −1.72 | −1.70 | 0.012 | 0.014 | Itgb8, Itgad |
NES, normalized enrichment score as reported by GSEA. The most significantly enriched sets are indicated.
Functional analysis using DAVID
DAVID analysis enabled us to identify overrepresented GO categories or KEGG pathways in the top 1% dysregulated genes (Table 3). We found a statistically significant enrichment of our dataset with GO categories related to learning and behavior, including cognition and neurological system processing. Furthermore, GO categories titled “Response to organic substances” and “Interferon receptor activity” were significantly modified in both tissues. Oxidoreductase activity (including genes generating and/or protecting against oxidative stress) is another cellular process significantly increased in the Ts1Cje brains. We also showed that G protein‐coupled receptor (GPCR) signaling pathway and the somatosensory network, with categories such as sensory perception, particularly the perception of smell, were abnormally expressed in Ts1Cje. Finally, the cell surface receptor signal transduction pathway that is closely linked to these two groups is significantly modified in both the cortices and the hippocampi of Ts1Cje mice.
Table 3.
Functional analysis using DAVID on the top 1% differentially expressed genes for cerebral cortex and hippocampus in Ts1Cje mice
| Term | Category | Count in cortex | Count in hippocampus |
|---|---|---|---|
| Upregulated terms | |||
| GO:0010033∼Response to organic substance | GOTERM_BP_FAT | 11 | 11 |
| GO:0004904∼Interferon receptor activity | GOTERM_MF_FAT | 2 | 2 |
| GO:0019961∼Interferon binding | GOTERM_MF_FAT | 2 | 2 |
| mmu04630:Jak‐STAT signaling pathway | KEGG_PATHWAY | 8 | 6 |
| mmu04650:Natural killer cell mediated cytotoxicity | KEGG_PATHWAY | 6 | 6 |
| PIRSF018583:Interleukin‐10 receptor beta chain | PIR_SUPERFAMILY | 2 | 2 |
| Ribosome | SP_PIR_KEYWORDS | 3 | 3 |
| Downregulated terms | |||
| GO:0006412∼Translation | GOTERM_BP_FAT | 8 | 9 |
| GO:0007166∼Cell surface receptor linked signal transduction | GOTERM_BP_FAT | 43 | 34 |
| GO:0007186∼G‐protein coupled receptor protein signaling pathway | GOTERM_BP_FAT | 40 | 27 |
| GO:0007600∼Sensory perception | GOTERM_BP_FAT | 32 | 23 |
| GO:0007606∼Sensory perception of chemical stimulus | GOTERM_BP_FAT | 30 | 21 |
| GO:0007608∼Sensory perception of smell | GOTERM_BP_FAT | 30 | 21 |
| GO:0050877∼Neurological system process | GOTERM_BP_FAT | 34 | 25 |
| GO:0050890∼Cognition | GOTERM_BP_FAT | 32 | 23 |
| GO:0005840∼Ribosome | GOTERM_CC_FAT | 7 | 9 |
| GO:0003735∼Structural constituent of ribosome | GOTERM_MF_FAT | 7 | 8 |
| GO:0004984∼Olfactory receptor activity | GOTERM_MF_FAT | 30 | 21 |
| GO:0005198∼Structural molecule activity | GOTERM_MF_FAT | 10 | 11 |
| mmu03010:Ribosome | KEGG_PATHWAY | 5 | 6 |
| G‐protein coupled receptor | SP_PIR_KEYWORDS | 30 | 20 |
| Receptor | SP_PIR_KEYWORDS | 46 | 28 |
| Ribonucleoprotein | SP_PIR_KEYWORDS | 6 | 8 |
| Ribosomal protein | SP_PIR_KEYWORDS | 7 | 9 |
| Transducer | SP_PIR_KEYWORDS | 30 | 20 |
| Transmembrane | SP_PIR_KEYWORDS | 54 | 54 |
| Disulfide bond | UP_SEQ_FEATURE | 20 | 24 |
Only terms with a P‐value < 0.05 in both tissues are shown. Counts indicate the number of genes for a functional term in the top 1% regulated genes.
MMU16 and MMU12 chromosomal plots
The mouse gene 1.0 ST array used in this study contains MMU16 trisomic genes (77 genes) and MMU12 monosomic genes (seven genes) present in the Ts1Cje mice. This helped us to visualize the expression profile of all the aneuploid and euploid genes and investigate their impact on the whole genome in both the cortex and hippocampus. Additionally, the presence of multiple probes per gene allowed us to precisely map the translocation breakpoints in Sod1 and Dnahc11.
Few MMU16 trisomic genes are overexpressed in a gene‐dosage manner
The chromosomal plots for mouse MMU16 showed clear overexpression of genes duplicated in the Ts1Cje mice, with an average ratio of 1.20 in both brain regions. Close examination of individual genes revealed that these ratios varied between 0.88 (Itgb2l) and 1.54 (Sod1) in the cortex, and between 0.96 (Sim2) and 1.67 (Sod1) in the hippocampus (Figure 2, Supporting Information Table S4). Of the 77 genes present in three copies in the Ts1Cje mice, 22 genes (28.57%) were differentially regulated in either the cortex or hippocampus, while the expression of the remaining 46 genes (71.43%) was not affected.
Figure 2.
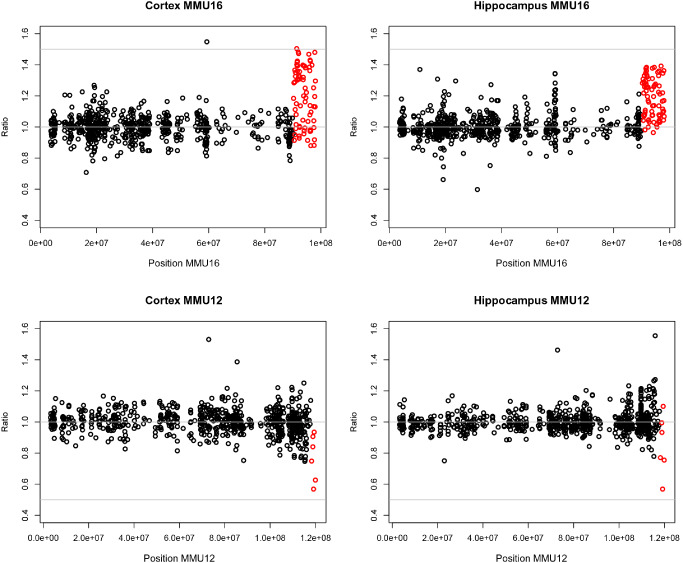
Chromosome plot of MMU16 and MMU12 gene expression in Ts1Cje cortex and hippocampus. Aneuploid genes are indicated in red. Results from the cerebral cortex and the hippocampus are represented on the left and the right, respectively. Sod1 and Dnahc11 were excluded because their expression levels did not follow the gene‐dosage effect as a result of the translocation (abnormal loci). MMU16 and MMU12 genes positions were mapped on the mouse genome (using NCBI mouse genome map, build 38.1).
Despite truncation of the third Sod1 copy reported in the literature, Sod1 transcript was overexpressed at a gene dosage‐dependent manner in both tissues examined. Close analysis of Affymetrix probes mapped to different exons highlighted an overexpression of probes from exons 1 and 5 (no probe from exon 2 is present on the mouse gene 1.0 ST array). No significant change was observed in probes from exons 3 and 4 in the Ts1Cje vs. WT (Supporting Information Figure S2A, Supporting Information Table S5). This expression profile was confirmed by quantitative PCR analysis using TaqMan probes from exon junctions 1/2 and 3/4 respectively (Supporting Information Figure S2B). To confirm that Sod1 overexpression was not associated with increased protein expression, we examined Sod1 enzymatic activity and found no increase in the cortex and hippocampus of Ts1Cje mice compared with their littermate controls (Supporting Information Figure S2C).
Genes on the MMU12 subtelomeric monosomic region show diverse effects
Among the seven genes from MMU12 that are monosomic in Ts1Cje mice, only two (Itgb8 and Tmem196) were downregulated, with ratios ranging from 0.57 to 0.77. Expression of the other genes (Sp4, Sp8, Abcb5 and Macc1) was not significantly altered at a BH‐FDR of 20%. Dnahc11 was highly overexpressed with ratios of 7.34 and 8.69 in the cortex and hippocampus, respectively. Another transcript (RIKEN cDNA 4930447C04), located on the non‐translocated MMU12 region, was also 1.53 and 1.46‐fold higher in Ts1Cje compared with euploid mice (Figure 2, Supporting Information Table S4).
In Ts1Cje mice, the MMU12 translocation breakpoint was previously located between exons 35 and 41 of the Dnahc11 gene. To confirm Dnahc11 overexpression despite its truncation, we performed quantitative RT‐PCR experiments using two different TaqMan probes located on exons 15–16 (probe Dnahc_Ex15) and exons 65–66 (probe Dnahc_Ex65) (Figure 3A). Analysis using the ΔΔCt showed that Dnahc_Ex65 (proximal to the translocation breakpoint) was highly overexpressed in Ts1Cje brains with an average normalized ratio of 177.10 compared with the WT mice. On the contrary, probe Dnahc_Ex15 (distal to the translocation breakpoint) had similar levels of expression between Ts1Cje and WT mice (Figure 3C). Affymetrix individual probe analyses helped us to accurately locate the translocation breakpoint between exons 36 and 37, and revealed that probes proximal to the translocation breakpoint are highly overexpressed in Ts1Cje brains, whereas those that map to the distal part are expressed at similar levels compared with the WT mice (Figure 3B, Supporting Information Table S5). We further analyzed gene copy number and expression level of Itgb8 and Macc1, two genes that mapped to the MMU12 monosomic region. Ts1Cje mice carry only one copy of each gene with a ratio of 0.5 compared with euploids (Supporting Information Figure S3). However, only Itgb8 transcript was detected and significantly downregulated in the cortex of Ts1Cje mice (data not shown).
Figure 3.
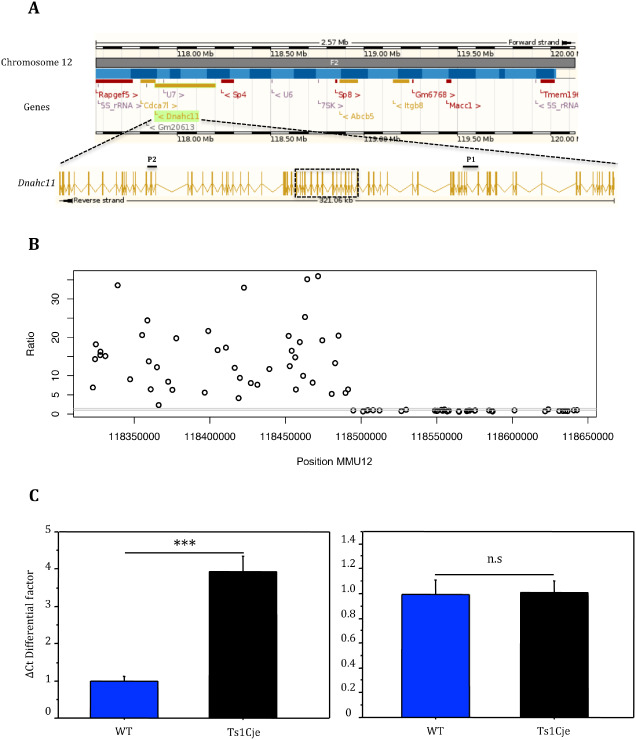
Quantitative PCR analysis of Dnahc11 expression levels in the Ts1Cje cerebral cortex. A. Schematic showing chromosome 12 monosomic region and the Dnahc11 gene organization (Ensembl M us musculus, version 71.38). Note that Dnahc11 is transcribed in the reverse direction and the translocation breakpoint region reported by Duchon et al 11 is indicated by a dotted rectangle. Six genes (Sp4, Sp8, Abcb5, Itgb8, Macc1 and Tmem196) located distally to Dnahc11 are thought to be monosomic in Ts1Cje mice. B. Schematic showing the individual Dnahc11 gene Affymetrix probes and their expression level in Ts1Cje mice vs. WT. Only the probes that are proximal to the translocation breakpoint are overexpressed in Ts1Cje brains. C. Dnahc11 expression level in the cerebral cortex was analyzed by quantitative RT‐PCR using two sets of TaqMan probes: D nahc‐ E x65 or P2 (proximal to translocation breakpoint) on the left and D nahc‐ E x15 or P1 (distal to translocation breakpoint) on the right. Because of the extremely high overexpression of Dnahc11 (mean ratio Ts1Cje/WT = 177.10), data were transformed and comparisons were made between ΔCt differential factors (ΔCt Ts1Cje/ΔCt WT) and (ΔCt WT/ΔCt WT) that are positively correlated to the expression ratios in the Ts1Cje (n = 6) and WT (n = 6) mice, respectively. Statistics: *P < 0.05, **P < 0.01, ***P < 0.001, n.s = not significant.
Discussion
In the present study, we compared gene expression changes in the cortex and hippocampus of Ts1Cje vs. WT mice to identify the molecular modifications linked to the abnormal brain and behavioral phenotypes of these mice. The goal of this study was to identify signaling pathways that are consistently altered in both brain regions and could be targeted for future therapeutic interventions.
Primary and secondary genome‐wide effects in the Ts1Cje brain
We used the BH‐FDR correction for multiple testing to control for the number of false‐positive results. Compared with other methods that correct at the individual gene level (such as the Bonferroni correction), the BH‐FDR is more powerful for true‐positive results while still being robust against false‐positives 4.
We found a small number of genes (seven genes in the cortex and 30 genes in the hippocampus) that were significantly altered at a 20% BH‐FDR cut‐off value. Most upregulated genes mapped to the trisomic MMU16 region and the downregulated ones to the monosomic MMU12 region. The relatively small number of significant hits at BH‐FDR <20% can be explained by the subtle primary effects of some of the triplicated MMU16 genes that trigger smaller secondary effects on non‐MMU16 genes.
These subtle effects were also reported in microarray studies of fetal cerebrum, cerebellum, astrocytes and heart isolated from humans with DS that identified a total of 40 significantly differentially regulated genes, including 26 from HSA21 and 14 from chromosomes other than HSA21 32.
Our analyses helped us to narrow down the number of genes on MMU16 that represent potential candidates for the brain phenotype in DS, and identify novel non‐MMU16 genes that were significantly differentially regulated in Ts1Cje adult brains. Six non‐translocated genes (Cyb5r1, Dcaf7, Fsbp, Snd1, Vmn2r110 and Zhx2) located on MMU1, 11, 4, 6, 17 and 15, respectively, were differentially regulated in the Ts1Cje brains. Increased expression of Cyb5r1 is associated with higher oxidative stress during the early stage of cerebellar granule neuronal apoptosis 50. Dcaf7 (also known as Han11 or Wdr68) interacts with several kinases in vitro, including Dyrk1a, Dyrk1b, Hipk2 and Mekk1. This gene plays an important role in craniofacial development and regulates hedgehog signaling by repressing Gli1‐dependent transcription 36, 47, 60. Fsbp protein binds to amyloid beta A4 precursor protein‐binding family A member 1 to inhibit Gsk3ß promoter transcription. It is thought to play a protective role against Alzheimer's disease by inhibiting App/Fe65 signaling 30. Snd1 plays an important role in inflammation by activating interleukin 4‐dependent gene transcription through the interaction with Stat6 and Cbp 57. A recent gene linkage analysis identified Snd1, together with Reln, Grik2 and Mkl2 as candidate genes for autism spectrum disorders 19. Zhx2 is highly expressed in neural progenitor cells during cortical neurogenesis. It plays an important role in their maintenance by binding ephrin‐B1. Blocking Zhx2 function causes neuronal differentiation in vitro and in vivo 64.
Taken together, data from the literature indicate that these genes are all key players that regulate cellular processes and signaling pathways that are crucial for brain development and function. Significant perturbation of their expression leads to pathophysiological changes such as reduced neurogenesis, increased oxidative stress and apoptosis, and Alzheimer's‐like disease, all of which has been described in the brains of people with DS 9, 17. A previous meta‐analysis of data obtained from 45 human and mouse DS studies identified 324 significantly perturbed genes in DS 59. Among these, 77 genes mapped to HSA21, but did not include genes that we identified here, such as Pcp4, Itsn1, Hunk, Dscam and Dopey2. These genes have all been linked to brain developmental defects in mouse models and were significantly upregulated in our dataset.
In silico functional pathway analyses in the Ts1Cje brain
We identified several cellular functions and signaling pathways relevant to the DS phenotype that are dysregulated in the Ts1Cje brains. Genes involved in neurological system processes and behavior, NFAT signaling, oxidative stress, immune response, G‐protein coupled protein signaling and olfactory perception were overrepresented in our dataset. These cellular processes and pathways act together to induce abnormalities affecting synaptic plasticity, learning and memory in Ts1Cje mice. They represent potential targets for future effective therapies in DS.
NFAT signaling is expressed early during embryonic development and throughout postnatal life predominantly in the heart and central nervous system. NFAT dephosphorylation by calcineurin, through increased calcium influx, induces its nuclear export to promote target gene expression 39. Overexpression of Rcan1 (a known inhibitor of calcineurin) and Dyrk1a (which phosphorylates NFAT) inhibit NFAT signaling, and induce both brain, craniofacial and heart defects in mice 3. Targeted disruptions of calcineurin, NFAT, Rcan1 or Dyrk1a are embryonically lethal, and homozygous embryos show defects in axonal growth, suggesting a crucial role of this pathway in proper brain development.
In addition to NFAT signaling dysregulation, Ts1Cje mice show a high degree of oxidative stress in both the cortex and the hippocampus. Oxidative stress is one of the major functional abnormalities present in the brains of both adults with DS and mouse models 23, 46, 52. This excessive oxidative stress is already present in the brain, heart and amniotic fluid during fetal life and may play an important role in the neurodevelopmental and neurodegenerative anomalies in people with DS 32, 54.
The olfactory system plays an important role in the responses to external stimuli, and social, sexual and nurturing behaviors in rodents. Olfactory receptors are a multigene family of G‐protein coupled receptors that are expressed in the olfactory bulb and the vomeronasal organ. They are also present in different brain regions, including the enthorinhal and periforme cortices, the hippocampus, the amygdala and the hypothalamus 34, 65. Ts1Cje mouse brain shows alterations in G‐protein signaling and olfactory functions. Several olfactory‐related genes, including Vmn2r110, were found in the top 1% regulated gene list (eg, Olfr59 and Olf318 in both tissues; Olfr43, Olfr101 and Olfr1445 in the cortex; Olfr68, Olfr332 and Olfr767 in the hippocampus). Most of these genes have human orthologs, suggesting that olfactory system processing and the expression of these transcripts might be affected in individuals with DS. We were unable to find specific reports of abnormal gene expression of olfactory receptors in post‐mortem DS brains.
More molecular studies are needed to understand the implication of olfactory system processing in intellectual disabilities associated with DS. However, several groups have analyzed olfactory‐associated learning and explicit memory in children, adolescents and adults with DS using different paradigms. Significant deficits in both odor learning and memory were observed in all age groups, with a particularly important delay in adults 6, 26, 35, 40. Similarly, Ts65Dn mice exhibit a significant contextual olfactory learning deficit and marked neurogenesis reduction in the olfactory bulb 5, 10. Hummel et al 21 also identified Dscam, a gene present in three copies in the Ts1Cje mice, as a major player in the targeting of olfactory receptor neurons in drosophila.
MMU16 and MMU12 aneuploid genes
Here, we established a comprehensive expression catalogue for the Ts1Cje duplicated and monosomic genes, all of which were interrogated by the mouse gene 1.0 ST array with multiple probes for each gene. We found that the expression of most triplicated genes (n = 55) was unchanged in both brain tissues in Ts1Cje vs. WT. Only 22 genes were differentially expressed in either the cortex or hippocampus.
Using two publically available mouse gene expression atlases (Allen brain atlas and the mouse embryo atlas projects), a PubMed search and the Ts65Dn gene expression data from nine different adult tissues (cortex, midbrain, cerebellum, heart, lung, liver, kidneys, skeletal muscles and testis) 27, we observed that the MMU16 genes that did not follow the gene‐dosage effect fall into four categories:
-
(i)
Genes that are ubiquitously expressed in the brain and compensated in the cortex or hippocampus (eg, Ripply3, Sh3bgr), suggesting the activation of compensatory mechanisms in these regions.
-
(ii)
Genes that display a region‐specific expression pattern in other parts of the brain (eg, Kcne2 in the cerebellum, Olig1 and Olig2 in the thalamus and brainstem).
-
(iii)
Genes that are expressed in other organs outside the brain (eg, Clic6 in the thyroid, Kcne1 in the heart and kidneys).
-
(iv)
Genes that demonstrate time‐specific expression during earlier stages of development or later in life [eg, Pigp and Setd4 are overexpressed in Ts1Cje embryonic brain (unpublished data)].
Prior to this study, Ts1Cje mice have been described as monosomic for seven annotated genes from MMU12, with a translocation breakpoint located between exons 35 and 41 of Dnahc11 11. Here, we showed that only two of these genes (Itgb8 and Tmem196) were significantly downregulated in the Ts1Cje brain; expression of Abcb5, Macc1, Sp4 and Sp8 were unchanged. In contrast, Dnahc11 was highly overexpressed. Downregulation of Sp4 and overexpression of Dnahc11 have been previously described in the developing cerebellum of Ts1Cje mice, however, no molecular explanation was previously provided for this unexpected upregulation of Dnahc11 in spite of its truncation 29. Sp4 has also been shown to be decreased in Ts1Cje fetal liver and placenta 42.
This is the first report to provide detailed information regarding differential expression of the seven translocated MMU12 genes in the monosomic region, along with their contribution to the Ts1Cje brain phenotype. In contrast to the prior literature, Sp4 did not show statistically significant differential expression in Ts1Cje cortex and hippocampus. Our results broaden our insights into the characteristics of this mouse model and the relationship between its genotype and its tissue‐dependent gene expression.
Additionally, we conducted single Affymetrix probe analyses and quantitative RT‐PCR amplification experiments to refine the translocation breakpoints. We showed that only Dnahc11 transcript isoforms containing exons proximal to the breakpoint were highly overexpressed in Ts1Cje brains. The expression of transcripts with exons distal to the breakpoint was similar to the WT mice. It is unlikely that the overexpression of the truncated Dnahc11 sequence translates into a functional protein. Gene copy number analyses of Itgb8 and Macc1 confirmed the monosomy of the MMU12 subtelomeric region distal to Dnahc11 in the Ts1Cje mice.
Our study also demonstrated that not all the genes present in three copies are overexpressed in a gene‐dosage fashion. Comparable gene expression variations have been previously observed in the brains of mouse models and human post‐mortem samples, as well as amniotic fluid samples, suggesting that most triplicated genes are compensated 29, 33, 54. Moreover, as the degree of overexpression varies between tissues, and even different brain parts, tissue‐specific factors likely play a role in the degree in which the genotype manifests itself in gene expression changes and, ultimately, the phenotype. The existence of such tissue‐specific factors might help in optimizing treatment targeted to the right tissue as well as the right pathway.
Our approach provides detailed information about the genotype–phenotype relationships in Ts1Cje mice, and it can be used to further characterize other mouse models of DS, including the Ts65Dn mice. This strain carries, in addition to a trisomy of a subset of MMU16, a duplication of 50 extra‐protein coding genes mapped to MMU17 that are not orthologous to the human HSA21. No information is available on how the overexpression of these genes could influence the brain and behavioral phenotype of these mice 11, 45.
Summary
In this study, we describe the gene expression changes in the adult cortex and hippocampus of the Ts1Cje mouse model of DS. These two tissues have not been previously characterized at the molecular level. We provide novel information on the translocated regions of MMU16 and MMU12 that span the breakpoints. We also identify the primary (trisomy) and secondary (genome‐wide) effects in the Ts1Cje mice, and show unique expression patterns in the cerebral cortex and hippocampus. Our data demonstrate the importance of using a systems biology approach to identify molecular alterations and pathways that are consistently disrupted in mouse models of human diseases including DS. In silico functional analyses highlighted consistently dysregulated cellular processes and signaling pathways, including NFAT signaling, oxidative stress, neuroinflammation and G‐protein signaling (eg, olfactory perception), which have also been described in human post‐mortem brains. These specific signaling pathways represent potential new targets for effective therapies to improve cognition in DS.
Author Contributions
Drs. Guedj and Bianchi had full access to all of the data in the study and take responsibility for the integrity of the data and the accuracy of the data analysis. Guedj and Bianchi were in charge of the study concept and design. Guedj acquired the data. Guedj, Pennings, Wick and Bianchi analyzed and interpreted the data. Guedj, Pennings and Bianchi drafted the manuscript. Bianchi, Guedj and Pennings critically revised the manuscript for important intellectual content. Wick and Pennings were in charge of the statistical analysis. Guedj, Pennings, Wick and Bianchi approved the final version of the manuscript to be published. Bianchi obtained the funding and supervised the study.
Supporting information
Figure S1. Heatmap for the cerebral cortex and the hippocampus. Differentially expressed genes at BH‐FDR <20% are indicated on the right side of the graph. Expression regulation of regulated genes is generally similar in the cortex and hippocampus of Ts1Cje mice. Abbreviations: Ctx = Cerebral cortex; Hpc = Hippocampus.
Figure S2. Sod1 gene expression level and enzymatic activity in the cerebral cortex of Ts1Cje mice. A. Schematic showing the individual Sod1 gene Affymetrix probes and their expression levels in Ts1Cje vs. WT mice. Probes located on exons 1 and 5 are overexpressed; however, expression of probes from exons 3 and 4 (neomycin cassette insertion locus) is unchanged compared with WT mice. B. Sod1 expression levels in the cerebral cortex of Ts1Cje (n = 6) and WT (n = 6) mice were analyzed by quantitative RT‐PCR using two sets of probes mapping to exon junctions 1/2 (left panel) and 3/4 (right panel). Note that only the probe mapping to exon 1/2 junction was significantly overexpressed. C. Sod1 enzymatic activity was measured using a tetrazolium salt for detection of superoxide radicals generated by xanthine oxidase and hypoxanthine as described in the schematic (left panel). No change in Sod1 enzymatic activity was observed in Ts1Cje cortex (n = 6) vs. WT (n = 6) (right panel). Statistics: *P < 0.05, **P < 0.01, ***P < 0.001, n.s = not significant.
Figure S3. Gene copy number of Itgb8 and Macc1 from MMU12. Itgb8 (left panel) and Macc1 (right panel) copy number analyses using quantitative PCR on genomic DNA shows that both genes are monosomic in Ts1Cje mice (n = 6, ratio = 0.5) vs. WT mice (n = 6, ratio = 1.0).
Table S1. Q‐RT‐PCR confirmation of gene expression for Dyrk1a, Dscr3, Itgb8, Cyb5r1, Zhx2 and Dcaf7 genes.
Table S2. List of the top 1% regulated genes (upregulated and downregulated) in the Ts1Cje cerebral cortex and hippocampus.
Table S3. Functional analysis using the Gene Set Enrichment Analysis in the Ts1Cje cerebral cortex and hippocampus.
Table S4. Gene expression ratios of MMU16 triplicated and MMU12 translocated genes in Ts1Cje mice.
Table S5. Detailed Affymetrix probe sets precisely map the neomycin cassette position and the breakpoint loci for Sod1 and Dnahc11, respectively.
Appendix S1. List of TaqMan gene expression assays used for quantitative PCR analyses.
Acknowledgments
The authors wish to thank Dr. Donna K Slonim for her comments on the manuscript and Dr. Roger H Reeves for kindly providing the Ts1Cje colony founders.
Gene Expression Omnibus Dataset: Data have been uploaded to the GEO site and made publically available (GEO accession: GSE49635).
Funding: This work was supported by a sponsored research grant from Verinata Health, Inc., an Illumina company. The funders had no role in study design, data collection and analysis, decision to publish or preparation of the manuscript.
Competing interests: The authors declare that no competing interests exist.
References
- 1. Abraham H, Vincze A, Veszpremi B, Kravjak A, Gomori E, Kovacs GG, Seress L (2012) Impaired myelination of the human hippocampal formation in Down syndrome. Int J Dev Neurosci 30:147–158. [DOI] [PubMed] [Google Scholar]
- 2. Amano K, Sago H, Uchikawa C, Suzuki T, Kotliarova SE, Nukina N et al (2004) Dosage‐dependent over‐expression of genes in the trisomic region of Ts1Cje mouse model for Down syndrome. Hum Mol Genet 13:1333–1340. [DOI] [PubMed] [Google Scholar]
- 3. Arron JR, Winslow MM, Polleri A, Chang CP, Wu H, Gao X et al (2006) NFAT dysregulation by increased dosage of DSCR1 and DYRK1A on chromosome 21. Nature 441:595–600. [DOI] [PubMed] [Google Scholar]
- 4. Benjamini Y, Hochberg Y (1995) Controlling the false discovery rate: a practical and powerful approach to multiple testing. J R Stat Soc B 57:289–300. [Google Scholar]
- 5. Bianchi P, Bettini S, Guidi S, Ciani E, Trazzi S, Stagni F et al (2014) Age‐related impairment of olfactory bulb neurogenesis in the Ts65Dn mouse model of Down syndrome. Exp Neurol 251:1–11. [DOI] [PubMed] [Google Scholar]
- 6. Chen MA, Lander TR, Murphy C (2006) Nasal health in Down syndrome: a cross‐sectional study. Otolaryngol Head Neck Surg 134:741–745. [DOI] [PubMed] [Google Scholar]
- 7. Dai M, Wang P, Boyd AD, Kostov G, Athey B, Jones EG et al (2005) Evolving gene/transcript definitions significantly alter the interpretation of GeneChip data. Nucleic Acids Res 33:e175. [DOI] [PMC free article] [PubMed] [Google Scholar]
- 8. Davisson MT, Schmidt C, Akeson EC (1990) Segmental trisomy of murine chromosome 16: a new model system for studying Down syndrome. Prog Clin Biol Res 360:263–280. [PubMed] [Google Scholar]
- 9. Delabar JM, Aflalo‐Rattenbac R, Creau N (2006) Developmental defects in trisomy 21 and mouse models. ScientificWorldJournal 6:1945–1964. [DOI] [PMC free article] [PubMed] [Google Scholar]
- 10. De Souza FM, Busquet N, Blatner M, Maclean KN, Restrepo D (2011) Galantamine improves olfactory learning in the Ts65Dn mouse model of Down syndrome. Sci Rep 1:137–142. [DOI] [PMC free article] [PubMed] [Google Scholar]
- 11. Duchon A, Raveau M, Chevalier C, Nalesso V, Sharp AJ, Herault Y (2011) Identification of the translocation breakpoints in the Ts65Dn and Ts1Cje mouse lines: relevance for modeling Down syndrome. Mamm Genome 22:674–684. [DOI] [PMC free article] [PubMed] [Google Scholar]
- 12. Eijssen LM, Jaillard M, Adriaens ME, Gaj S, de Groot PJ, Muller M, Evelo CT (2013) User‐friendly solutions for microarray quality control and pre‐processing on ArrayAnalysis.org. Nucleic Acids Res 41:W71–W76. [DOI] [PMC free article] [PubMed] [Google Scholar]
- 13. Esposito G, Imitola J, Lu J, De Filippis D, Scuderi C, Ganesh VS et al (2008) Genomic and functional profiling of human Down syndrome neural progenitors implicates S100B and aquaporin 4 in cell injury. Hum Mol Genet 17:440–457. [DOI] [PubMed] [Google Scholar]
- 14. Guedj F, Pereira PL, Najas S, Barallobre MJ, Chabert C, Souchet B et al (2012) DYRK1A: a master regulatory protein controlling brain growth. Neurobiol Dis 46:190–203. [DOI] [PubMed] [Google Scholar]
- 15. Guidi S, Bonasoni P, Ceccarelli C, Santini D, Gualtieri F, Ciani E, Bartesaghi R (2008) Neurogenesis impairment and increased cell death reduce total neuron number in the hippocampal region of fetuses with Down syndrome. Brain Pathol 18:180–197. [DOI] [PMC free article] [PubMed] [Google Scholar]
- 16. Guihard‐Costa AM, Khung S, Delbecque K, Menez F, Delezoide AL (2006) Biometry of face and brain in fetuses with trisomy 21. Pediatr Res 59:33–38. [DOI] [PubMed] [Google Scholar]
- 17. Haydar TF, Reeves RH (2012) Trisomy 21 and early brain development. Trends Neurosci 35:81–91. [DOI] [PMC free article] [PubMed] [Google Scholar]
- 18. Hewitt CA, Ling KH, Merson TD, Simpson KM, Ritchie ME, King SL et al (2010) Gene network disruptions and neurogenesis defects in the adult Ts1Cje mouse model of Down syndrome. PLoS ONE 5:e11561. [DOI] [PMC free article] [PubMed] [Google Scholar]
- 19. Holt R, Barnby G, Maestrini E, Bacchelli E, Brocklebank D, Sousa I et al (2010) Linkage and candidate gene studies of autism spectrum disorders in European populations. Eur J Hum Genet 18:1013–1019. [DOI] [PMC free article] [PubMed] [Google Scholar]
- 20. Huang da W, Sherman BT, Lempicki RA (2009) Systematic and integrative analysis of large gene lists using DAVID bioinformatics resources. Nat Protoc 4:44–57. [DOI] [PubMed] [Google Scholar]
- 21. Hummel T, Vasconcelos ML, Clemens JC, Fishilevich Y, Vosshall LB, Zipursky SL (2003) Axonal targeting of olfactory receptor neurons in Drosophila is controlled by Dscam. Neuron 37:221–231. [DOI] [PubMed] [Google Scholar]
- 22. Irizarry RA, Bolstad BM, Collin F, Cope LM, Hobbs B, Speed TP (2003) Summaries of Affymetrix GeneChip probe level data. Nucleic Acids Res 31:e15. [DOI] [PMC free article] [PubMed] [Google Scholar]
- 23. Ishihara K, Amano K, Takaki E, Ebrahim AS, Shimohata A, Shibazaki N et al (2009) Increased lipid peroxidation in Down's syndrome mouse models. J Neurochem 110:1965–1976. [DOI] [PubMed] [Google Scholar]
- 24. Ishihara K, Amano K, Takaki E, Shimohata A, Sago H, Epstein CJ, Yamakawa K (2010) Enlarged brain ventricles and impaired neurogenesis in the Ts1Cje and Ts2Cje mouse models of Down syndrome. Cereb Cortex 20:1131–1143. [DOI] [PubMed] [Google Scholar]
- 25. Jackson JF, North ER, Thomas JG (1976) Clinical diagnosis of Down's syndrome. Clin Genet 9:483–487. [DOI] [PubMed] [Google Scholar]
- 26. Johns A, Homewood J, Stevenson R, Taylor A (2012) Implicit and explicit olfactory memory in people with and without Down syndrome. Res Dev Disabil 33:583–593. [DOI] [PubMed] [Google Scholar]
- 27. Kahlem P, Sultan M, Herwig R, Steinfath M, Balzereit D, Eppens B et al (2004) Transcript level alterations reflect gene dosage effects across multiple tissues in a mouse model of down syndrome. Genome Res 14:1258–1267. [DOI] [PMC free article] [PubMed] [Google Scholar]
- 28. Koo BK, Blaser S, Harwood‐Nash D, Becker LE, Murphy EG (1992) Magnetic resonance imaging evaluation of delayed myelination in Down syndrome: a case report and review of the literature. J Child Neurol 7:417–421. [DOI] [PubMed] [Google Scholar]
- 29. Laffaire J, Rivals I, Dauphinot L, Pasteau F, Wehrle R, Larrat B et al (2009) Gene expression signature of cerebellar hypoplasia in a mouse model of Down syndrome during postnatal development. BMC Genomics 10:138. [DOI] [PMC free article] [PubMed] [Google Scholar]
- 30. Lau KF, Perkinton MS, Rodriguez L, McLoughlin DM, Miller CC (2010) An X11alpha/FSBP complex represses transcription of the GSK3beta gene promoter. Neuroreport 21:761–766. [DOI] [PMC free article] [PubMed] [Google Scholar]
- 31. Lockstone HE, Harris LW, Swatton JE, Wayland MT, Holland AJ, Bahn S (2007) Gene expression profiling in the adult Down syndrome brain. Genomics 90:647–660. [DOI] [PubMed] [Google Scholar]
- 32. Mao R, Wang X, Spitznagel EL Jr, Frelin LP, Ting JC, Ding H et al (2005) Primary and secondary transcriptional effects in the developing human Down syndrome brain and heart. Genome Biol 6:R107. [DOI] [PMC free article] [PubMed] [Google Scholar]
- 33. Mao R, Zielke CL, Zielke HR, Pevsner J (2003) Global up‐regulation of chromosome 21 gene expression in the developing Down syndrome brain. Genomics 81:457–467. [DOI] [PubMed] [Google Scholar]
- 34. Martinez‐Marcos A (2009) On the organization of olfactory and vomeronasal cortices. Prog Neurobiol 87:21–30. [DOI] [PubMed] [Google Scholar]
- 35. McKeown DA, Doty RL, Perl DP, Frye RE, Simms I, Mester A (1996) Olfactory function in young adolescents with Down's syndrome. J Neurol Neurosurg Psychiatry 61:412–414. [DOI] [PMC free article] [PubMed] [Google Scholar]
- 36. Miyata Y, Nishida E (2011) DYRK1A binds to an evolutionarily conserved WD40‐repeat protein WDR68 and induces its nuclear translocation. Biochim Biophys Acta 1813:1728–1739. [DOI] [PubMed] [Google Scholar]
- 37. Moldrich RX, Dauphinot L, Laffaire J, Vitalis T, Herault Y, Beart PM et al (2009) Proliferation deficits and gene expression dysregulation in Down's syndrome (Ts1Cje) neural progenitor cells cultured from neurospheres. J Neurosci Res 87:3143–3152. [DOI] [PubMed] [Google Scholar]
- 38. Nadel L (2003) Down's syndrome: a genetic disorder in biobehavioral perspective. Genes Brain Behav 2:156–166. [DOI] [PubMed] [Google Scholar]
- 39. Nguyen T, Di Giovanni S (2008) NFAT signaling in neural development and axon growth. Int J Dev Neurosci 26:141–145. [DOI] [PMC free article] [PubMed] [Google Scholar]
- 40. Nijjar RK, Murphy C (2002) Olfactory impairment increases as a function of age in persons with Down syndrome. Neurobiol Aging 23:65–73. [DOI] [PubMed] [Google Scholar]
- 41. Olson LE, Roper RJ, Baxter LL, Carlson EJ, Epstein CJ, Reeves RH (2004) Down syndrome mouse models Ts65Dn, Ts1Cje, and Ms1Cje/Ts65Dn exhibit variable severity of cerebellar phenotypes. Dev Dyn 230:581–589. [DOI] [PubMed] [Google Scholar]
- 42. Pennings JL, Rodenburg W, Imholz S, Koster MP, van Oostrom CT, Breit TM et al (2011) Gene expression profiling in a mouse model identifies fetal liver‐ and placenta‐derived potential biomarkers for Down syndrome screening. PLoS ONE 6:e18866. [DOI] [PMC free article] [PubMed] [Google Scholar]
- 43. Pinter JD, Eliez S, Schmitt JE, Capone GT, Reiss AL (2001) Neuroanatomy of Down's syndrome: a high‐resolution MRI study. Am J Psychiatry 158:1659–1665. [DOI] [PubMed] [Google Scholar]
- 44. Potier MC, Rivals I, Mercier G, Ettwiller L, Moldrich RX, Laffaire J et al (2006) Transcriptional disruptions in Down syndrome: a case study in the Ts1Cje mouse cerebellum during post‐natal development. J Neurochem 97(Suppl. 1):104–109. [DOI] [PubMed] [Google Scholar]
- 45. Reinholdt LG, Ding Y, Gilbert GJ, Czechanski A, Solzak JP, Roper RJ et al (2011) Molecular characterization of the translocation breakpoints in the Down syndrome mouse model Ts65Dn. Mamm Genome 22:685–691. [DOI] [PMC free article] [PubMed] [Google Scholar]
- 46. Reynolds GP, Cutts AJ (1993) Free radical damage in Down's syndrome brain. Biochem Soc Trans 21:221S. [DOI] [PubMed] [Google Scholar]
- 47. Ritterhoff S, Farah CM, Grabitzki J, Lochnit G, Skurat AV, Schmitz ML (2010) The WD40‐repeat protein Han11 functions as a scaffold protein to control HIPK2 and MEKK1 kinase functions. EMBO J 29:3750–3761. [DOI] [PMC free article] [PubMed] [Google Scholar]
- 48. Sago H, Carlson EJ, Smith DJ, Kilbridge J, Rubin EM, Mobley WC et al (1998) Ts1Cje, a partial trisomy 16 mouse model for Down syndrome, exhibits learning and behavioral abnormalities. Proc Natl Acad Sci U S A 95:6256–6261. [DOI] [PMC free article] [PubMed] [Google Scholar]
- 49. Sago H, Carlson EJ, Smith DJ, Rubin EM, Crnic LS, Huang TT, Epstein CJ (2000) Genetic dissection of region associated with behavioral abnormalities in mouse models for Down syndrome. Pediatr Res 48:606–613. [DOI] [PubMed] [Google Scholar]
- 50. Samhan‐Arias AK, Marques‐da‐Silva D, Yanamala N, Gutierrez‐Merino C (2012) Stimulation and clustering of cytochrome b5 reductase in caveolin‐rich lipid microdomains is an early event in oxidative stress‐mediated apoptosis of cerebellar granule neurons. J Proteomics 75:2934–2949. [DOI] [PubMed] [Google Scholar]
- 51. Schmidt‐Sidor B, Wisniewski KE, Shepard TH, Sersen EA (1990) Brain growth in Down syndrome subjects 15 to 22 weeks of gestational age and birth to 60 months. Clin Neuropathol 9:181–190. [PubMed] [Google Scholar]
- 52. Shichiri M, Yoshida Y, Ishida N, Hagihara Y, Iwahashi H, Tamai H, Niki E (2011) alpha‐Tocopherol suppresses lipid peroxidation and behavioral and cognitive impairments in the Ts65Dn mouse model of Down syndrome. Free Radic Biol Med 50:1801–1811. [DOI] [PubMed] [Google Scholar]
- 53. Siarey RJ, Villar AJ, Epstein CJ, Galdzicki Z (2005) Abnormal synaptic plasticity in the Ts1Cje segmental trisomy 16 mouse model of Down syndrome. Neuropharmacology 49:122–128. [DOI] [PubMed] [Google Scholar]
- 54. Slonim DK, Koide K, Johnson KL, Tantravahi U, Cowan JM, Jarrah Z, Bianchi DW (2009) Functional genomic analysis of amniotic fluid cell‐free mRNA suggests that oxidative stress is significant in Down syndrome fetuses. Proc Natl Acad Sci U S A 106:9425–9429. [DOI] [PMC free article] [PubMed] [Google Scholar]
- 55. Subramanian A, Tamayo P, Mootha VK, Mukherjee S, Ebert BL, Gillette MA et al (2005) Gene set enrichment analysis: a knowledge‐based approach for interpreting genome‐wide expression profiles. Proc Natl Acad Sci U S A 102:15545–15550. [DOI] [PMC free article] [PubMed] [Google Scholar]
- 56. Teipel SJ, Alexander GE, Schapiro MB, Moller HJ, Rapoport SI, Hampel H (2004) Age‐related cortical grey matter reductions in non‐demented Down's syndrome adults determined by MRI with voxel‐based morphometry. Brain 127:811–824. [DOI] [PubMed] [Google Scholar]
- 57. Valineva T, Yang J, Palovuori R, Silvennoinen O (2005) The transcriptional co‐activator protein p100 recruits histone acetyltransferase activity to STAT6 and mediates interaction between the CREB‐binding protein and STAT6. J Biol Chem 280:14989–14996. [DOI] [PubMed] [Google Scholar]
- 58. Vicari S, Bellucci S, Carlesimo GA (2000) Implicit and explicit memory: a functional dissociation in persons with Down syndrome. Neuropsychologia 38:240–251. [DOI] [PubMed] [Google Scholar]
- 59. Vilardell M, Rasche A, Thormann A, Maschke‐Dutz E, Perez‐Jurado LA, Lehrach H, Herwig R (2011) Meta‐analysis of heterogeneous Down syndrome data reveals consistent genome‐wide dosage effects related to neurological processes. BMC Genomics 12:229. [DOI] [PMC free article] [PubMed] [Google Scholar]
- 60. Wang B, Doan D, Roman Petersen Y, Alvarado E, Alvarado G, Bhandari A et al (2013) Wdr68 requires nuclear access for craniofacial development. PLoS ONE 8:e54363. [DOI] [PMC free article] [PubMed] [Google Scholar]
- 61. White NS, Alkire MT, Haier RJ (2003) A voxel‐based morphometric study of nondemented adults with Down syndrome. Neuroimage 20:393–403. [DOI] [PubMed] [Google Scholar]
- 62. Winer J, Jung CK, Shackel I, Williams PM (1999) Development and validation of real‐time quantitative reverse transcriptase‐polymerase chain reaction for monitoring gene expression in cardiac myocytes in vitro. Anal Biochem 270:41–49. [DOI] [PubMed] [Google Scholar]
- 63. Wishart JG (1993) The development of learning difficulties in children with Down's syndrome. J Intellect Disabil Res 37(Pt 4):389–403. [DOI] [PubMed] [Google Scholar]
- 64. Wu C, Qiu R, Wang J, Zhang H, Murai K, Lu Q (2009) ZHX2 interacts with Ephrin‐B and regulates neural progenitor maintenance in the developing cerebral cortex. J Neurosci 29:7404–7412. [DOI] [PMC free article] [PubMed] [Google Scholar]
- 65. Zelano C, Sobel N (2005) Humans as an animal model for systems‐level organization of olfaction. Neuron 48:431–454. [DOI] [PubMed] [Google Scholar]
Associated Data
This section collects any data citations, data availability statements, or supplementary materials included in this article.
Supplementary Materials
Figure S1. Heatmap for the cerebral cortex and the hippocampus. Differentially expressed genes at BH‐FDR <20% are indicated on the right side of the graph. Expression regulation of regulated genes is generally similar in the cortex and hippocampus of Ts1Cje mice. Abbreviations: Ctx = Cerebral cortex; Hpc = Hippocampus.
Figure S2. Sod1 gene expression level and enzymatic activity in the cerebral cortex of Ts1Cje mice. A. Schematic showing the individual Sod1 gene Affymetrix probes and their expression levels in Ts1Cje vs. WT mice. Probes located on exons 1 and 5 are overexpressed; however, expression of probes from exons 3 and 4 (neomycin cassette insertion locus) is unchanged compared with WT mice. B. Sod1 expression levels in the cerebral cortex of Ts1Cje (n = 6) and WT (n = 6) mice were analyzed by quantitative RT‐PCR using two sets of probes mapping to exon junctions 1/2 (left panel) and 3/4 (right panel). Note that only the probe mapping to exon 1/2 junction was significantly overexpressed. C. Sod1 enzymatic activity was measured using a tetrazolium salt for detection of superoxide radicals generated by xanthine oxidase and hypoxanthine as described in the schematic (left panel). No change in Sod1 enzymatic activity was observed in Ts1Cje cortex (n = 6) vs. WT (n = 6) (right panel). Statistics: *P < 0.05, **P < 0.01, ***P < 0.001, n.s = not significant.
Figure S3. Gene copy number of Itgb8 and Macc1 from MMU12. Itgb8 (left panel) and Macc1 (right panel) copy number analyses using quantitative PCR on genomic DNA shows that both genes are monosomic in Ts1Cje mice (n = 6, ratio = 0.5) vs. WT mice (n = 6, ratio = 1.0).
Table S1. Q‐RT‐PCR confirmation of gene expression for Dyrk1a, Dscr3, Itgb8, Cyb5r1, Zhx2 and Dcaf7 genes.
Table S2. List of the top 1% regulated genes (upregulated and downregulated) in the Ts1Cje cerebral cortex and hippocampus.
Table S3. Functional analysis using the Gene Set Enrichment Analysis in the Ts1Cje cerebral cortex and hippocampus.
Table S4. Gene expression ratios of MMU16 triplicated and MMU12 translocated genes in Ts1Cje mice.
Table S5. Detailed Affymetrix probe sets precisely map the neomycin cassette position and the breakpoint loci for Sod1 and Dnahc11, respectively.
Appendix S1. List of TaqMan gene expression assays used for quantitative PCR analyses.