

Abstract
Several lines of evidence suggest that cell injury may occur in malformations of cortical development associated with epilepsy. Moreover, recent studies support the link between neurodevelopmental and neurodegenerative mechanisms. We evaluated a series of focal cortical dysplasia (FCD, n = 26; type I and II) and tuberous sclerosis complex (TSC, n = 6) cases. Sections were processed for terminal deoxynucleotidyl transferase‐mediated 2′‐deoxyuridine 5′‐triphosphate nick‐end labeling (TUNEL) labeling and immunohistochemistry using markers for the evaluation of apoptosis signaling pathways and neurodegeneration‐related proteins/pathways. In both FCD II and TSC specimens, we observed significant increases in both TUNEL‐positive and caspase–3‐positive cells compared with controls and FCD I. Expression of β‐amyloid precursor protein was observed in neuronal soma and processes in FCD II and TSC. In these specimens, we also observed an abnormal expression of death receptor‐6. Immunoreactivity for phosphorylated tau was only found in older patients with FCD II and TSC. In these cases, prominent nuclear/cytoplasmic p62 immunoreactivity was detected in both dysmorphic neurons and balloon/giant cells. Our data provide evidence of complex, but similar, mechanisms of cell injury in focal malformations of cortical development associated with mammalian target of rapamycin pathway hyperactivation, with prominent induction of apoptosis‐signaling pathways and premature activation of mechanisms of neurodegeneration.
Keywords: apoptosis, cortical tubers, epilepsy, focal cortical dysplasia, mTOR, neurodegeneration
Introduction
Multiple lines of evidence support a link between neurodevelopmental and neurodegenerative mechanisms 5, 15. Several genes and proteins associated with neurodegenerative disorders participate in fundamental neurodevelopmental processes, including the cascade of events, which underlies the development of the cerebral cortex 5, 15. In addition, major pathways essential for normal cortical development [such as cyclin‐dependent kinase 5 (CDK5) and the mammalian target of rapamycin (mTOR) signaling pathways] have been implicated in the mechanisms underlying cellular ageing and neurodegeneration 31, 42, 48. In particular, attention has recently been focused on the role of mTOR signaling in neurodegeneration and an overactivation of this pathway, through inhibition of autophagy and induction of protein synthesis, has been suggested to critically contribute to an accumulation of cell damage, promoting the development of aging‐related diseases 35. Interestingly, both CDK5 and the mTOR signaling pathways are known to be activated in focal malformations of cortical development (MCD), such as focal cortical dysplasia (FCD) and cortical tubers in the tuberous sclerosis complex [TSC; 28, 45, 55; for a review, see 9, 20]. Moreover, several studies suggest that cell injury, including apoptosis, may occur in MCD associated with epilepsy 12, 19, 27, 39. In particular, evidence of pathologically phosphorylated tau has been reported in older FCD patients 53. Whether neurodegenerative changes represent an intrinsic feature of a specific type of MCD, or are triggered by chronic seizure activity is still unclear.
The aim of the present study was to determine whether developmentally abnormal cortex of patients with FCD and TSC could be more susceptible to cellular injury through activation of apoptosis‐signaling pathways and/or premature activation of neurodegenerative mechanisms involved in major neurodegenerative diseases. We therefore evaluated not only apoptosis and cell injury, but also the expression and cellular distribution of major pathways and proteins associated with neurodegenerative diseases, in brain tissue from patients with FCD types I and II, as well as in cortical tubers from patients with chronic medically intractable epilepsy. Our data indicate that ongoing cell injury and vulnerability to neuronal degeneration represents an important feature of FCD type II and TSC and may contribute to progressive cognitive dysfunction in patients with these developmental lesions.
Materials and Methods
Subjects
The cases included in this study were obtained from the archives of the departments of neuropathology of the Academic Medical Center (University of Amsterdam), the University Medical Center in Utrecht (UMCU) and the VU University Medical Center (VUMC) in Amsterdam. A total of 36 brain tissue specimens, removed from patients undergoing surgery for intractable epilepsy, were examined. Informed consent was obtained for the use of brain tissue and for access to medical records for research purposes. All cases were reviewed independently by two neuropathologists and the diagnosis was confirmed according to International League Against Epilepsy classification system 8. Table 1 summarizes the clinical findings of epilepsy patients and controls. All TSC patients fulfilled the diagnostic criteria for TSC 24. All patients underwent presurgical evaluation with Phase I investigations consisting of noninvasive tests, including history, medical, neurological and neuropsychological assessment, structural neuroimaging and extensive interictal and ictal electroencephalography studies with video monitoring. In Phase II, an intracarotid sodium amytal test (Wada test), interictal positron emission tomography, (inter)ictal single‐photon emission computed tomography and functional magnetic resonance imaging were performed on indication 62. Patients who underwent implantation of strip and/or grid electrodes for chronic subdural invasive monitoring before resection were excluded from this study. Patients had complex partial seizures and all patients had daily seizures, which were resistant to maximal doses of antiepileptic drugs. Seizure duration represents the interval in years between age at seizure onset and age at surgery. Normal‐appearing control cortex was obtained at autopsy from six age‐matched patients without history of seizures or other neurological diseases. Autopsied brain tissues from patients with neurodegenerative disorders (Alzheimer's and amyotrophic lateral sclerosis) and trauma were also examined (as positive controls for immunocytochemical analysis). All autopsies were performed within 12 h after death. Histologically normal temporal neocortex (without evidence of significant neuronal loss, gliosis or malformation; epilepsy controls) from four patients undergoing extensive surgical resection of the mesial structures for the treatment of medically intractable complex partial epilepsy was also used for immunocytochemical analysis. This material represents good control tissue, because it is exposed to similar seizure activity, duration of epilepsy and fixation protocol, and is also useful in order to investigate whether seizure activity itself triggers the neurodegeneration.
Table 1.
Summary of clinical findings of epilepsy patients and controls
| Pathology type | Number of cases | Gender (M/F) | Mean age at surgery (years/range) | Localization | Mean duration of epilepsy (years/range) | Seizure frequency (months) |
|---|---|---|---|---|---|---|
| FCD Ib | 6 | 3/3 | 33.3 (24–49) |
3 temporal 3 frontal |
12.5 (6–13) | 12.5 (2–35) |
| FCD IIa | 5 | 3/2 | 26.75 (18–24) |
2 temporal 3 frontal |
11 (5–23) | 10.5 (6–14) |
| FCD IIb | 15 | 7/8 | 31.2 (23–50) |
8 temporal 7 frontal |
9.2 (3–16) | 12.1 (3–30) |
| Cortical Tubers (TSC) | 6 | 3/3 | 30.3 (18−35) |
3 temporal 2 frontal 1 parietal |
15 (3–34) | 11.3 (3–30) |
| Epilepsy control (no MCD) | 4 | 2/2 | 37.7 (25–50) | Temporal | 12.5 (7–18) | 5.5 (2–10) |
| Controls (no epilepsy) | 6 | 3/3 | 35.3 (24–51) |
3 temporal 3 frontal |
‐ | ‐ |
F = female; FCD = focal cortical dysplasia; M = male; MCD = malformations of cortical development; TSC = tuberous sclerosis complex.
Tissue preparation
Formalin fixed, paraffin‐embedded tissue (one representative paraffin block per case containing the complete lesion or the largest part of the lesion resected at surgery) was sectioned at 6 μm and mounted on pre‐coated glass slides (Star Frost, Waldemar Knittel GmbH, Barunschweig, Germany). Sections of all specimens were processed for haematoxylin eosin, luxol fast blue and Nissl stains as well as for immunocytochemical stainings for a number of neuronal and glial markers (Table 2).
Table 2.
Immunocytochemistry: primary antibodies.
| Antigen | Primary antibody | Source | Dilution |
|---|---|---|---|
| Glial fibrillary acidic protein (GFAP) | Polyclonal rabbit | DAKO, Glostrup, Denmark | 1:4000 |
| Neuronal nuclear protein (NeuN) | Mouse clone MAB377 | Chemicon, Temecula, CA, USA | 1:2000 |
| Human leukocyte antigen (HLA)‐DP, ‐DQ, ‐DR (HLA‐II) | Mouse clone CR3/43 | DAKO, Glostrup, Denmark | 1:100 |
| Olig‐2 | Rabbit polyclonal | Immuno‐Biological Laboratories | 1:200 |
| Caspase‐3 | Rabbit polyclonal | Signaling Technology, Danvers, MA, USA | 1:100 |
| Caspase‐6 | Rabbit polyclonal | Abcam, Cambridge, MA, USA | 1:500 |
| Phosphorylated tau | Mouse clone AT8 | Innogenetics, Alpharetta, GA, USA | 1:5000 |
| p62 | Monoclonal mouse | BD transduction Laboratories, San Jose, CA USA | 1:100 |
| Ubiquitine | Polyclonal rabbit | DAKO, Glostrup, Denmark | 1:500 |
| TDP‐43 (transactive DNA‐binding protein) | Mouse clone 2E2‐D3 | Abnova, Pittsburgh, PA 15205. USA | 1:5000 |
| pTDP‐43 | Mouse clone 11.9 ps409/410 | Cosmo Bio, Carlsbad, CA, USA | 1:5000 |
| Death receptor 6 (DR6) | Polyclonal rabbit | Santa Cruz Biotechnology., Santa Cruz, CA, USA | 1:1000 |
| Amyloid precursor protein (APP) | Mouse clone 22C11 | Chemicon, Temecula, CA, USA | 1:50 000 |
| Phospho‐S6 ribosomal protein (pS6) | Polyclonal rabbit (Ser235/236; pS6) | Cell Signaling Technology, Beverly, MA, USA; | 1:50 |
| Amyloïd‐β | Mouse clone 6F/3D | DAKO, Glostrup, Denmark | 1:200 |
Immunocytochemistry
Immunohistochemistry (see Table 2) was carried out as previously described 2. Single‐label immunocytochemistry was performed using the Powervision kit (Immunologic, Duiven, the Netherlands) and 3,3‐diaminobenzidine as chromogen. Sections were counterstained with haematoxylin. A similar pattern of immunoreactivity (IR) was observed in surgical and autopsy control specimens included in this study.
For double labeling, sections were incubated with Brightvision poly‐alkaline phosphatase (AP)‐anti‐Rabbit (Immunologic) for 30 minutes at room temperature, and washed with phosphate buffered saline. Sections were washed with Tris‐HCl buffer (0.1 M, pH 8.2) to adjust the pH. AP activity was visualized with the alkaline phosphatase substrate kit I Vector Red (SK‐5100, Vector laboratories Inc., Burlingame, CA, USA). To remove the first primary antibody sections were incubated at 121°C in citrate buffer (10 mM NaCi, pH 6.0) for 10 min. Incubation with the second primary antibody was performed overnight at 4°C. Sections with primary antibody other than rabbit were incubated with post antibody blocking from the Brightvision+ system [containing rabbit‐α‐mouse immunoglobulin G (IgG), Immunologic]. AP activity was visualized with the AP substrate kit III Vector Blue (SK‐5300, Vector Laboratories Inc.). Sections incubated without the primary Abs or with the primary antibodies, followed by heating treatment were essentially blank.
For the double‐label immunofluorescent staining of caspase‐3 with glial fibrillary acidic protein (GFAP) or neuronal nuclear protein (NeuN), sections were, after incubation with the primary antibodies overnight at 4°C, incubated for 2 h at room temperature with Alexa Fluor® 568‐conjugated anti‐rabbit and Alexa Fluor® 488 anti‐mouse IgG or anti‐goat IgG (1:100, Molecular Probes, Leiden, the Netherlands). Sections were mounted with Vectashield containing 4′,6‐diamidino‐2‐phenylindole (targeting DNA in the cell nucleus; blue emission) and analyzed by means of a laser scanning confocal microscope (Leica TCS Sp2, Wetzlar, Germany).
TUNEL labeling
After deparaffinization and rehydration of the section, terminal deoxynucleotidyl‐transferase‐mediated 2′‐deoxyuridine 5′‐triphosphate nick end‐labeling (TUNEL) assay was performed with a TdT‐FragEL DNA fragmentation detection kit (DeadEnd Colorimetric TUNEL system, #G7130, Promega, Madison, WI, USA) according to the manufacturer's protocol. TUNEL staining was visualized with 3,3′‐diaminobenzidine.
Evaluation of IR
We performed optical density (OD) measurements in lesional (FCD and TSC) and control cortex [as previously described 60] for TUNEL and caspase‐3. Sections were digitized using an Olympus microscope equipped with a DP‐10 digital camera (Olympus, Tokyo, Japan). An identical region of interest in the region of dysplasia or tuber and in the white matter beneath this region was outlined at low magnification (×2.5 objective). Images from consecutive, non‐overlapping, fields (mean area for quantitative analysis was 5.95 mm2) were collected using image acquisition and analysis software (Phase 3 Image System integrated with Image Pro Plus, Media Cybernetics, Silver Spring, MD, USA). The cortex and white matter were analyzed separately. The absolute pixel staining density and the background from fields lacking labeling was determined. A mean OD value for the dysplastic cortex/white matter was calculated, expressed as a ratio of the mean OD (ODR) of the background and comparison was made between patient subgroups. Two representative paraffin sections per case were stained and assessed with each Ab.
The intensity of TUNEL, caspase‐3 and caspase‐6 labeling was also evaluated using a scale of 0–3 (0: no; 1: weak; 2: moderate; 3: strong staining). All areas of the specimen were examined and the score represents the predominant cell staining intensity found in each case in glial and neuronal cells. The frequency of positive cells (1, rare; 2, sparse; 3, high) was also evaluated to give information about the relative number of positive cells within the dysplastic area. As proposed before 3, 39, the product of these two values (intensity and frequency scores) was taken to give the overall score (total labeling score).
TUNEL and caspase–3‐labeled sections (after light counterstaining with haematoxylin) were also analyzed to calculate the labeling index (LI) for neuronal cells and balloon/giant cells. An identical region of interest in the dysplastic region of FCD IIb and TSC specimens was outlined at low magnification (×2.5 objective; the mean area for quantitative analysis was 5.95 mm2). All balloon cells/giant cells and dysmorphic neurons within this region were counted systematically at high magnification (×40 objective). Neuronal cell bodies were differentiated from glia on the basis of morphology, and only neurons in which the nucleolus could be clearly identified were included. Balloon/giant cells have eccentric nuclei, ballooned cytoplasm and did not exhibit clear axonal or dendritic processes. The LI was defined as the ratio of immunolabeled cells related to the entire selected cell population as previously described 13, 40. The LI for TUNEL and caspase‐3 labeling was expressed as a percentage for all FCD and TSC specimens (Table 3).
Table 3.
TUNEL and caspase‐3 staining in BCs, GCs and DNs of FCD and TSC specimens.
| Staining | BCs | GCs | DNs | |
|---|---|---|---|---|
| FCD IIb | TSC | |||
| TUNEL | 77 ± 3.2 | 76 ± 5.2 | 62 ± 3.1 | 59 ± 2.1 |
| Caspase‐3 | 73 ± 4.6 | 81 ± 5.3 | 63 ± 2.1 | 61 ± 4.1 |
Percent of morphologically identified cell type (BCs, GCs or DNs) positive for TUNEL or Caspase‐3 staining across 6 FCD IIb and 6 TSC specimens.
BC = balloon cells; DN = dysmorphic neurons; FCD = focal cortical dysplasia; GC = giant cells; TSC = tuberous sclerosis complex; TUNEL = terminal deoxynucleotidyl transferase‐mediated 2′‐deoxyuridine 5′‐triphosphate nick‐end labeling.
To analyze the percentage of NeuN‐ [or GFAP and human leukocyte antigen DR‐1 (HLA‐DR)] positive cells that express caspase‐3, two representative, adjacent, non‐overlapping fields of the dysplastic cortex were captured (magnification 40×; total area of each field: 165.250 μm2) and digitized using a laser scanning confocal microscope. The total number of cells stained with caspase‐3 or NeuN (or GFAP and HLA‐DR) as well as the number of double‐labeled cells were counted and percentages were calculated [expressed as mean ± standard error of the mean (SEM)] of cells co‐expressing caspase‐3 and NeuN (or GFAP and HLA‐DR; as previously described 29).
To analyze the percentage of double‐labeled cells positive for caspase‐3 and olig‐2, digital images of eight representative fields per section (×20 objective) were collected (Leica DM5000B). Images were analyzed with the Nuance VIS‐FL Multi‐spectral Imaging System (Cambridge Research Instrumentation, Woburn, MA, USA) as previously described 11, 61. The total number of cells stained with caspase‐3 and olig‐2, as well as the number of cells double labeled with NeuN, were counted visually and percentages were calculated (expressed as mean ± SEM) of cells co‐expressing caspase‐3 and olig‐2.
Statistical analysis
Statistical analyses were performed with the Statistical Package for the Social Sciences (SPSS) for Windows (SPSS 11.5, SPSS Inc., Chicago, IL, USA) using two‐tailed Student's t‐test, and to assess differences between more than two groups, the nonparametric Kruskal–Wallis test followed by Mann–Whitney U‐test. We analyzed the possible correlation between TUNEL and caspase‐3 labeling and different clinical variables (age, gender, duration of epilepsy and seizure frequency) using the Spearman's rank correlation coefficient (ρ). P < 0.05 was considered significant.
Results
Case material and histological features
The clinical features of the cases included in this study are summarized in Table 1. All patients had a history of chronic pharmaco‐resistant epilepsy. The postoperative seizure outcome was classified according to Engel 23; postoperatively, 21 patients (78%) in this cohort were completely seizure free. Age at surgery, seizure duration and seizure frequency were not statistically different among patients with FCD I, FCD II and TSC in this cohort. In this study, we excluded patients with mild degree of cortical dysplasia (mild malformation of cortical development) 8, 46. As described previously 4, 28, 38, 52, both dysplastic neurons and balloon cells in FCD type II displayed enhanced S6 protein phosphorylation (not shown).
TUNEL labeling in FCD and tubers
TUNEL labeling was observed in specimens from patients with FCD (types I, IIa and IIb) and in cortical specimens (tubers) of TSC patients and was significantly higher compared with both control autopsy (no detectable labeling) and surgical (no‐MCD) specimens. Moreover, the labeling was more prominent in FCD type IIb and TSC compared with FCD I and FCD IIa (Figure 1; Figure 3A; Supporting Information Figure S1A). TUNEL‐positive cells were observed in both gray and white matter (Figure 1C–I); however, the labeling in white matter was higher compared with the grey matter in FCD IIb and TSC specimens (Figure 3A). On the basis of morphology, both neurons and glial cells displayed nuclear positivity and TUNEL‐positive balloon (FCD IIb) and giant cells (TSC) were also detected in white matter (Figure 1C–I; Supporting Information Figure S1A; Table 3). In FCD IIb and TSC specimens, we evaluated the possible correlation with clinical variables such as age at surgery, duration of epilepsy and seizure frequency. Interestingly, the TUNEL labeling in both neuronal and glial cells was positively correlated with all three variables in FCD IIb (age at surgery: neuron, r = 0.732; glia, r = 0.738; duration of epilepsy: neuron, r = 0.803, glia, r = 0.738; seizure frequency: neuron, r = 0.861; glia, r = 0.758, P < 0.05). In TSC, the TUNEL labeling in both neuronal and glial cells was positively correlated with duration of epilepsy (neuron, r = 0.853, glia, r = 0.783; P < 0.05) and only the glial labeling with seizure frequency (glia, r = 0.878; P < 0.05). TUNEL labeling in TSC was not correlated with the age at surgery.
Figure 1.
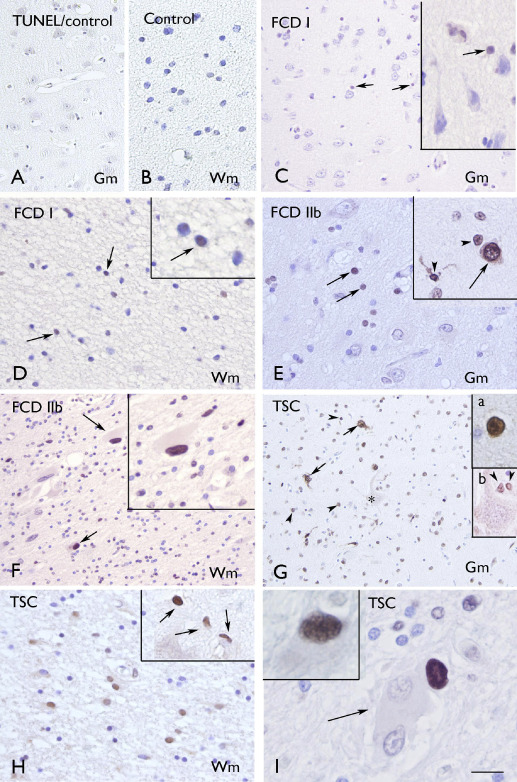
Terminal deoxynucleotidyl transferase‐mediated 2′‐deoxyuridine 5′‐triphosphate nick‐end labeling (TUNEL. A–B. Control gray matter (Gm; A) and white matter (Wm; B) showing absence of glial or neuronal labeling. C–D: focal cortical dysplasia (FCD) I with few positive cells in Gm (C) and Wm (D; arrows and inserts in C and D). E–F. FCD IIb with several positive cells in Gm (E; arrows) and Wm (F; arrows indicate positive balloon cells; high magnification in insert). Insert in E shows positivity in neuronal (arrow) and glial cells (arrow‐heads). G–I. tuberous sclerosis complex (TSC) showing several positive cells in Gm [G; neuronal cells, arrows and insert (a); glial cells, arrow‐heads and insert (b)] and Wm (H; high magnification in insert). Panel I shows Wm with negative (arrow) and positive (insert) giant cells. Scale bar in I: B, D–E, H: 40 μm; A, C, F–G: 80 μm; I: 20 μm.
Figure 3.
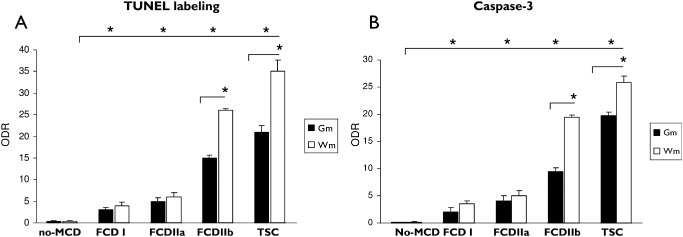
Evaluation of terminal deoxynucleotidyl transferase‐mediated 2′‐deoxyuridine 5′‐triphosphate nick‐end labeling (TUNEL) and caspase‐3 immunoreactivity. (A): Graph showing relative optical density ratio (ODR) for TUNEL in epilepsy control (no malformation of cortical development, (MCD), focal cortical dysplasia (FCD) I, FCD IIa and FCD IIb and tuberous sclerosis complex (TSC) specimens in gray matter (Gm) and white matter (Wm). (B): Graph showing ODR for caspase‐3 staining in epilepsy control (no malformation of cortical development, (MCD), FCD I, FCD IIa and FCD IIb and TSC specimens in Gm and Wm. (*P < 0.05).
Caspase‐3 and caspase‐6 IR in FCD and tubers
The large majority of FCD and TSC specimens displayed prominent caspase‐3 IR in both gray and white matter (Figures 2A–G, 3B). The IR in white matter was higher compared with the grey matter in FCD IIb and TSC specimens (Figure 3B). The nuclear expression of caspase‐3 was significantly higher compared with both control autopsy (no detectable labeling) and surgical (no‐MCD) specimens and was more prominent in FCD IIb and TSC compared with FCD I and FCD IIa (Figure 3B; Supporting Information Figure S1B). On the basis of morphology, both neurons and glial cells displayed nuclear caspase‐3 IR and positive balloon (FCD IIb) and giant cells (TSC) were also detected in white matter (Figure 2A–G; Supporting Information Figure S1B; Table 3). Double‐labeling experiments confirmed the caspase‐3 expression in neuronal (NeuN‐positive cells; Figure 2F; Table 4), astroglial (GFAP‐positive cells; Figure 2H, C), oligodendroglial (Figure 2I–J; Table 4) and microglial (HLA–DR‐positive cells; Table 4) cell types. Prominent expression was particularly observed in neurons, astrocytes and balloon/giant cells (Figure 2; Tables 3 and 4). In FCD IIb and TSC specimens, we evaluated the possible correlation with clinical variables such as age at surgery, duration of epilepsy and seizure frequency. Interestingly, the caspase‐3 IR in both neuronal and glial cells was positively correlated with all three variables in FCD IIb (age at surgery: neuron, r = 0.870; glia, r = 0.545; duration of epilepsy: neuron, r = 0.967, glia, r = 0.865; seizure frequency: neuron, r = 0.962; glia, r = 0.7586, P < 0.05). In TSC, the caspase‐3 IR in both neuronal and glial cells was positively correlated with duration of epilepsy (neuron, r = 0.972 glia, r = 0.828; P < 0.05). No correlation was observed between caspase‐3 IR and the age at surgery or the seizure frequency in TSC.
Figure 2.
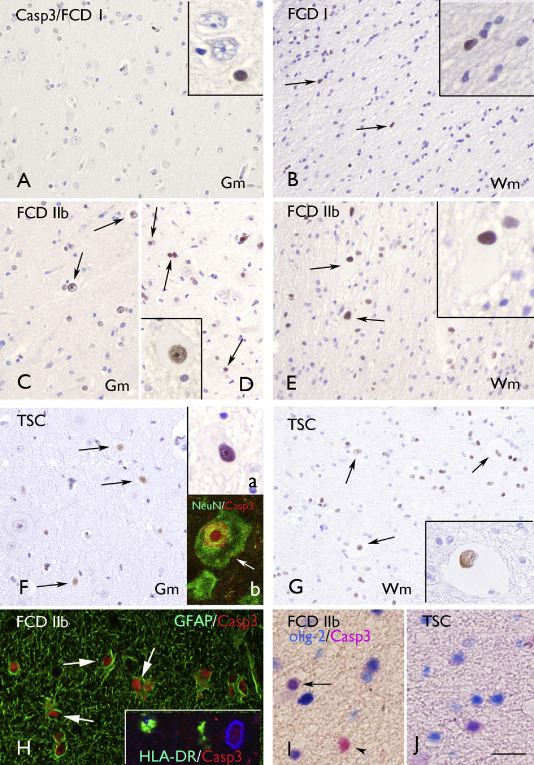
Caspase‐3 (Casp3) immunoreactivity. A–B. Focal cortical dysplasia (FCD) I with few positive cells in Gm (A) and Wm (B; arrows and inserts in A and B). C–E. FCD IIb with several positive cells in gray matter (Gm; C–D; arrows; insert in D shows a positive dysmorphic neuron) and white matter (Wm; E; arrows indicate positive balloon cells; high magnification in insert). F–G: tuberous sclerosis complex (TSC) showing several positive cells in Gm [F; arrows; insert (a) shows a positive dysmorphic neuron] and Wm (G; arrows; high magnification in insert shows a positive giant cell). Insert (b) in F shows colocalization (arrow; yellow) of Casp3 (red) with neuronal nuclear protein (green) in the nucleus of a dysmorphic neuron. H. Expression (arrows) of casp3 (red) in glial fibrillary acidic protein‐ (GFAP; green) positive cells. Insert in H shows absence of Casp3 (red) expression in human leukocyte antigen DR–1‐ (HLA‐DR; green) positive cells (nucleus, blue, 4′,6‐diamidino‐2‐phenylindole). H–I: colocalization (purple) of Casp3 with the oligodendroglial marker olig‐2 in Wm of FCD IIb (I) and TSC (I). Scale bar in I: A–G: 80 μm; H: 40 μm; I: 20 μm.
Table 4.
Cellular distribution of caspase‐3 immunoreactivity in FCD and TSC specimens.
| Antibody | Caspase‐3/FCD IIb | Caspase‐3/TSC |
|---|---|---|
| NeuN | 56.3 ± 4.3 | 60.4 ± 3.9 |
| GFAP | 29.3 ± 3.9 | 32.3 ± 5.9 |
| Olig‐2 | 12.3 ± 2.9 | 15.1 ± 3.4 |
| HLA‐DR | 4.5 ± 1.2 | 3.3 ± 1.0 |
Data represent percentages of cells immunoreactive for caspase‐3 and coexpressing NeuN,
GFAP‐, HLA‐DR, olig‐2. Data are expressed as mean ± standard error of the mean (6 FCD IIb and 6 TSC specimens).
FCD = focal cortical dysplasia; GFAP = glial fibrillary acidic protein; HLA‐DR = human leukocyte antigen DR‐1; NeuN = neuronal nuclear protein; TSC = tuberous sclerosis complex.
Caspase‐6 IR was encountered in all the FCD IIb and TSC specimens examined, whereas no staining was observed in FCD I (Figure 4; Supporting Information Figure S1C). In the majority of the FCD and TSC cases, moderate to strong IR with cytoplasmic staining was detected in both glial and neuronal cells, as well as in balloon (FCD IIb) and giant cells (TSC; Figure 4D–G). No significant correlation was found between caspase‐6 IR and clinical variables, such as age at surgery, seizure frequency and duration of epilepsy.
Figure 4.
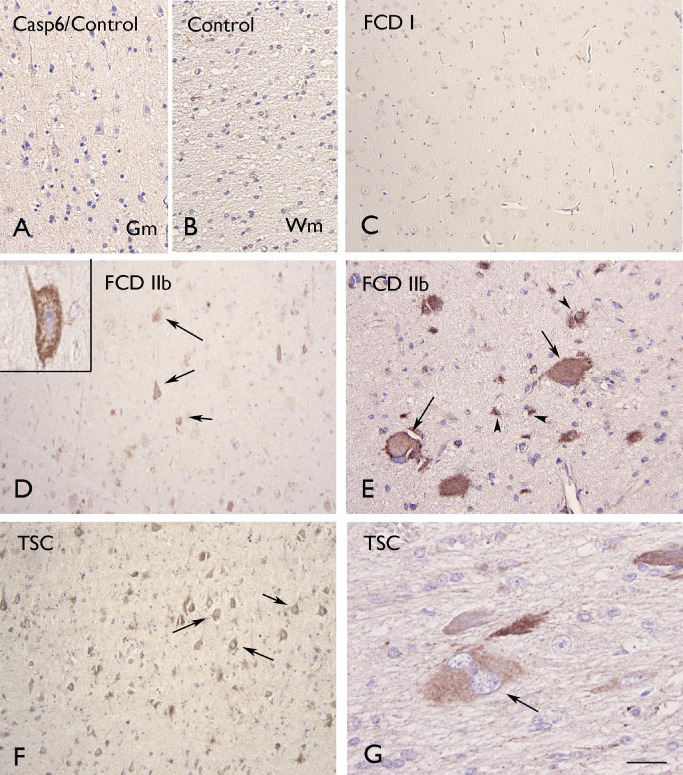
Caspase‐6 (Casp6) immunoreactivity. A–B. Control gray matter (Gm; A) and white matter (Wm; B) showing absence of glial or neuronal labeling. Focal cortical dysplasia (FCD) I without detectable glial or neuronal labeling. D–E. FCD IIb with several positive cells within the dysplastic cortex (arrows in D indicate dysmorphic neurons; high magnification in insert; arrows in E indicate positive balloon cells). F–G. Tuberous sclerosis complex (TSC) showing positive dysmorphic neurons (arrows in F) and giant cells (arrows in G). Scale bar in G: A–B: 80 μm; C, D, F: 160 μm; E: 40 μm; G: 20 μm.
β‐Amyloid precursor protein (APP) in FCD and tubers
Evaluation of APP in FCD and TSC specimens showed increased IR in dysmorphic neurons and positive neuronal process in FCD II (a and b) and in TSC within the dysplastic region (Figure 5C–I). No detectable neuronal IR was observed in control (Figure 1A–B) as well as in FCD I specimens (not shown). Balloon, giant cells and astrocyes did not display APP IR (Figure 5I); this was confirmed by double‐labeling experiments (data not shown). All cases were amyloid –β negative. No significant correlation was found between APP IR and clinical variables, such as age at surgery, seizure frequency and duration of epilepsy. In all cases included in this study, β‐amyloid plaques were not detected.
Figure 5.
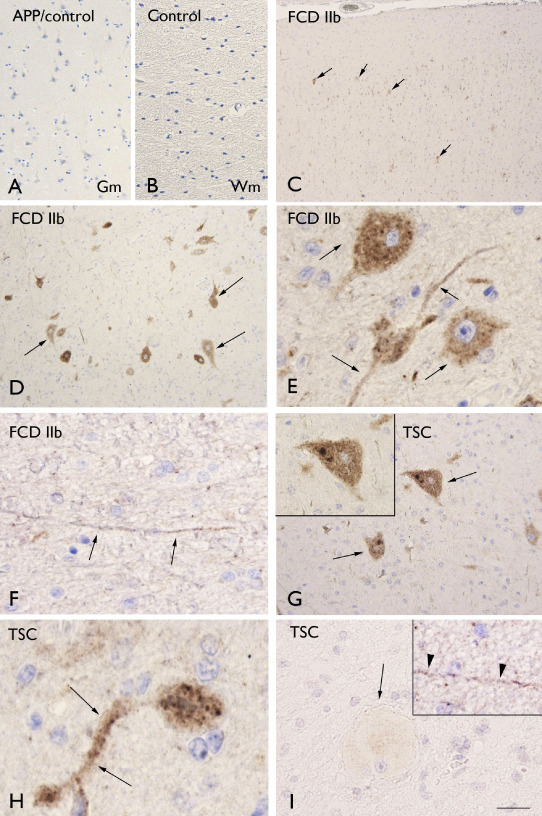
Amyloid precursor protein (APP) immunoreactivity. A–B. Control gray matter (Gm; A) and white matter (Wm; B) showing absence of glial or neuronal labeling. C–F. Focal cortical dysplasia (FCD) IIb with positive dysmorphic neurons in Gm (C–F; arrows) and positive neuronal process in Wm (F). G–H. Tuberous sclerosis complex (TSC) showing several positive dysmorphic neurons in Gm (G–H; arrows; insert in G). Panel I shows absence of immunoreactivity in giant cells in TSC (Wm; arrow), but positivity in neuronal process (insert in I, arrow‐heads). Scale bar in I: A: 160 μm; B–D: 80 μm; C: 300 μm; G: 40 μm; E–I: 30 μm.
Death receptor‐6 (DR6) IR in FCD and tubers
In human control cortical autopsy specimens (Figure 6A), as well as in surgical control specimens (no‐MCD) and in FCD I (not shown), DR6 IR was present throughout all cortical layers with neuropil labeling around the somata and dendrites of large pyramidal neurons. In FCD II (a and b), we also observed an abnormal DR6 expression pattern, with clusters of punctate labeling along cell borders and processes of dysmorphic neurons and increased expression in neuronal perikarya (Figure 6C–I). Increased DR6 IR was also observed in the white matter around balloon/giant cells in FCD IIb and TSC (Figure 6F, G, I). Occasionally, co‐localization of DR6 and APP was observed in neuronal process within the gray and white matter (Figure 6E, G). No significant correlation was found between DR6 IR and clinical variables, such as age at surgery, seizure frequency and duration of epilepsy.
Figure 6.
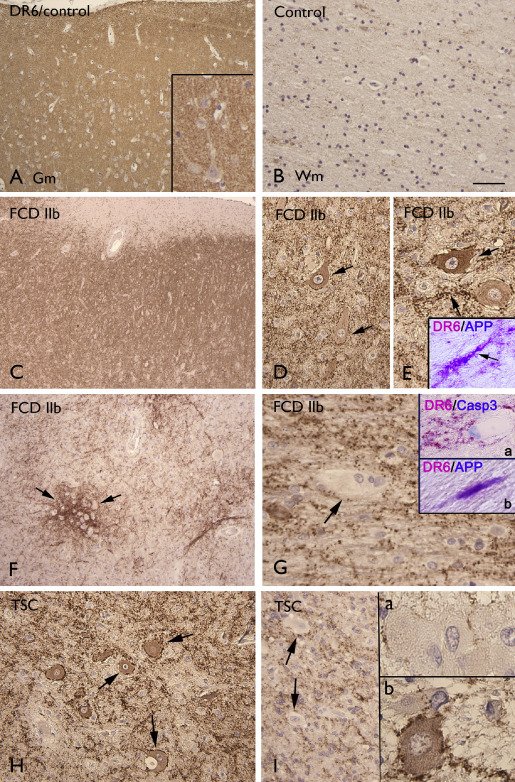
Death receptor‐6 (DR6) immunoreactivity. A–B. Control showing diffuse neuropil DR6 immunoreactivity (IR) in gray matter (Gm; A), but absence of glial staining in white matter (Wm; B). C–E. Focal cortical dysplasia (FCD) IIb (Gm) showing diffuse neuropil DR6 with increased IR in and around dysmorphic neurons (arrows in D and E). Insert in E shows co‐localization (purple) of DR6 and APP in neuronal process within the Gm (Figure 7 G–H). F–G. FCD IIb (Wm) showing DR6 IR surrounding balloon cells (arrows). Insert (a) in G shows DR6 IR surrounding a caspase‐3 positive balloon cell. Insert (b) in G shows shows co‐localization (purple) of DR6 and APP in within the Wm. H–I. TSC showing diffuse neuropil DR6 with increased IR in and around dysmorphic neurons (arrows in H, Gm and insert (b) in I, Wm) and DR6 IR surrounding giant cells [arrows in I and insert (a) in I]. Scale bar in B: A, C, F: 160 μm; B, D, H: 80 μm; E, I: 40 μm.
Hyperphosphorylated tau in FCD and tubers
In younger FCD and TSC patients (age < 30), no dysmorphic neurons demonstrated IR for phosphorylated tau and tau‐positive neuropil threads were not observed. In seven FCD IIb cases and four TSC with age over 30, we observed tau‐positive neuropil threads within the dysplastic region and in three FCD IIb (age > 40) and two TSC (age > 30), hyperphosphorylated tau was also detected in dysmorphic neurons (Figure 7A–F), but not in balloon/giant cells. Hyperphosphorylated tau was not detected in the adjacent normal cortex. In two TSC cases, in which post‐mortem examination was performed, hyperphosphorylated tau IR was only confined to the dysplastic zone, which displayed a relative hypocellularity. In five FCD IIb, with IR for phosphorylated tau and with adjacent normal cortex, the neuronal cortical density was calculated, as previously reported 11, 58, using NeuN as a neuronal marker. Mean neuronal densities on NeuN‐stained sections were 14.2 × 10³/mm3 [standard deviation (SD): 5.7] in the dysplastic region compared with 41.2 × 10³/mm3 (SD: 9.4) in the adjacent cortex. The density was significantly lower in the dysplastic zone compared with the adjacent cortex (P < 0.05). In these cases, there was no significant correlation between cell density and clinical variables (including age at surgery, duration of epilepsy and seizure frequency).
Figure 7.
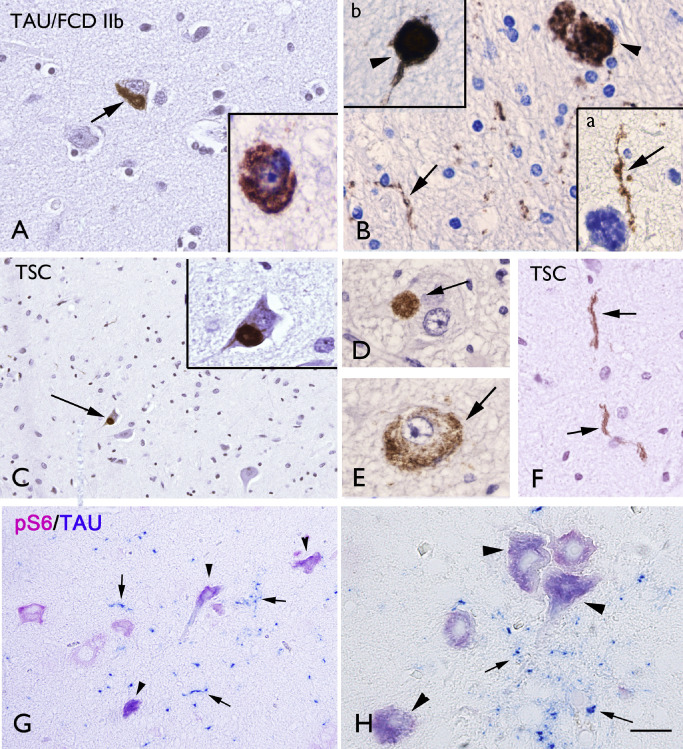
Hyperphosphorylated tau immunoreactivity. A–B. Focal cortical dysplasia (FCD) IIb with hyperphosphorylated tau immunoreactivity (IR) in dysmorphic neurons (arrow in A and insert) and in neuronal processes within the white matter (arrow in B and insert a), with occasionally accumulation in axonal spheroids (arrow‐head in B and insert b). C–F. Tuberous sclerosis complex (TSC) showing hyperphosphorylated tau IR in dysmorphic neurons (arrows in C–D) and in neuronal processes (arrows in F). G–H. Co‐localization of caspase‐6 and APP in dystrophic neurites (purple; arrows and insert). Panel H: tau‐positive neuropil threads (blue; arrows) and co‐localization of tau and phospho‐S6 ribosomal protein (pS6) IR in dysmorphic neurons (purple; arrow‐heads). Scale bar in F: A–B, D–F, H: 40 μm; C, G: 80 μm.
Tau‐positive neuropil threads were often observed around phospho‐S6 ribosomal protein (pS6)‐positive cells and co‐localization of Tau and pS6 was detected in dysmorphic neurons (Figure 7G–H). No detectable hyperphosphorylated tau was observed in FCD I and in control specimens. There was no correlation between hyperphosphorylated tau IR and seizure frequency.
p62 IR in FCD and tubers
In all FCD II and TSC specimens, nuclear/cytoplasmic p62 IR was detected in both dysmorphic neurons and balloon/giant cells (FCD IIb and TSC) within the dysplastic region (Figure 8A–D) and colocalization with ubiquitin was observed (data not shown). p62 IR was not detected in FCD I and in control specimens. No significant correlation was found between the p62‐positivity and clinical variables, such as age at surgery, seizure frequency and duration of epilepsy.
Figure 8.
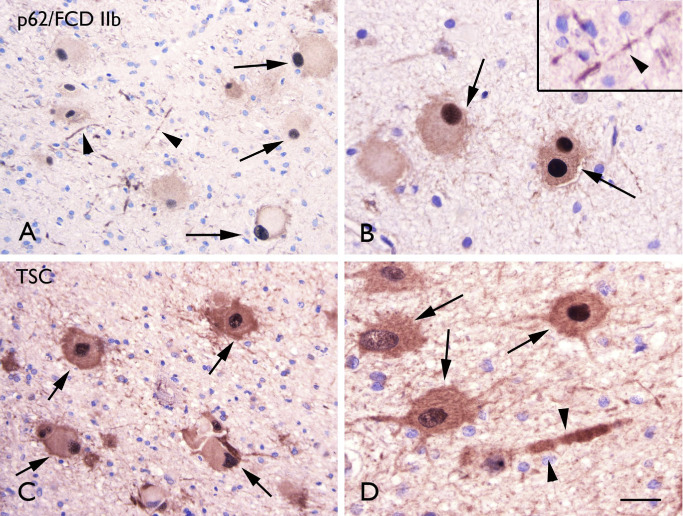
p62 immunoreactivity. A–B. Focal cortical dysplasia (FCD) IIb with p62 immunoreactivity (IR) in balloon cells with strong nuclear expression (arrows in A and B) and in neuronal processes (arrow‐heads in A and insert in B). C–D. Tuberous sclerosis complex (TSC) showing p62 IR several p62 immunoreactive cells (arrows; dysmprphic neurons and giant cells) and occasionally positive neuronal processes (arrow‐heads in D). Scale bar in D: A–B: 80 μm; B–D: 40 μm.
Transactive response–DNA‐binding protein 43 (TDP‐43) immunoractivity in FCD and tubers
The expression pattern of TDP‐43 in FCD and TSC was similar to controls, showing nuclear expression in both neuronal and glial cells, as well as in balloon/giant cells in FCD IIb and TSC cases (Figure 9A–B). Cytoplasmic phosphorylated TDP‐43 IR was detected in dysmorphic neurons of both FCD IIb and TSC specimens (Figure 9C–D). Phosphorylated TDP‐43 IR was not detected in FCD I and in control specimens. No significant correlation was found between phosphorylated TDP‐43 IR and clinical variables, such as age at surgery, seizure frequency and duration of epilepsy.
Figure 9.
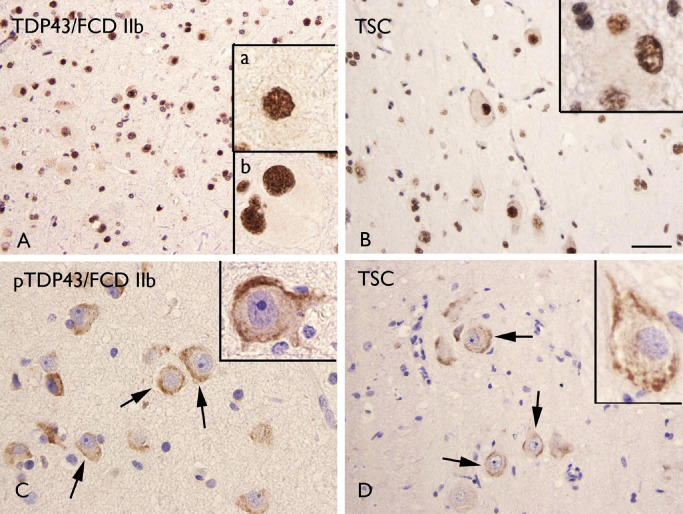
Transactive response–DNA‐binding protein 43 (TDP‐43) and phosphorylated TDP‐43 (pTDP‐43) immunoreactivity (IR). A–B. TDP‐43 IR in focal cortical dysplasia (FCD) IIb (A) and tuberous sclerosis complex (TSC) (B) showing nuclear staining in both glial and neuronal cells. Insert (a) in A shows a positive dysmorphic neuron; insert (b) in A shows a positive balloon cell. Insert in B shows a positive giant cell. C–D. pTDP‐43 IR in FCD IIb (C) and TSC (D) showing cytoplasmic staining in dysmorphic neurons (arrows in C–D and high magnification in inserts). Scale bar in D: A–B, D: 80 μm; C: 40 μm.
Discussion
We examined cellular injury through activation of apoptosis‐signaling pathways and the expression pattern of neurodegeneration‐related proteins in tissue from patients with FCD and chronic medically intractable epilepsy.
Several studies provide evidence of cell injury, including apoptosis, in MCD associated with epilepsy 12, 19, 27, 39. However evaluation in specific FCD subtypes (FCD I and II) compared with TSC, as well as the possible correlation with seizure history is still lacking. Moreover, the majority of neuropathological studies of FCD and TSC use surgical material from pediatric patients.
Cell injury in FCD and TSC: apoptosis and relation to clinical variables
In the present study, we confirmed the occurrence of cell injury in specimens from patients with FCD and TSC with fragmented DNA and caspase‐3 expression in both gray and white matter. We demonstrate that the severity of these changes is greater in FCD type IIb than in specimens from patients with FCD types I and IIa (despite the absence of significant differences in seizure frequency and duration). These results indicate that cell injury is not simply an effect of seizure activity. However, both TUNEL and caspase‐3 labeling in FCD IIb and TSC positively correlate with duration of epilepsy and, in FCD IIb, a positive correlation was also observed with the age at surgery and the seizure frequency. These observations may suggest that FCD IIb and TSC are more susceptible to the pathological effects of chronic seizures. DNA fragmentation in neurons and astrocytes has been reported in specimens of pediatric patients with chronic intractable epilepsy and its severity significantly correlated with seizure frequency 19. However, this study included different pathologies and in the cases with cortical dysplasia the histological subtype was not specified. Our study underlines the importance of these pathological changes in FCD IIb and TSC. The higher TUNEL labeling observed in the white matter in both FCD IIb and TSC specimens possibly reflects the presence of a large population of TUNEL‐positive balloon cells/giant cells located within the white matter.
Increased expression levels for genes associated with apoptosis (including the initiator of apoptosis, caspase‐8 and the effector, caspase‐6) were reported in TSC vs. control specimens 12 and caspase‐8 was observed in dysmorphic neurons, giant cells and astrocytes in tubers, but was absent from control cortex as well as in perituberal cortex 39. In this study, we confirm the occurrence of apoptotic cell death (involving both caspases‐3 and 6) within tubers in TSC patients with prominent activation of caspase‐3 in dysmorphic neurons, giant cells and astrocytes and more limited expression in oligodendrocytes. Moreover, we show a similar expression pattern in FCD IIb as in TSC, indicating apoptosis‐mediated ongoing cell death within the dysplastic cortex.
On the other hand, although caspase‐3 is generally considered a key protein in mediating cell death, evidence also indicates a possible non‐apoptotic role for this enzyme [reviewed in 21]. Accordingly, caspase‐3 has been suggested to play a role in the regulation of neural stem cell differentiation and synaptic plasticity and caspase‐3 expression can be observed in cells that do not exhibit classical morphological features of apoptosis. Thus, although a strong and persistent activation of caspase‐3 induces cell death, several mechanisms may regulate the enzyme activation level and substrate specificities, promoting its non‐apoptotic functions [reviewed in 21].
Cell injury in FCD and TSC: DR6
DR6 (tumor necrosis factor receptor superfamily 21) is a relatively new member of the death receptor family, which has been found to induce apoptosis when overexpressed [47, 68 for a review, see 6, 7]. An attractive hypothesis, provided by in vitro and in vivo studies is that activation of DR6 by N‐terminal‐APP (N‐APP) may, via caspases, contribute to degenerative processes 43. Interestingly, different signaling cascades have been shown to be involved in degeneration of the axon (caspase‐6) and neuronal cell body (caspase‐3) 43, 63. In our study, we observed, within the dysplastic region of FCD II and TSC specimens (but not in FCD I), increased DR6 IR around and in dysmorphic neurons, as well as around balloon/giant cells. Thus, potentially, activation of DR6 could contribute to accelerate cell injury within the dysplastic region through apoptosis mechanisms involving caspases‐6 and 3. Moreover, a novel apoptotic pathway that mediates the DR6 apoptotic signal to mitochondrial dysfunction has been reported 68. In addition, recent studies suggest additional physiological functions of DR6 during brain development, including the regulation of myelination and vascular development 41, 57.
In our study, we observed increased APP expression in dysmorphic neurons and colocalization with DR6 was detected in neuronal process within the dysplastic region. Whether APP may play a central role in the activation of DR6 is still matter of discussion. In particular, the mechanism of formation of N‐APP fragment, its physiological role in the human brain 25, 30, as well as the structural features of the potential DR6–APP signaling complex is still a matter of debate 34, 49. Future investigation, targeting DR6 in experimental rodent models, might be worthwhile to highlight the role DR6 mediated pathways in epilepsy.
The increased expression of APP in FCD II and TSC is also particularly interesting because developmental overexpression of dendritic APP and amyloid –β has been suggested to play a role in the increased seizure susceptibility observed in Alzheimer's disease, Down syndrome and Fragile X syndrome 66, 67. The increased expression of APP was, however, not associated with deposition of amyloid –β in our cohort. In a previous study 53, amyloid –β IR was detected in the dysplastic zone only in the oldest two FCD IIb patients (age > 50 years) and there was an absence of amyloid –β‐positive plaques in the large majority (66%) of epilepsy cases in a large cohort of patients with hippocampal sclerosis 59.
Expression pattern of neurodegeneration‐related proteins in FCD and TSC
To our knowledge, only one study has explored the occurrence of tau‐mediated neurodegeneration in FCD II including older patients 53. In our study, we confirm the occurrence of tau pathology confined to the dysplastic zone, which displayed neuronal hypocellularity. Thus, both studies support the potential contribution of tau accumulation in a premature degeneration of neurons within the dysplastic region. Interestingly, no tau accumulation was observed in the adjacent non‐dysplastic cortex from these patients. Several mechanisms may potentially contribute to accumulation of hyperphosphorylated tau. Prior studies have linked amyloid β to tau phosphorylation [for a review, see 10]. However, as discussed earlier, tau accumulation was not associated with β‐amyloid deposition within the dysplastic zone in the present study. Seizure‐induced excitotoxic insult can also potentially contribute to tau hyperphosphorylation 14; however, in our cohort, there was no correlation between hyperphosphorylated tau IR and seizure frequency, and tau pathology was not detected in the immediately adjacent histologically normal cortex or in specimens of FCD I (exposed to similar seizure activity and duration of epilepsy). A mechanism that could explain the difference between FCD IIb and I, is represented by the presence in FCD IIb 28 of a prominent inflammatory response with pro‐inflammatory cytokines, which may indirectly modulate tau phosphorylation 10. However, the issue whether the induction of a similar inflammatory response occurs also in FCD IIa still needs to be clarified.
CDK5 and the mTOR‐signaling pathways, which are known to be activated in FCD II and TSC [but not in FCD I 28; for a review, see 9, 20], have been implicated in the mechanisms underlying cellular aging and neurodegeneration, including tau hyperphosphorylation 1, 17, 31, 37, 42, 44, 48. Interestingly, tau‐positive neuropil threads were often observed in cortical regions with prominent IR for pS6 (used as marker of mTOR pathway activation) and hyperphosphorylated tau was detected in pS6‐positive dysmorphic neurons. Moreover, recently, enhanced levels of phosphorylated tau protein have been also reported within the dysplasic cortex of three male infants with hemimegalencephaly (HMEG) with evidence of mTOR hyperactivation 51. The authors suggest an early defect in microtubules in the pathogenesis of HMEG, possibly related to v‐akt murine thymoma viral oncogene homolog 3, which is involved in the mTOR‐signaling pathway and has been shown to regulate tau degradation 22. However, further investigation is required to ascertain the potential interaction between mTOR activation in FCD II, TSC (as well as in HMEG) and a premature activation of neurodegenerative mechanisms. Interestingly, a recent study suggests a novel viral etiology for FCD IIb 18, which may explain the constitutive activation of mTOR in this focal malformation of cortical development 56.
Dysfunction in ubiquitin‐mediated proteolysis with accumulation of ubiquitin‐conjugated proteins may also contribute to neurodegeneration 32, 50. Gene expression analysis of TSC cortical tubers revealed a deregulation of genes associated with ubiquitination (eg, ubiquitin cycle and protein ubiquitination) 12. Moreover, the mTOR signaling (overactivated in both TSC and FCD IIb) is a major negative regulator of autophagy [69; for a review, see 35].
p62 is a stress‐inducible intracellular protein, which is known to regulate different signal transduction pathways, and has been recently identified as a key target of autophagy [for reviews, see 26, 33]. Because p62 has been shown to be degraded by the autophagic–lysosome pathway, an inhibition of autophagy may result in the accumulation of this protein. In our study, we observed nuclear and cytoplasmic accumulation of p62 IR in dysmorphic neurons and giant cells/balloon of TSC and FCD IIb specimens, which are both associated with overactivation of the mTOR pathway. There was no correlation between p62 expression and seizure frequency and p62 IR was not detected in the immediately adjacent histologically normal cortex or in specimens of FCD I, exposed to similar seizure activity and duration of epilepsy. Interestingly, while autophagy regulates the level of p62 protein, p62 has been shown to inhibit autophagy via activation of mTORC1 [for a review, see 33]. Further histopathological and functional studies of brain tissue from patients with TSC and FCD II will now be important to better understand the complex interaction among mTOR, p62 and other autophagy‐related protein (such as LC3 and NRB1). Moreover, the physiological role of p62 in aggregate formation still remains largely unknown and additional functions involving other signal transduction pathways, such as nuclear factor‐kappa B signaling and apoptosis (activated in both TSC and FCD IIb) should also be taken under consideration [for a review, see 33].
We also evaluated the expression and cellular distribution of TDP‐43 and pTDP‐43 in TSC and FCD specimens. TDP43 is a ubiquitously expressed multifunctional DNA‐/RNA‐binding protein that has been identified as the major component of the cytoplasmic ubiquitin‐positive inclusions in different neurodegenerative disorders [such as frontotemporal lobar dementia and amyotrophic lateral sclerosis; for a review, see 54]. Recently, a link between abnormal cytoplasmic accumulation of this protein and mTOR pathway has been suggested, showing that inhibition of mTOR can reduce TDP43‐positive cytoplasmic inclusions, restoring its mislocalization 16, 64, 65. In both TSC and FCD specimens, the expression pattern of TDP‐43 was similar to controls and we did not observed TDP‐positive inclusions in the cytoplasm of dysmorphic neurons and balloon/giant cells. However, cytoplasmic aggregates of pTDP43 were detected in dysmorphic neurons of both FCD IIb and TSC specimens. The significance of this hyperphosphorylation remains unclear; however, recently, hyperphosphorylation has been suggested to represent a defense mechanism to reduce TDP43 aggregation 36.
In conclusion, our data provide evidence of complex, but similar mechanisms of cell injury in focal MCD associated with mTOR pathway hyperactivation (FCD II and TSC), supporting a link between neurodevelopmental and neurodegenerative pathways. Further characterization of the role of the different neurodegenerative mechanisms discussed in this study could help to clarify their potential contribution to progressive cognitive dysfunction in patients with focal malformation of cortical development associated with epilepsy.
Supporting information
Figure S1. Distribution of terminal deoxynucleotidyl transferase‐mediated 2′‐deoxyuridine 5′‐triphosphate nick‐end labeling (TUNEL) (A), caspase‐3 (B) and caspase‐6 (C) labeling scores (total score; see for details Methods section) in astrocytes and neurons in control cortex, epilepsy control [no malformations of cortical development (MCD)], focal cortical dysplasia (FCD) I and FCD II and tuberous sclerosis complex (TSC).
Acknowledgments
This work has been supported by National Epilepsy Fund [NEF‐12‐12 (EA)] and EU FP7 Project DEVELAGE (Grant Agreement N 278486; EA and AI). We are grateful to A. Kurtz, V.B. Lindeboom and J. van Scheppingen for their technical help. None of the authors has any conflict of interest to disclose. We confirm that we have read the journal's position on issues involved in ethical publication and affirm that this report is consistent with those guidelines.
References
- 1. An WL, Cowburn RF, Li L, Braak H, Alafuzoff I, Iqbal K et al (2003) Up‐regulation of phosphorylated/activated p70 S6 kinase and its relationship to neurofibrillary pathology in Alzheimer's disease. Am J Pathol 163:591–607. [DOI] [PMC free article] [PubMed] [Google Scholar]
- 2. Aronica E, Gorter JA, Jansen GH, van Veelen CW, van Rijen PC, Ramkema M, Troost D (2003) Expression and cell distribution of group I and group II metabotropic glutamate receptor subtypes in Taylor‐type focal cortical dysplasia. Epilepsia 44:785–795. [DOI] [PubMed] [Google Scholar]
- 3. Aronica E, Gorter JA, Redeker S, Ramkema M, Spliet WG, van Rijen PC et al (2005) Distribution, characterization and clinical significance of microglia in glioneuronal tumours from patients with chronic intractable epilepsy. Neuropath Appl Neurobiol 31:280–291. [DOI] [PubMed] [Google Scholar]
- 4. Baybis M, Yu J, Lee A, Golden JA, Weiner H, McKhann G, 2nd et al (2004) mTOR cascade activation distinguishes tubers from focal cortical dysplasia. Ann Neurol 56:478–487. [DOI] [PubMed] [Google Scholar]
- 5. Ben‐Ari Y (2008) Neuro‐archaeology: pre‐symptomatic architecture and signature of neurological disorders. Trends Neurosci 31:626–636. [DOI] [PubMed] [Google Scholar]
- 6. Benschop R, Wei T, Na S (2009) Tumor necrosis factor receptor superfamily member 21: TNFR‐related death receptor‐6, DR6. Adv Exp Med Biol 647:186–194. [DOI] [PubMed] [Google Scholar]
- 7. Bhardwaj A, Aggarwal BB (2003) Receptor‐mediated choreography of life and death. J Clin Immunol 23:317–332. [DOI] [PubMed] [Google Scholar]
- 8. Blumcke I, Spreafico R (2011) An international consensus classification for focal cortical dysplasias. Lancet Neurol 10:26–27. [DOI] [PubMed] [Google Scholar]
- 9. Blümcke I, Vinters HV, Armstrong D, Aronica E, Thom M, Spreafico R (2009) Malformations of cortical development and epilepsies: neuropathological findings with emphasis on focal cortical dysplasia. Epileptic Dis 11:181–193. [DOI] [PubMed] [Google Scholar]
- 10. Blurton‐Jones M, Laferla FM (2006) Pathways by which Abeta facilitates tau pathology. Curr Alzheimer Res 3:437–448. [DOI] [PubMed] [Google Scholar]
- 11. Boer K, Troost D, Timmermans W, Gorter JA, Spliet WG, Nellist M et al (2008) Cellular localization of metabotropic glutamate receptors in cortical tubers and subependymal giant cell tumors of tuberous sclerosis complex. Neuroscience 156:203–215. [DOI] [PubMed] [Google Scholar]
- 12. Boer K, Crino PB, Gorter JA, Nellist M, Jansen FE, Spliet WG et al (2010) Gene expression analysis of tuberous sclerosis complex cortical tubers reveals increased expression of adhesion and inflammatory factors. Brain Pathol 20:704–719. [DOI] [PMC free article] [PubMed] [Google Scholar]
- 13. Boer K, Troost D, Timmermans W, van Rijen PC, Spliet WG, Aronica E (2010) Pi3K‐mTOR signaling and AMOG expression in epilepsy‐associated glioneuronal tumors. Brain Pathol 20:234–244. [DOI] [PMC free article] [PubMed] [Google Scholar]
- 14. Bossy‐Wetzel E, Schwarzenbacher R, Lipton SA (2004) Molecular pathways to neurodegeneration. Nat Med 10(Suppl.):S2–S9. [DOI] [PubMed] [Google Scholar]
- 15. Bothwell M, Giniger E (2000) Alzheimer's disease: neurodevelopment converges with neurodegeneration. Cell 102:271–273. [DOI] [PubMed] [Google Scholar]
- 16. Caccamo A, Majumder S, Deng JJ, Bai Y, Thornton FB, Oddo S (2009) Rapamycin rescues TDP‐43 mislocalization and the associated low molecular mass neurofilament instability. J Biol Chem 284:27416–27424. [DOI] [PMC free article] [PubMed] [Google Scholar]
- 17. Cai Z, Zhao B, Li K, Zhang L, Li C, Quazi SH, Tan Y (2012) Mammalian target of rapamycin: a valid therapeutic target through the autophagy pathway for Alzheimer's disease? J Neurosci Res 90:1105–1118. [DOI] [PubMed] [Google Scholar]
- 18. Chen J, Tsai V, Parker WE, Aronica E, Baybis M, Crino PB (2012) Detection of human papillomavirus in human focal cortical dysplasia type IIB. Ann Neurol 72:881–992. [DOI] [PubMed] [Google Scholar]
- 19. Choi J, Nordli DR, Jr , Alden TD, DiPatri A, Jr , Laux L, Kelley K et al (2009) Cellular injury and neuroinflammation in children with chronic intractable epilepsy. J Neuroinflammation 6:38. [DOI] [PMC free article] [PubMed] [Google Scholar]
- 20. Crino PB (2011) mTOR: a pathogenic signaling pathway in developmental brain malformations. Trends Mol Med 17:734–742. [DOI] [PubMed] [Google Scholar]
- 21. D'Amelio M, Cavallucci V, Cecconi F (2010) Neuronal caspase‐3 signaling: not only cell death. Cell Death Differ 17:1104–1114. [DOI] [PubMed] [Google Scholar]
- 22. Dickey CA, Koren J, Zhang YJ, Xu YF, Jinwal UK, Birnbaum MJ et al (2008) AKT and CHIP coregulate tau degradation through coordinated interactions. Proc Natl Acad Sci U S A 105:3622–3627. [DOI] [PMC free article] [PubMed] [Google Scholar]
- 23. Engel JJ (1993) Outcome with respect to epileptic seizures. In: Surgical Treatment of the Epilepsies, Engel JJ (ed.), pp. 609–621. Raven Press: New York. [Google Scholar]
- 24. Gomez M, Sampson J, Whittemore V (1999) The Tuberous Sclerosis Complex. Oxford University Press: Oxford. [Google Scholar]
- 25. Guo Q, Li H, Gaddam SS, Justice NJ, Robertson CS, Zheng H (2012) Amyloid precursor protein revisited: neuron‐specific expression and highly stable nature of soluble derivatives. J Biol Chem 287:2437–2445. [DOI] [PMC free article] [PubMed] [Google Scholar]
- 26. Ichimura Y, Komatsu M (2010) Selective degradation of p62 by autophagy. Semin Immunopathol 32:431–436. [DOI] [PubMed] [Google Scholar]
- 27. Inoue H, Matsushige T, Hasegawa S, Abe A, Iida Y, Inoue T, Ichiyama T (2012) Elevation of tau protein levels in the cerebrospinal fluid of children with West syndrome. Epilepsy Res 102:8–12. [DOI] [PubMed] [Google Scholar]
- 28. Iyer A, Zurolo E, Spliet WG, van Rijen PC, Baayen JC, Gorter JA, Aronica E (2010) Evaluation of the innate and adaptive immunity in type I and type II focal cortical dysplasias. Epilepsia 51:1763–1773. [DOI] [PubMed] [Google Scholar]
- 29. Iyer AM, Zurolo E, Boer K, Baayen JC, Giangaspero F, Arcella A et al (2010) Tissue plasminogen activator and urokinase plasminogen activator in human epileptogenic pathologies. Neuroscience 167:929–945. [DOI] [PubMed] [Google Scholar]
- 30. Jefferson T, Causevic M, auf dem Keller U, Schilling O, Isbert S, Geyer R et al (2011) Metalloprotease meprin beta generates nontoxic N‐terminal amyloid precursor protein fragments in vivo . J Biol Chem 286:27741–27750. [DOI] [PMC free article] [PubMed] [Google Scholar]
- 31. Katewa SD, Kapahi P (2011) Role of TOR signaling in aging and related biological processes in Drosophila melanogaster. Exp Gerontol 46:382–390. [DOI] [PMC free article] [PubMed] [Google Scholar]
- 32. Komatsu M, Ichimura Y (2010) Physiological significance of selective degradation of p62 by autophagy. FEBS Lett 584:1374–1378. [DOI] [PubMed] [Google Scholar]
- 33. Komatsu M, Kageyama S, Ichimura Y (2012) p62/SQSTM1/A170: physiology and pathology. Pharmacol Res 66:457–462. [DOI] [PubMed] [Google Scholar]
- 34. Kuester M, Kemmerzehl S, Dahms SO, Roeser D, Than ME (2011) The crystal structure of death receptor 6 (DR6): a potential receptor of the amyloid precursor protein (APP). J Mol Biol 409:189–201. [DOI] [PubMed] [Google Scholar]
- 35. Laplante M, Sabatini DM (2012) mTOR signaling in growth control and disease. Cell 149:274–293. [DOI] [PMC free article] [PubMed] [Google Scholar]
- 36. Li HY, Yeh PA, Chiu HC, Tang CY, Tu BP (2011) Hyperphosphorylation as a defense mechanism to reduce TDP‐43 aggregation. PLoS ONE 6:e23075. [DOI] [PMC free article] [PubMed] [Google Scholar]
- 37. Li X, Alafuzoff I, Soininen H, Winblad B, Pei JJ (2005) Levels of mTOR and its downstream targets 4E‐BP1, eEF2, and eEF2 kinase in relationships with tau in Alzheimer's disease brain. FEBS J 272:4211–4220. [DOI] [PubMed] [Google Scholar]
- 38. Ljungberg MC, Bhattacharjee MB, Lu Y, Armstrong DL, Yoshor D, Swann JW et al (2006) Activation of mammalian target of rapamycin in cytomegalic neurons of human cortical dysplasia. Ann Neurol 60:420–429. [DOI] [PubMed] [Google Scholar]
- 39. Maldonado M, Baybis M, Newman D, Kolson DL, Chen W, McKhann GN et al (2003) Expression of ICAM‐1, TNF‐alpha, NF kappa B, and MAP kinase in tubers of the tuberous sclerosis complex. Neurobiol Dis 14:279–290. [DOI] [PubMed] [Google Scholar]
- 40. Martinian L, Boer K, Middeldorp J, Hol EM, Sisodiya SM, Squier W et al (2009) Expression patterns of glial fibrillary acidic protein (GFAP)‐delta in epilepsy‐associated lesional pathologies. Neuropathol Appl Neurobiol 35:394–405. [DOI] [PubMed] [Google Scholar]
- 41. Mi S, Lee X, Hu Y, Ji B, Shao Z, Yang W et al (2011) Death receptor 6 negatively regulates oligodendrocyte survival, maturation and myelination. Nat Med 17:816–821. [DOI] [PubMed] [Google Scholar]
- 42. Nguyen MD, Mushynski WE, Julien JP (2002) Cycling at the interface between neurodevelopment and neurodegeneration. Cell Death Differ 9:1294–1306. [DOI] [PubMed] [Google Scholar]
- 43. Nikolaev A, McLaughlin T, O'Leary DD, Tessier‐Lavigne M (2009) APP binds DR6 to trigger axon pruning and neuron death via distinct caspases. Nature 457:981–989. [DOI] [PMC free article] [PubMed] [Google Scholar] [Retracted]
- 44. Oddo S (2012) The role of mTOR signaling in Alzheimer disease. Front Biosci 4:941–952. [DOI] [PMC free article] [PubMed] [Google Scholar]
- 45. Orlova KA, Tsai V, Baybis M, Heuer GG, Sisodiya S, Thom M et al (2010) Early progenitor cell marker expression distinguishes type II from type I focal cortical dysplasias. J Neuropathol Exp Neurol 69:850–863. [DOI] [PMC free article] [PubMed] [Google Scholar]
- 46. Palmini A, Najm I, Avanzini G, Babb T, Guerrini R, Foldvary‐Schaefer N et al (2004) Terminology and classification of the cortical dysplasias. Neurology 62(6 Suppl. 3):S2–S8. [DOI] [PubMed] [Google Scholar]
- 47. Pan G, Bauer JH, Haridas V, Wang S, Liu D, Yu G et al (1998) Identification and functional characterization of DR6, a novel death domain‐containing TNF receptor. FEBS Lett 431:351–356. [DOI] [PubMed] [Google Scholar]
- 48. Patrick GN, Zukerberg L, Nikolic M, de la Monte S, Dikkes P, Tsai LH (1999) Conversion of p35 to p25 deregulates CDK5 activity and promotes neurodegeneration. Nature 402:615–622. [DOI] [PubMed] [Google Scholar]
- 49. Ponomarev SY, Audie J (2011) Computational prediction and analysis of the DR6‐NAPP interaction. Proteins 79:1376–1395. [DOI] [PubMed] [Google Scholar]
- 50. Rusten TE, Simonsen A (2008) ESCRT functions in autophagy and associated disease. Cell Cycle 7:1166–1172. [DOI] [PubMed] [Google Scholar]
- 51. Sarnat HB, Flores‐Sarnat L, Crino P, Hader W, Bello‐Espinosa L (2012) Hemimegalencephaly: foetal tauopathy with mTOR hyperactivation and neuronal lipidosis. Folia Neuropathologica 50:330–345. [DOI] [PubMed] [Google Scholar]
- 52. Schick V, Majores M, Koch A, Elger CE, Schramm J, Urbach H, Becker AJ (2007) Alterations of phosphatidylinositol 3‐kinase pathway components in epilepsy‐associated glioneuronal lesions. Epilepsia 48(Suppl. 5):65–73. [DOI] [PubMed] [Google Scholar]
- 53. Sen A, Thom M, Martinian L, Harding B, Cross JH, Nikolic M, Sisodiya SM (2007) Pathological tau tangles localize to focal cortical dysplasia in older patients. Epilepsia 48:1447–1454. [DOI] [PubMed] [Google Scholar]
- 54. Sephton CF, Cenik B, Cenik BK, Herz J, Yu G (2012) TDP‐43 in central nervous system development and function: clues to TDP‐43‐associated neurodegeneration. Biol Chem 393:589–594. [DOI] [PMC free article] [PubMed] [Google Scholar]
- 55. Sisodiya SM, Thom M, Lin WR, Bajaj NP, Cross JH, Harding BN (2002) Abnormal expression of CDK5 in focal cortical dysplasia in humans. Neurosci Lett 328:217–220. [DOI] [PubMed] [Google Scholar]
- 56. Spangle JM, Munger K (2010) The human papillomavirus type 16 E6 oncoprotein activates mTORC1 signaling and increases protein synthesis. J Virol 84:9398–9407. [DOI] [PMC free article] [PubMed] [Google Scholar]
- 57. Tam SJ, Richmond DL, Kaminker JS, Modrusan Z, Martin‐McNulty B, Cao TC et al (2012) Death receptors DR6 and TROY regulate brain vascular development. Dev Cell 22:403–417. [DOI] [PubMed] [Google Scholar]
- 58. Thom M, Martinian L, Sen A, Cross JH, Harding BN, Sisodiya SM (2005) Cortical neuronal densities and lamination in focal cortical dysplasia. Acta Neuropathol 110:383–392. [DOI] [PubMed] [Google Scholar]
- 59. Thom M, Liu JY, Thompson P, Phadke R, Narkiewicz M, Martinian L et al (2011) Neurofibrillary tangle pathology and Braak staging in chronic epilepsy in relation to traumatic brain injury and hippocampal sclerosis: a post‐mortem study. Brain 134(Pt 10):2969–2981. [DOI] [PMC free article] [PubMed] [Google Scholar]
- 60. Toering ST, Boer K, de Groot M, Troost D, Heimans JJ, Spliet WG et al (2009) Expression patterns of synaptic vesicle protein 2A in focal cortical dysplasia and TSC‐cortical tubers. Epilepsia 50:1409–1418. [DOI] [PubMed] [Google Scholar]
- 61. van der Loos CM (2008) Multiple immunoenzyme staining: methods and visualizations for the observation with spectral imaging. J Histochem Cytochem 56:313–328. [DOI] [PMC free article] [PubMed] [Google Scholar]
- 62. van Veelen CW, Debets RM, van Huffelen AC, de Boas W, Binnie CD, Storm van Leeuwen W et al (1990) Combined use of subdural and intracerebral electrodes in preoperative evaluation of epilepsy. Neurosurgery 26:93–101. [DOI] [PubMed] [Google Scholar]
- 63. Vohra BP, Sasaki Y, Miller BR, Chang J, DiAntonio A, Milbrandt J (2010) Amyloid precursor protein cleavage‐dependent and ‐independent axonal degeneration programs share a common nicotinamide mononucleotide adenylyltransferase 1‐sensitive pathway. J Neurosci 30:13729–13738. [DOI] [PMC free article] [PubMed] [Google Scholar]
- 64. Wang IF, Guo BS, Liu YC, Wu CC, Yang CH, Tsai KJ, Shen CK (2012) Autophagy activators rescue and alleviate pathogenesis of a mouse model with proteinopathies of the TAR DNA‐binding protein 43. Proc Natl Acad Sci U S A 109:15024–15029. [DOI] [PMC free article] [PubMed] [Google Scholar]
- 65. Wang IF, Tsai KJ, Shen CK (2012) Autophagy activation ameliorates neuronal pathogenesis of FTLD‐U mice: a new light for treatment of TARDBP/TDP‐43 proteinopathies. Autophagy 9:239–240. [DOI] [PMC free article] [PubMed] [Google Scholar]
- 66. Westmark CJ, Westmark PR, Beard AM, Hildebrandt SM, Malter JS (2008) Seizure susceptibility and mortality in mice that over‐express amyloid precursor protein. Int J Clin Exp Pathol 1:157–168. [PMC free article] [PubMed] [Google Scholar]
- 67. Westmark CJ, Westmark PR, Malter JS (2010) Alzheimer's disease and Down syndrome rodent models exhibit audiogenic seizures. J Alzheimers Dis 20:1009–1013. [DOI] [PMC free article] [PubMed] [Google Scholar]
- 68. Zeng L, Li T, Xu DC, Liu J, Mao G, Cui MZ et al (2012) Death receptor 6 induces apoptosis not through type I or type II pathways, but via a unique mitochondria‐dependent pathway by interacting with bax protein. J Biol Chem 287:29125–29133. [DOI] [PMC free article] [PubMed] [Google Scholar]
- 69. Zhou X, Ikenoue T, Chen X, Li L, Inoki K, Guan KL (2009) Rheb controls misfolded protein metabolism by inhibiting aggresome formation and autophagy. Proc Natl Acad Sci U S A 106:8923–8928. [DOI] [PMC free article] [PubMed] [Google Scholar]
Associated Data
This section collects any data citations, data availability statements, or supplementary materials included in this article.
Supplementary Materials
Figure S1. Distribution of terminal deoxynucleotidyl transferase‐mediated 2′‐deoxyuridine 5′‐triphosphate nick‐end labeling (TUNEL) (A), caspase‐3 (B) and caspase‐6 (C) labeling scores (total score; see for details Methods section) in astrocytes and neurons in control cortex, epilepsy control [no malformations of cortical development (MCD)], focal cortical dysplasia (FCD) I and FCD II and tuberous sclerosis complex (TSC).