

Abstract
Mitochondrial dysfunction (MtD) and abnormal brain bioenergetics have been implicated in autism, suggesting possible candidate genes in the electron transport chain (ETC). We compared the expression of 84 ETC genes in the post‐mortem brains of autism patients and controls. Brain tissues from the anterior cingulate gyrus, motor cortex, and thalamus of autism patients (n = 8) and controls (n = 10) were obtained from Autism Tissue Program, USA. Quantitative real‐time PCR arrays were used to quantify gene expression. We observed reduced expression of several ETC genes in autism brains compared to controls. Eleven genes of Complex I, five genes each of Complex III and Complex IV, and seven genes of Complex V showed brain region‐specific reduced expression in autism. ATP5A1 (Complex V), ATP5G3 (Complex V) and NDUFA5 (Complex I) showed consistently reduced expression in all the brain regions of autism patients. Upon silencing ATP5A1, the expression of mitogen‐activated protein kinase 13 (MAPK13), a p38 MAPK responsive to stress stimuli, was upregulated in HEK 293 cells. This could have been induced by oxidative stress due to impaired ATP synthesis. We report new candidate genes involved in abnormal brain bioenergetics in autism, supporting the hypothesis that mitochondria, critical for neurodevelopment, may play a role in autism.
Keywords: autism, electron transport complex, mitochondria, post‐mortem brain
Introduction
Autism is a complex pervasive developmental disorder characterized by deficiencies in social interaction and communication, and repetitive and stereotyped behaviors. It is heterogeneous and belongs to a group of neurodevelopmental disorders, collectively known as autism spectrum disorders (ASDs) that also include Asperger syndrome and pervasive developmental disorder‐not otherwise specified (PDD‐NOS). The abnormalities are usually identified in the early years of childhood. According to a recent report, the prevalence of ASD has risen to 1 in 110, with a male to female ratio of 4.5:1 51.
A plethora of evidence from biochemical 3, anatomical 30 and neuroimaging 26, 39 studies has implicated a disturbed brain bioenergetic metabolism in the pathogenesis of autism. Abnormal levels of biomarkers indicative of energy metabolism have been observed in autistic patients 3, 6, 26, 41. Magnetic resonance spectroscopy studies have shown in the brain of autism patients altered levels of metabolites relating to brain bioenergetics 14, 39.
Most of the adenosine triphosphate (ATP), the source of chemical energy in cells, is generated by mitochondria, which serve as the energy powerhouses of eukaryotic cells. Abnormal brain bioenergetics, therefore, indicates an involvement of mitochondrial dysfunction (MtD) in the pathogenesis of ASD 33. Furthermore, diminished levels of ATP have been observed in autistic brains 39.
In a systematic review and meta‐analysis, Rossignol and Frye 54 reported MtD in 5.0% of children with ASD. Comorbid features such as developmental regression, learning disabilities, mental retardation, seizures, motor delay, neurological problems and gastrointestinal abnormalities have been found to be significantly more prevalent in children with ASD/MtD as compared with the general ASD population 12, 53, 54. In addition, defective lymphocytic mitochondria have been observed in autistic children 26. Several studies have suggested that antioxidants (eg, coenzyme Q10) and/or nutritional supplements (eg, carnitine, vitamin B) could be beneficial in the treatment of a fraction of children with ASD/MtD 21, 63. Rats induced for MtD have been found to exhibit certain brain, behavioral and metabolic changes characteristic of ASD, such as microglial activation, reduced levels of glutathione, repetitive behaviors, social interaction deficits, hyperactivity and oxidative stress (OS) 34, 35, 57.
Mitochondrial energy production, which occurs through a process called oxidative phosphorylation, requires the action of various respiratory enzyme complexes termed as the electron transport chain (ETC) located in the inner mitochondrial membrane. There are five ETC complexes: (i) Complex I (NADH dehydrogenase); (ii) Complex II (succinate dehydrogenase), (iii) Complex III (cytochrome bc1 complex), (iv) Complex IV [cytochrome c oxidase (COX)]; and (v) Complex V (ATP synthase). In a recent study, Chauhan et al 12 observed brain region‐specific deficits in ETC complexes in autistic children. They had examined the protein expression of each ETC complex, but not the expression of individual proteins in each complex.
In the present study, we aimed at analyzing the expression of genes involved in each ETC complex. Using the post‐mortem brains of autistic patients and healthy controls, we compared the expression of 84 genes belonging to the five ETC complexes. The differential expression of ATP5A1, one of the downregulated genes in autism, was verified at the protein level. Furthermore, we silenced ATP5A1 and studied its effect on the expression of its interacting proteins in HEK 293 cells.
Materials and Methods
This study was approved by the Ethics Committee of Hamamatsu University School of Medicine.
Gene expression studies of human post‐mortem brains
Post‐mortem brain tissues
Post‐mortem brain samples of autism patients and healthy controls were provided by Autism Tissue Program (Princeton, NJ, USA; http://www.autismtissueprogram.org), NICHD Brain and Tissue Bank for Developmental Disorders (NICHD BTB; Baltimore, MD, USA; http://medschool.umaryland.edu/btbank/), and Harvard Brain Tissue Resource Center (HBTRC; Belmont, MA, USA; http://www.brainbank.mclean.org/). Frozen tissue samples from the following brain regions were used in the study: (i) anterior cingulate gyrus (ACG); (ii) motor cortex (MC); and (iii) thalamus (THL). Demographic characteristics of the samples (ACG: 8 autism, 9 controls; MC: 7 autism, 8 controls; THL: 8 autism, 8 controls) are described in Table 1.
Table 1.
Post‐mortem brain tissue information. Abbreviations: PMI = post‐mortem interval; NA = not available; M = male; F = female; ACG = anterior cingulate gyrus; MC = motor cortex; THL = thalamus
| Sample ID* | Diagnosis | Age (years) | Gender | PMI (hours) | Race | Cause of death | Brain regions† |
|---|---|---|---|---|---|---|---|
| 1065 | Control | 15 | M | 12 | Caucasian | Multiple injuries | ACG, THL |
| 1297 | Control | 15 | M | 16 | African American | Multiple injuries | ACG, MC, THL |
| 1407 | Control | 9 | F | 20 | African American | Asthma | ACG, MC, THL |
| 1541 | Control | 20 | F | 19 | Caucasian | Head injuries | ACG, MC, THL |
| 1649 | Control | 20 | M | 22 | Hispanic | Multiple injuries | ACG, MC, THL |
| 1708 | Control | 8 | F | 20 | African American | Asphyxia, multiple injuries | ACG, MC, THL |
| 1790 | Control | 13 | M | 18 | Caucasian | Multiple injuries | ACG |
| 1793 | Control | 11 | M | 19 | African American | Drowning | ACG, MC, THL |
| 1860 | Control | 8 | M | 5 | Caucasian | Cardiac arrhythmia | ACG |
| 4543 | Control | 28 | M | 13 | Caucasian | Multiple injuries | MC, THL |
| 4722 | Control | 14 | M | 16 | Caucasian | Multiple injuries | MC |
| 797 | Autism | 9 | M | 13 | Caucasian | Drowning | ACG, THL |
| 1638 | Autism | 20 | F | 50 | Caucasian | Seizure | ACG, MC, THL |
| 4231 | Autism | 8 | M | 12 | African American | Drowning | ACG, MC, THL |
| 4721 | Autism | 8 | M | 16 | African American | Drowning | ACG, MC, THL |
| 4899 | Autism | 14 | M | 9 | Caucasian | Drowning | ACG, MC, THL |
| 5000 | Autism | 27 | M | 8.3 | NA | NA | ACG, MC, THL |
| 6294 | Autism | 16 | M | NA | NA | NA | ACG, MC, THL |
| 6640 | Autism | 29 | F | 17.83 | NA | NA | ACG, MC, THL |
*Autism Tissue Program identifier.
†Brain regions for which each sample was available.
The differences in age and post‐mortem interval (PMI) between the autism and control groups were examined by t‐test. Fisher's exact test was used to examine the differences in sex distribution between the two groups (Table 2).
Table 2.
Demographic characteristics of post‐mortem brain samples. Abbreviations: SD = standard deviation; ACG = anterior cingulate gyrus; MC = motor cortex; THL = thalamus; M = male; F = female
| Brain region | Age (mean ± SD) | Post‐mortem interval (mean ± SD) | Gender | ||||||
|---|---|---|---|---|---|---|---|---|---|
| Control | Autism | P‐value* | Control | Autism | P‐value* | Control | Autism | P‐value† | |
| ACG | 13.22 ± 4.68 | 16.38 ± 8.33 | 0.344 | 16.78 ± 5.26 | 18.02 ± 14.52 | 0.815 | 6M, 3F | 6M, 2F | 1.000 |
| MC | 15.63 ± 6.74 | 17.43 ± 8.40 | 0.652 | 18.13 ± 2.90 | 18.86 ± 15.71 | 0.899 | 5M, 3F | 5M, 2F | 1.000 |
| THL | 15.75 ± 6.71 | 16.38 ± 8.33 | 0.871 | 17.63 ± 3.58 | 18.02 ± 14.52 | 0.942 | 5M, 3F | 6M, 2F | 1.000 |
*t‐test.
†Fisher's exact test (two sided).
RNA extraction
The brain tissues were homogenized by ultrasonication, and total RNA was extracted using TRIzol Reagent (Invitrogen, Carlsbad, CA, USA), in accordance with the manufacturer's protocol. The RNA samples were further purified using RNeasy Micro Kit (QIAGEN GmbH, Hilden, Germany), following the manufacturer's instructions. The quantity (absorbance at 260 nm) and quality (ratio of absorbance at 260 and 280 nm) of RNA were estimated with a NanoDrop ND‐1000 Spectrophotometer (Scrum, Tokyo, Japan). As per the requirements for the subsequent array experiment, the following criteria were met for all of the RNA samples: (i) A260:A230 ratio, >1.7; (ii) A260:A280 ratio, between 1.8 and 2.0; and (iii) concentration of total RNA, >40 ng/μL.
First‐strand cDNA synthesis
First‐strand cDNA was synthesized from 500 ng of total RNA using the RT2 First Strand Kit (SABiosciences, Frederick, MD, USA), following the manufacturer's protocol. The kit contains an effective genomic DNA elimination step and a built‐in external RNA control that helps monitor reverse transcription efficiency, and tests for contaminating inhibitors during the quantitative PCR (qPCR).
Real‐time qPCR
The Human Mitochondrial Energy Metabolism RT2 ProfilerTM PCR Array (SABiosciences) was used for quantifying the expression of 84 ETC genes in post‐mortem brain samples. In addition to the 84 genes, the array has five reference genes [beta‐2‐microglobulin (B2M), hypoxanthine phosphoribosyltransferase 1 (HPRT1), ribosomal protein L13a (RPL13A), glyceraldehyde‐3‐phosphate dehydrogenase (GAPDH) and actin beta (ACTB)], three reverse transcription controls (RTCs), three positive PCR controls (PPCs) and one genomic DNA control (GDC) making up to a total number of 96 assays. The details of the genes in the array are provided in Supporting Information Tables S1 and S2. The 384‐well format array includes four replicates of each of the 96 assays. The array makes use of SYBR Green method of quantitative real‐time PCR analysis. PCR reactions were carried out according to the manufacturer's protocol in ABI PRISM 7900HT SDS [Applied Biosystems (ABI), Foster City, CA, USA].
Data analysis
The threshold cycle (Ct) values obtained from qPCR were analyzed by the ΔΔCt method using the Microsoft Excel‐based program RT2 Profiler PCR Array Data Analysis (SABiosciences). It calculates: (i) ΔCt of each gene = Ct of gene of interest (GOI)—average Ct of chosen reference genes; (ii) ΔΔCt for each gene across two groups; ΔΔCt = ΔCt autism group—ΔCt control group; and (iii) fold change for each gene from control group to autism group as 2 ∧ (‐ΔΔCt). Based on Kolmogorov–Smirnov test, the expression of all genes was found to follow a normal distribution. Therefore, t‐test, which was also the default option in our data analysis program, was used to examine the significance of difference in gene expression between control and autism groups.
The statistical program performs the following functions also: (i) interprets all Ct values ≥ 35 as a negative call; (ii) examines genomic DNA contamination in the samples based on the Ct of GDC; Ct <35 indicates genomic DNA contamination; (iii) examines the presence of impurities in RNA samples based on the Ct value of PPC; Ct should be 20 ± 2 on each array, and should not vary by more than two cycles between the arrays being compared; and (iv) interprets any inhibition of reverse transcription based on the Ct values of RTC and PPC; ΔCt (Ct RTC‐Ct PPC) < 5 indicates that there is no apparent inhibition.
Western blot analysis
By using Western blot analysis, we examined any differential expression of ATP5A1 protein in the ACG of autism patients (n = 8) compared to controls (n = 9). The brain samples were homogenized in RIPA Buffer (Sigma‐Aldrich, Tokyo, Japan). The total protein in the lysate was quantified using Pierce BCA Protein Assay Kit (Thermo Scientific, Rockford, IL, USA). A total of 10 μg of each sample was separated on 7.5% sodium dodecylsulfate/polyacrylamide gel electrophoresis (SDS/PAGE). The separated proteins were electroblotted onto a PVDF membrane (Millipore, Billerica, MA, USA), blocked and incubated with the primary antibody at 4°C overnight. The primary antibodies used were: (i) anti‐ATP5A (ab14748, abcam, Tokyo, Japan) at 1:1000 dilution for the detection of ATP5A1; and (ii) anti‐GAPDH (ab9484, abcam) at 1:5000 dilution for the detection of GAPDH, which was used as the loading control. Following primary antibody incubation, the blots were washed and incubated with 1:15 000 diluted IRDye 700 DX conjugated secondary antibody (610‐730‐124, Rockland, Gilbertsville, PA, USA). The blots were scanned in Odyssey Infrared Imaging System (LI‐COR Biosciences, Lincoln, NE, USA). Using the Grid tool of Odyssey Analysis software v2.1 (LI‐COR), the trimmed mean signal intensities of protein bands were quantified. The signal intensity of ATP5A1 was normalized against that of GAPDH. The difference in protein expression between the control and autism groups was estimated by t‐test.
Suitable antibodies against ATP5G3 and NDUFA5 were unavailable.
Protein‐interacting partners of ATP5A1
Proteins interacting with ATP5A1 were identified from the data available in Human Protein Reference Database (HPRD; http://www.hprd.org/), BioGRID (http://thebiogrid.org/) and IntAct (http://www.ebi.ac.uk/intact/). From among the several proteins listed, four were selected as they were predicted as interacting proteins of ATP5A1 by at least two of the aforementioned programs. These include p38 mitogen‐activated protein kinase 13 (MAPK13), 14‐3‐3 beta (YWHAB), 14‐3‐3 gamma (YWHAG) and 14‐3‐3 zeta (YWHAZ). In addition, three other p38 mitogen‐activated protein kinases, MAPK11, MAPK12 and MAPK14, were also included in the study.
Silencing of ATP5A1 by RNA interference (RNAi)
Cell culture
HEK 293 cells were grown at 37°C, with 5% CO2 in Dulbecco's modified Eagle's medium—low glucose (DMEM; Sigma‐Aldrich) supplemented with 10% fetal bovine serum (FBS; Invitrogen).
Silencing of ATP5A1 by RNAi
HEK 293 cells, at 30% confluency, were transfected with s1767, an ATP5A1‐specific small interfering RNA (siRNA; Silencer Select Predesigned and Validated siRNAs, ABI), using Lipofectamine 2000 (Invitrogen), following the manufacturer's protocol. Transfection with 200 pmol of s1767 resulted in 86% silencing of ATP5A1 with minimal cytotoxicity, when grown for 48 h.
The effect of ATP5A1 silencing on the gene expression of its interacting proteins (MAPK11, MAPK12, MAPK13, MAPK14, YWHAB, YWHAG and YWHAZ) was determined by comparing their gene expression between s1767‐transfected cells (five replicates) and negative control siRNA (Silencer Select Negative Control #1 siRNA, ABI)‐transfected cells (five replicates) by qPCR method.
RNA extraction was carried out in accordance with the protocol in Section 2.1.2. First‐strand cDNA was synthesized from total RNA with oligo(dT) primer, using the ImProm‐II Reverse Transcription System (Promega, Madison, WI, USA), following the manufacturer's protocol. Real‐time qPCR analysis was performed by TaqMan method in ABI PRISM 7900 Sequence Detection System (ABI). TaqMan primer/probes for the GOI (ATP5A1: Hs00900735_m1; MAPK13: Hs00559623_m1; YWHAB: Hs00793604_m1; YWHAG: Hs00705917_s1; YWHAZ: Hs03044281_g1) and for the reference gene, GAPDH (Predeveloped TaqMan Assay Reagent) were purchased from ABI. All reactions were performed in duplicate, according to the manufacturer's protocol. CT, which reflects the mRNA expression levels, was determined, and the CT of the GOI of each sample was normalized to the corresponding CT for GAPDH, by calculating ΔCT (ΔCT = GOI CT − GAPDH CT), to obtain the relative mRNA expression of the GOI. Quantification of the expression of the GOI was calculated as ΔΔCT (ΔΔCT = ΔCT ATP5A1 RNAi − ΔCT negative control RNAi). The fold change in gene expression between the two groups was determined by calculating 2‐ΔΔC T. Any significant difference in the expression of the GOI between autism and control groups was assessed by t‐test.
Results
Gene expression studies of human post‐mortem brains
In the qPCR experiment, the Ct of GDC was >35 for all the samples, indicating that genomic DNA contamination, if any, was too low to affect the gene expression results. The Ct of PPC was 20 ± 2 for all the arrays, showing the apparent absence of impurities in the RNA samples. There was also no indication of any inhibition of reverse transcription reaction, as ΔCt (Ct RTC‐Ct PPC) was <5 for all the samples. Reference genes for normalization of gene expression were chosen separately for each of the brain regions, such that the selected genes did not show any significant difference in expression between the control and autism groups. The reference genes selected for the various brain regions were: (i) RPL13A, GAPDH and ACTB for ACG; (ii) B2M, RPL13A, GAPDH and ACTB for MC; and (iii) B2M, RPL13A, GAPDH and ACTB for THL.
There was no significant difference in age, PMI or sex distribution between the control and autism groups in any of the brain regions (Table 2). We observed reduced expression of several ETC genes in the autism group compared to the control group (Table 3). Eleven genes belonging to Complex I, five genes each belonging to Complex III and Complex IV, and seven genes belonging to Complex V showed reduced expression in the various brain regions of autism patients. There was no significant alteration in the expression of Complex II genes between the control and autism groups. Overall, the expression of 11 ETC genes in ACG, 12 genes in MC and 19 genes in THL was downregulated in autism patients. However, none of the P‐values withstood multimarker testing (conventional Bonferroni approach). The expression of ATP5A1 (Complex V), ATP5G3 (Complex V) and NDUFA5 (Complex I) was reduced in all the three brain regions of autism patients.
Table 3.
Genes with altered expressions in autism post‐mortem brains
| Gene | Anterior cingulate gyrus | Motor cortex | Thalamus | |||
|---|---|---|---|---|---|---|
| Fold difference | P‐value* | Fold difference | P‐value* | Fold difference | P‐value* | |
| ATP5A1 ** | −1.753 | 0.034 | −1.762 | 0.045 | −1.857 | 0.031 |
| ATP5B ** | −1.939 | 0.038 | ||||
| ATP5F1 ** | −2.326 | 0.022 | −1.672 | 0.036 | ||
| ATP5G3 ** | −2.378 | 0.022 | −2.941 | 0.015 | −2.637 | 0.007 |
| ATP5H ** | −4.476 | 0.044 | ||||
| ATP5J ** | −1.742 | 0.016 | ||||
| ATP6V0A2 ** | −1.733 | 0.009 | ||||
| COX5A ¶ | −1.664 | 0.043 | ||||
| COX6A1 ¶ | −1.677 | 0.018 | −1.469 | 0.043 | ||
| COX7A2 ¶ | −1.662 | 0.042 | ||||
| COX7B ¶ | −1.521 | 0.036 | ||||
| COX8A ¶ | −1.467 | 0.049 | ||||
| CYC1 § | −1.586 | 0.045 | ||||
| NDUFA2 † | −1.635 | 0.009 | ||||
| NDUFA4 † | −1.769 | 0.016 | −1.574 | 0.049 | ||
| NDUFA5 † | −1.800 | 0.037 | −2.168 | 0.005 | −1.885 | 0.028 |
| NDUFA8 † | −1.670 | 0.043 | −2.197 | 0.007 | ||
| NDUFAB1 † | −1.599 | 0.041 | −1.572 | 0.038 | ||
| NDUFB3 † | −1.823 | 0.017 | ||||
| NDUFB4 † | −1.710 | 0.018 | ||||
| NDUFB5 † | −2.133 | 0.017 | −1.792 | 0.015 | ||
| NDUFB6 † | −1.996 | 0.022 | ||||
| NDUFS2 † | −1.554 | 0.043 | ||||
| NDUFS4 † | −1.466 | 0.026 | ||||
| UQCRC1 § | −2.128 | 0.014 | ||||
| UQCRC2 § | −1.490 | 0.045 | ||||
| UQCRFS1 § | −1.819 | 0.049 | −1.706 | 0.030 | ||
| UQCRH § | −1.621 | 0.047 | −1.902 | 0.034 | ||
*t‐test.
†Complex I (NADH‐coenzyme Q reductase).
§Complex III (coenzyme Q‐cytochrome c reductase).
¶Complex IV (cytochrome c oxidase).
**Complex V (ATP synthase).
Western blot analysis
We compared the protein expression of ATP5A1 in the ACG of autism patients and control subjects. In concordance with mRNA levels, ATP5A1 expression was found to be reduced in autism patients compared to the controls (P = 0.041) (Figure 1). The expression of ATP5A1 in MC and THL could not be examined due to the unavailability of sufficient tissue samples.
Figure 1.
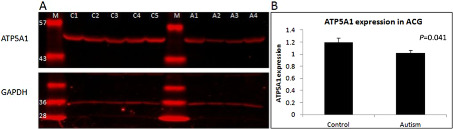
Comparison of the protein expression of ATP5A1 in the anterior cingulate gyrus (ACG) of autism patients and healthy controls. A. Representative gel showing the protein levels of ATP5A1 (55 kDa) and of the loading control GAPDH (36 kDa) in control and autism brains. C1–C5: control samples; A1–A4: autism samples; M: molecular weight marker (molecular weight in kDa is given along the left side of each band). B. ATP5A1 expression was significantly reduced in autism brains compared to controls (P = 0.041). y‐axis of the graph represents the relative expression of ATP5A1 normalized to GAPDH.
Effect of ATP5A1 silencing on the gene expression of its interacting proteins
The gene expression of ATP5A1‐interacting proteins (MAPK11, MAPK12, MAPK13, MAPK14, YWHAB, YWHAG and YWHAZ) was compared in ATP5A1‐silenced HEK 293 cells and control cells. The expression of MAPK13, a stress‐activated p38 MAPK, was found to be significantly higher in the ATP5A1‐silenced cells compared to the negative control (P = 0.018) (Figure 2). There was no significant difference in the expression of other proteins between ATP5A1‐silenced cells and control cells.
Figure 2.
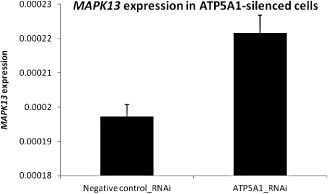
Comparison of MAPK13 expression in ATP5A1‐silenced and negative control siRNA‐transfected HEK 293 cells. The expression of MAPK13 was found to be significantly higher in the ATP5A1‐silenced cells compared to the negative controls (P = 0.018). y‐axis of the graph represents the relative expression of MAPK13 normalized to GAPDH.
Discussion
We report brain‐region specific decrease in the expression of mitochondrial ETC genes in autism. This is the first comprehensive study evaluating the expression of individual ETC genes in autism brain. Previously, defects of ETC complexes had been reported in the muscle biopsies 49, buccal swabs 21 and lymphocytes 26 of autism patients. Recently, Chauhan et al 12 observed reduced levels of Complexes III and V in the cerebellum, of Complex I in the frontal cortex, and of Complexes II and III in the temporal cortex of autistic children. In concordance with this, we observed brain region‐specific downregulation of ETC genes belonging to Complexes I, III, IV and V in autism.
The expression of ETC genes was analyzed in the ACG, MC and THL. The ACG has been found to be involved in emotion formation and processing, learning and memory 9, 61, the MC in planning, control and execution of voluntary motor functions 20, and the THL in the processing and relaying of sensory information 38. Abnormalities of the anterior cingulate have been implicated in impairments of cognitive control 2, social orientation 43, social target detection 17 and response monitoring 13, 62 in autism. Defects of the MC, such as increased white matter volume, have been observed in autism 42, 58. Reduced thalamic volume has been reported in autistic individuals 19, 64, and the impairments of auditory, tactile and visual stimuli processing have been attributed to THL abnormalities 40.
In the ACG, MC and THL, the expression of NDUFA5 (Complex I), ATP5A1 (Complex V) and ATP5G3 (Complex V) was consistently reduced in autism patients. These genes are vital constituents of the ETC. NDUFA5, a component of NADH dehydrogenase (Complex I), is involved in building up the electrochemical potential required to produce ATP. A recently report shows suggestive evidence for the association of NDUFA5 with autism 37. ATP5A1 and ATP5G3 are components of ATP synthase, which produces energy via ATP synthesis.
We observed, in addition to NDUFA5, reduced expression of several Complex I genes in autism. Reduction of Complex I has been found to increase OS by contributing to the production of free radicals 5, 28. Chauhan et al 12 observed downregulation of Complex II (succinate dehydrogenase) in the temporal cortex of autistic children. While we did not examine gene expression in the temporal cortex, we could not find altered expression of Complex II genes in the ACG, MC or THL of autism patients. Several genes in cytochrome bc1 complex, the third complex in ETC, showed reduced expression in autism. Defects of Complex III could be involved in the generation of reactive oxygen species (ROS), leading to neuronal cell death 29. Several genes belonging to Complex IV (COX) were downregulated in autism. Defects in COX can result in severe, often fatal metabolic disorders, which usually manifest in early childhood, predominantly in tissues with high energy demands such as brain 33, 48. We found, in addition to ATP5A1 and ATP5G3, decreased expression of several Complex V (ATP synthase) genes in autism. Low levels of ATP observed in the brain 39 and plasma 1 of autism patients could be attributed to the reduced expression of genes contributing to ATP synthesis.
While in their previous study Chauhan et al 12 observed ETC defects in autistic children aged 4–10 years, deficits were not observed in adults (14–39 years). It was suggested that the deficits observed in autistic children might readjust to normal levels in adulthood. However, among the 19 samples in our study, only 6 were of >10 years of age. Our results suggest that ETC deficits might persist into adulthood.
The exact mechanism by which MtD contributes to the etiology of autism is not clear. ATP produced via oxidative phosphorylation in the mitochondria is essential for sustaining electrophysiological activity, cell signaling and structural integrity of brain 7, 18, 52. A minor proportion of oxygen involved in oxidative phosphorylation may be used up for generating ROS 60. Generation of ROS occurs mainly at Complex III 30, with a little contribution from Complex I 5, 28. Defective ETC could increase OS in the brain 12. Increasing evidence suggests a role for OS in the development and clinical manifestation of autism 10, 11, 27, 68. The brain is highly vulnerable to OS due to its limited antioxidant capacity and higher energy requirements 4. As mitochondria are localized in the synapses, MtD could adversely affect synaptic transmission. ETC defects, if occurring during critical developmental stages, could damage the neuronal and glial cells in the brain, leading to neuroinflammation, excitotoxicity, impairments of neural circuit connectivity and plasticity, and/or abnormalities in neurodevelopment 65. This might underlie the cognitive, language and behavioral deficits observed in autism.
OS is known to activate stress signaling pathways, thereby inducing apoptosis in a variety of cell types. Intracellular cell death signaling cascade involving p38 MAPKs is one such pathway activated by OS 36, 44. Upon silencing ATP5A1 in HEK 293 cells, the expression of MAPK13, a p38 MAPK, was found to be increased. MAPK13 is one of the four p38 MAPKs that play an important role in the cascades of cellular responses evoked by extracellular stress stimuli. The upregulated expression of MAPK13 could have been induced by the OS resulting from downregulated expression of ATP5A1. Further research into the mechanisms of stress and apoptosis pathways stimulated by impaired ATP synthesis is warranted.
It is a matter of debate whether MtD is primary or secondary to autism. Converging evidence suggests an association between ASD and MtD 22, 23, 63, with special emphasis on the impairment of mitochondrial energy metabolism 34. ASD patients have often been found to manifest biochemical or neuropathological traits linked with altered mitochondrial function 3, 6, 14, 15, 24, 31, 39, 41, 46. As MtD often results in central nervous system dysfunction, leading to cognitive and behavioral abnormalities, ASD could be an important clinical presentation of MtD 45. However, the clinical features, and the biochemical and genetic abnormalities in ASD patients with an underlying MtD have been heterogeneous. In addition, several of the biochemical abnormalities occur in the absence of any genetic alterations directly impacting vital mitochondrial functions 47. On the contrary, MtD might also occur as secondary to other pathophysiological processes involved in autism such as immune dysregulation, OS and altered calcium homeostasis 47. Even though it is possible that a greater proportion of individuals with ASD might have MtD at the genetic level, it may not be manifested clinically.
Factors inherent in post‐mortem brain studies, and beyond the investigator's control, might have influenced our results. We did not have sufficient data regarding brain pH. However, large‐scale gene analysis showed that brain pH or PMI has no significant correlation with RNA integrity 8, 50. pH could be lower in the post‐mortem brains of individuals who suffered prolonged agonal states, such as in respiratory arrest, multi‐organ failure and coma 32. However, the cause of death was sudden for most of the subjects included in our study (Table 1). So, we assume that brain pH is unlikely to have affected gene expression. The other concern is the effect of medication, as several drugs such as antidepressants, antipsychotics and selective serotonin reuptake inhibitors are known to inhibit oxidative phosphorylation 16, 55, 66. In this study, information regarding medication (drug doses unknown) was available for only three autism patients, two of whom had received more than two classes of drugs. Therefore, it was difficult to examine the effects of medication on gene expression. Nevertheless, concordant results (not shown) were obtained when these three samples were excluded from the analysis. Another matter of concern is that the cause of death for a majority of the autism patients was drowning, a hypoxic event. Hypoxia is generally known to downregulate the expression and activity of ETC 59; however, it is also reported to rapidly increase mitochondrial biogenesis 25, 67 along with an increased expression of the respiratory enzyme COXIV 67. Delayed susceptibility of brain mitochondria to prolonged hypoxia has also been observed 56. These are considered as an endogenous neuroprotective response of the brain. Therefore, it is unlikely that hypoxia influenced our results significantly. Moreover, reduced expression of ETC complexes has already been reported in autistic children in a study 12 in which the number of deaths due to drowning was similar for autism (n = 3) and control (n = 2) groups. Our results are in accordance with this study.
Because of the availability of potential treatment options for MtD, investigation into the early detection methodologies of MtD could turn out to be useful in autism treatment. If detected in early stages, treatment strategies aimed at reducing its impact may be adopted.
Conflict of interest
None.
Supporting information
Table S1. Details of the genes included in Human Mitochondrial Energy Metabolism PCR Array
Table S2. Functional groupings of the 84 electron transport complex genes included in Human Mitochondrial Energy Metabolism PCR Array
Acknowledgments
We thank Dr Jane Pickett, Director of Brain Resources and Data, Autism Tissue Program, for facilitating brain tissue collection. Human tissue was obtained from the NICHD Brain and Tissue Bank for Developmental Disorders at the University of Maryland, Baltimore, Maryland. Tissue samples were also provided by the Harvard Brain Tissue Resource Center, which is supported in part by PHS Grant No. R 24 MH 068855. This work was supported by Grants‐in‐Aid for Scientific Research from the Ministry of Education, Culture, Sports, Science, and Technology of Japan (23591700 to AA and 23390288 to KN). We thank Tae Takahashi and Mika Oyaizu for technical assistance.
References
- 1. Adams JB, Audhya T, McDonough‐Means S, Rubin RA, Quig D, Geis E et al (2011) Nutritional and metabolic status of children with autism vs. neurotypical children, and the association with autism severity. Nutr Metab (Lond) 8:34. [DOI] [PMC free article] [PubMed] [Google Scholar]
- 2. Agam Y, Joseph RM, Barton JJ, Manoach DS (2010) Reduced cognitive control of response inhibition by the anterior cingulate cortex in autism spectrum disorders. Neuroimage 52:336–347. [DOI] [PMC free article] [PubMed] [Google Scholar]
- 3. Al‐Mosalem OA, El‐Ansary A, Attas O, Al‐Ayadhi L (2009) Metabolic biomarkers related to energy metabolism in Saudi autistic children. Clin Biochem 42:949–957. [DOI] [PubMed] [Google Scholar]
- 4. Ames A 3rd (2000) CNS energy metabolism as related to function. Brain Res Brain Res Rev 34:42–68. [DOI] [PubMed] [Google Scholar]
- 5. Andreazza AC, Shao L, Wang JF, Young LT (2010) Mitochondrial complex I activity and oxidative damage to mitochondrial proteins in the prefrontal cortex of patients with bipolar disorder. Arch Gen Psychiatry 67:360–368. [DOI] [PubMed] [Google Scholar]
- 6. Arnold GL, Hyman SL, Mooney RA, Kirby RS (2003) Plasma amino acids profiles in children with autism: potential risk of nutritional deficiencies. J Autism Dev Disord 33:449–454. [DOI] [PubMed] [Google Scholar]
- 7. Attwell D, Laughlin SB (2001) An energy budget for signaling in the grey matter of the brain. J Cereb Blood Flow Metab 21:1133–1145. [DOI] [PubMed] [Google Scholar]
- 8. Barton AJ, Pearson RC, Najlerahim A, Harrison PJ (1993) Pre‐ and postmortem influences on brain RNA. J Neurochem 61:1–11. [DOI] [PubMed] [Google Scholar]
- 9. Bush G, Luu P, Posner MI (2000) Cognitive and emotional influences in anterior cingulate cortex. Trends Cogn Sci 4:215–222. [DOI] [PubMed] [Google Scholar]
- 10. Chauhan A, Chauhan V (2006) Oxidative stress in autism. Pathophysiology 13:171–181. [DOI] [PubMed] [Google Scholar]
- 11. Chauhan A, Chauhan V, Brown WT, Cohen I (2004) Oxidative stress in autism: increased lipid peroxidation and reduced serum levels of ceruloplasmin and transferrin—the antioxidant proteins. Life Sci 75:2539–2549. [DOI] [PubMed] [Google Scholar]
- 12. Chauhan A, Gu F, Essa MM, Wegiel J, Kaur K, Brown WT et al (2011) Brain region‐specific deficit in mitochondrial electron transport chain complexes in children with autism. J Neurochem 117:209–220. [DOI] [PMC free article] [PubMed] [Google Scholar]
- 13. Chiu PH, Kayali MA, Kishida KT, Tomlin D, Klinger LG, Klinger MR et al (2008) Self responses along cingulate cortex reveal quantitative neural phenotype for high‐functioning autism. Neuron 57:463–473. [DOI] [PMC free article] [PubMed] [Google Scholar]
- 14. Chugani DC, Sundram BS, Behen M, Lee ML, Moore GJ (1999) Evidence of altered energy metabolism in autistic children. Prog Neuropsychopharmacol Biol Psychiatry 23:635–641. [DOI] [PubMed] [Google Scholar]
- 15. Correia C, Coutinho AM, Diogo L, Grazina M, Marques C, Miguel T et al (2006) Brief report: high frequency of biochemical markers for mitochondrial dysfunction in autism: no association with the mitochondrial aspartate/glutamate carrier SLC25A12 gene. J Autism Dev Disord 36:1137–1140. [DOI] [PubMed] [Google Scholar]
- 16. Curti C, Mingatto FE, Polizello AC, Galastri LO, Uyemura SA, Santos AC (1999) Fluoxetine interacts with the lipid bilayer of the inner membrane in isolated rat brain mitochondria, inhibiting electron transport and F1F0‐ATPase activity. Mol Cell Biochem 199:103–109. [DOI] [PubMed] [Google Scholar]
- 17. Dichter GS, Felder JN, Bodfish JW (2009) Autism is characterized by dorsal anterior cingulate hyperactivation during social target detection. Soc Cogn Affect Neurosci 4:215–226. [DOI] [PMC free article] [PubMed] [Google Scholar]
- 18. Du F, Zhu XH, Zhang Y, Friedman M, Zhang N, Ugurbil K et al (2008) Tightly coupled brain activity and cerebral ATP metabolic rate. Proc Natl Acad Sci U S A 105:6409–6414. [DOI] [PMC free article] [PubMed] [Google Scholar]
- 19. Egawa J, Watanabe Y, Kitamura H, Endo T, Tamura R, Hasegawa N et al (2011) Reduced thalamus volume in non‐right‐handed male patients with autism spectrum disorders. Psychiatry Clin Neurosci 65:395. [DOI] [PubMed] [Google Scholar]
- 20. Evarts EV (1981) Role of motor cortex in voluntary movements in primates. In: Handbook of Physiology‐The Nervous System, II, Brookhart JM, Mountcastle VB (eds), pp. 1083–1120. American Physiological Society: Maryland. [Google Scholar]
- 21. Ezugha H, Goldenthal M, Valencia I, Anderson CE, Legido A, Marks H (2010) 5q14.3 deletion manifesting as mitochondrial disease and autism: case report. J Child Neurol 25:1232–1235. [DOI] [PubMed] [Google Scholar]
- 22. Filipek PA, Juranek J, Smith M, Mays LZ, Ramos ER, Bocian M et al (2003) Mitochondrial dysfunction in autistic patients with 15q inverted duplication. Ann Neurol 53:801–804. [DOI] [PubMed] [Google Scholar]
- 23. Fillano JJ, Goldenthal MJ, Rhodes CH, Marin‐Garcia J (2002) Mitochondrial dysfunction in patients with hypotonia, epilepsy, autism, and developmental delay: HEADD syndrome. J Child Neurol 17:435–439. [DOI] [PubMed] [Google Scholar]
- 24. Giulivi C, Zhang YF, Omanska‐Klusek A, Ross‐Inta C, Wong S, Hertz‐Picciotto I et al (2010) Mitochondrial dysfunction in autism. JAMA 304:2389–2396. [DOI] [PMC free article] [PubMed] [Google Scholar]
- 25. Gutsaeva DR, Carraway MS, Suliman HB, Demchenko IT, Shitara H, Yonekawa H et al (2008) Transient hypoxia stimulates mitochondrial biogenesis in brain subcortex by a neuronal nitric oxide synthase‐dependent mechanism. J Neurosci 28:2015–2024. [DOI] [PMC free article] [PubMed] [Google Scholar]
- 26. Hazlett EA, Buchsbaum MS, Hsieh P, Haznedar MM, Platholi J, LiCalzi EM et al (2004) Regional glucose metabolism within cortical Brodmann areas in healthy individuals and autistic patients. Neuropsychobiology 49:115–125. [DOI] [PubMed] [Google Scholar]
- 27. James SJ, Cutler P, Melnyk S, Jernigan S, Janak L, Gaylor DW et al (2004) Metabolic biomarkers of increased oxidative stress and impaired methylation capacity in children with autism. Am J Clin Nutr 80:1611–1617. [DOI] [PubMed] [Google Scholar]
- 28. Jeong SY, Seol DW (2008) The role of mitochondria in apoptosis. BMB Rep 41:11–22. [DOI] [PubMed] [Google Scholar]
- 29. Kim SH, Vlkolinsky R, Cairns N, Lubec G (2000) Decreased levels of complex III core protein 1 and complex V beta chain in brains from patients with Alzheimer's disease and Down syndrome. Cell Mol Life Sci 57:1810–1816. [DOI] [PMC free article] [PubMed] [Google Scholar]
- 30. Kriaucionis S, Paterson A, Curtis J, Guy J, Macleod N, Bird A (2006) Gene expression analysis exposes mitochondrial abnormalities in a mouse model of Rett syndrome. Mol Cell Biol 26:5033–5042. [DOI] [PMC free article] [PubMed] [Google Scholar]
- 31. Laszlo A, Horvath E, Eck E, Fekete M (1994) Serum serotonin, lactate and pyruvate levels in infantile autistic children. Clin Chim Acta 229:205–207. [DOI] [PubMed] [Google Scholar]
- 32. Li JZ, Vawter MP, Walsh DM, Tomita H, Evans SJ, Choudary PV et al (2004) Systematic changes in gene expression in postmortem human brains associated with tissue pH and terminal medical conditions. Hum Mol Genet 13:609–616. [DOI] [PubMed] [Google Scholar]
- 33. Lombard J (1998) Autism: a mitochondrial disorder? Med Hypotheses 50:497–500. [DOI] [PubMed] [Google Scholar]
- 34. MacFabe DF, Cain DP, Rodriguez‐Capote K, Franklin AE, Hoffman JE, Boon F et al (2007) Neurobiological effects of intraventricular propionic acid in rats: possible role of short chain fatty acids on the pathogenesis and characteristics of autism spectrum disorders. Behav Brain Res 176:149–169. [DOI] [PubMed] [Google Scholar]
- 35. MacFabe DF, Rodriguez‐Captoe K, Hoffman JE, Franklin AE, Mohammed‐Asef Y, Taylor AR et al (2008) A novel rodent model of autism: intraventricular infusions of propionic acid increase locomotor activity and induce neuroinflammation and oxidative stress in discrete regions of adult rat brain. Am J Biochem Biotech 4:146–166. [Google Scholar]
- 36. Martindale JL, Holbrook NJ (2002) Cellular response to oxidative stress: signaling for suicide and survival. J Cell Physiol 192:1–15. [DOI] [PubMed] [Google Scholar]
- 37. Marui T, Funatogawa I, Koishi S, Yamamoto K, Matsumoto H, Hashimoto O et al (2011) The NADH‐ubiquinone oxidoreductase 1 alpha subcomplex 5 (NDUFA5) gene variants are associated with autism. Acta Psychiatr Scand 123:118–124. [DOI] [PubMed] [Google Scholar]
- 38. McCormick DA, Bal T (1994) Sensory gating mechanisms of the thalamus. Curr Opin Neurobiol 4:550–556. [DOI] [PubMed] [Google Scholar]
- 39. Minshew NJ, Goldstein G, Dombrowski SM, Panchalingam K, Pettegrew JW (1993) A preliminary 31P MRS study of autism: evidence for undersynthesis and increased degradation of brain membranes. Biol Psychiatry 33:762–773. [DOI] [PubMed] [Google Scholar]
- 40. Minshew NJ, Goldstein G, Siegel DJ (1997) Neuropsychologic functioning in autism: profile of a complex information processing disorder. J Int Neuropsychol Soc 3:303–316. [PubMed] [Google Scholar]
- 41. Mostafa GA, El‐Gamal HA, El‐Wakkad ASE, El‐Shorbagy OE, Hamza MM (2005) Polyunsaturated fatty acids, carnitine and lactate as biological markers of brain energy metabolism in autistic children. Int J Child Neuropsychiatry 2:179–188. [Google Scholar]
- 42. Mostofsky SH, Burgess MP, Gidley Larson JC (2007) Increased motor cortex white matter volume predicts motor impairment in autism. Brain 130:2117–2122. [DOI] [PubMed] [Google Scholar]
- 43. Mundy P (2003) Annotation: the neural basis of social impairments in autism: the role of the dorsal medial‐frontal cortex and anterior cingulate system. J Child Psychol Psychiatry 44:793–809. [DOI] [PubMed] [Google Scholar]
- 44. Naderi J, Hung M, Pandey S (2003) Oxidative stress‐induced apoptosis in dividing fibroblasts involves activation of p38 MAP kinase and over‐expression of Bax: resistance of quiescent cells to oxidative stress. Apoptosis 8:91–100. [DOI] [PubMed] [Google Scholar]
- 45. Nissenkorn A, Zeharia A, Lev D, Watemberg N, Fattal‐Valevski A, Barash V et al (2000) Neurologic presentations of mitochondrial disorders. J Child Neurol 15:44–48. [DOI] [PubMed] [Google Scholar]
- 46. Oliveira G, Diogo L, Grazina M, Garcia P, Ataide A, Marques C et al (2005) Mitochondrial dysfunction in autism spectrum disorders: a population‐based study. Dev Med Child Neurol 47:185–189. [DOI] [PubMed] [Google Scholar]
- 47. Palmieri L, Persico AM (2010) Mitochondrial dysfunction in autism spectrum disorders: cause or effect? Biochim Biophys Acta 1797:1130–1137. [DOI] [PubMed] [Google Scholar]
- 48. Pecina P, Houstkova H, Hansikova H, Zeman J, Houstek J (2004) Genetic defects of cytochrome c oxidase assembly. Physiol Res 53(Suppl. 1):S213–S223. [PubMed] [Google Scholar]
- 49. Poling JS, Frye RE, Shoffner J, Zimmerman AW (2006) Developmental regression and mitochondrial dysfunction in a child with autism. J Child Neurol 21:170–172. [DOI] [PMC free article] [PubMed] [Google Scholar]
- 50. Popova T, Mennerich D, Weith A, Quast K (2008) Effect of RNA quality on transcript intensity levels in microarray analysis of human post‐mortem brain tissues. BMC Genomics 9:91. [DOI] [PMC free article] [PubMed] [Google Scholar]
- 51. Rice C (2009) Prevalence of autism spectrum disorders—Autism and Developmental Disabilities Monitoring Network, United States 2006. MMWR Surveill Summ 58:1–20. [PubMed] [Google Scholar]
- 52. Rolfe DF, Brown GC (1997) Cellular energy utilization and molecular origin of standard metabolic rate in mammals. Physiol Rev 77:731–758. [DOI] [PubMed] [Google Scholar]
- 53. Rossignol DA, Bradstreet JJ (2008) Evidence of mitochondrial dysfunction in autism and implications for treatment. Am J Biochem Biotech 4:208–217. [Google Scholar]
- 54. Rossignol DA, Frye RE (2012) Mitochondrial dysfunction in autism spectrum disorders: a systematic review and meta‐analysis. Mol Psychiatry 17:290–314. [DOI] [PMC free article] [PubMed] [Google Scholar]
- 55. Rumbach L, Warter JM, Rendon A, Marescaux C, Micheletti G, Waksman A (1983) Inhibition of oxidative phosphorylation in hepatic and cerebral mitochondria of sodium valproate‐treated rats. J Neurol Sci 61:417–423. [DOI] [PubMed] [Google Scholar]
- 56. Schild L, Huppelsberg J, Kahlert S, Keilhoff G, Reiser G (2003) Brain mitochondria are primed by moderate Ca2+ rise upon hypoxia/reoxygenation for functional breakdown and morphological disintegration. J Biol Chem 278:25454–25460. [DOI] [PubMed] [Google Scholar]
- 57. Shultz SR, MacFabe DF, Ossenkopp KP, Scratch S, Whelan J, Taylor R et al (2008) Intracerebroventricular injection of propionic acid, an enteric bacterial metabolic end‐product, impairs social behavior in the rat: implications for an animal model of autism. Neuropharmacology 54:901–911. [DOI] [PubMed] [Google Scholar]
- 58. Snow WM, Hartle K, Ivanco TL (2008) Altered morphology of motor cortex neurons in the VPA rat model of autism. Dev Psychobiol 50:633–639. [DOI] [PubMed] [Google Scholar]
- 59. Solaini G, Baracca A, Lenaz G, Sgarbi G (2010) Hypoxia and mitochondrial oxidative metabolism. Biochim Biophys Acta 1797:1171–1177. [DOI] [PubMed] [Google Scholar]
- 60. Sugioka K, Nakano M, Totsune‐Nakano H, Minakami H, Tero‐Kubota S, Ikegami Y (1988) Mechanism of O2‐ generation in reduction and oxidation cycle of ubiquinones in a model of mitochondrial electron transport systems. Biochim Biophys Acta 936:377–385. [DOI] [PubMed] [Google Scholar]
- 61. Takenouchi K, Nishijo H, Uwano T, Tamura R, Takigawa M, Ono T (1999) Emotional and behavioral correlates of the anterior cingulate cortex during associative learning in rats. Neuroscience 93:1271–1287. [DOI] [PubMed] [Google Scholar]
- 62. Thakkar KN, Polli FE, Joseph RM, Tuch DS, Hadjikhani N, Barton JJ et al (2008) Response monitoring, repetitive behaviour and anterior cingulate abnormalities in autism spectrum disorders (ASD). Brain 131:2464–2478. [DOI] [PMC free article] [PubMed] [Google Scholar]
- 63. Tsao CY, Mendell JR (2007) Autistic disorder in 2 children with mitochondrial disorders. J Child Neurol 22:1121–1123. [DOI] [PubMed] [Google Scholar]
- 64. Tsatsanis KD, Rourke BP, Klin A, Volkmar FR, Cicchetti D, Schultz RT (2003) Reduced thalamic volume in high‐functioning individuals with autism. Biol Psychiatry 53:121–129. [DOI] [PubMed] [Google Scholar]
- 65. Vargas DL, Nascimbene C, Krishnan C, Zimmerman AW, Pardo CA (2005) Neuroglial activation and neuroinflammation in the brain of patients with autism. Ann Neurol 57:67–81. [DOI] [PubMed] [Google Scholar]
- 66. Weinbach EC, Costa JL, Nelson BD, Claggett CE, Hundal T, Bradley D et al (1986) Effects of tricyclic antidepressant drugs on energy‐linked reactions in mitochondria. Biochem Pharmacol 35:1445–1451. [DOI] [PubMed] [Google Scholar]
- 67. Yin W, Signore AP, Iwai M, Cao G, Gao Y, Chen J (2008) Rapidly increased neuronal mitochondrial biogenesis after hypoxic‐ischemic brain injury. Stroke 39:3057–3063. [DOI] [PMC free article] [PubMed] [Google Scholar]
- 68. Zoroglu SS, Armutcu F, Ozen S, Gurel A, Sivasli E, Yetkin O et al (2004) Increased oxidative stress and altered activities of erythrocyte free radical scavenging enzymes in autism. Eur Arch Psychiatry Clin Neurosci 254:143–147. [DOI] [PubMed] [Google Scholar]
Associated Data
This section collects any data citations, data availability statements, or supplementary materials included in this article.
Supplementary Materials
Table S1. Details of the genes included in Human Mitochondrial Energy Metabolism PCR Array
Table S2. Functional groupings of the 84 electron transport complex genes included in Human Mitochondrial Energy Metabolism PCR Array