

Abstract
Current classification of gliomas is based on histological criteria according to the World Health Organization (WHO) classification of tumors of the central nervous system. Over the past years, characteristic genetic profiles have been identified in various glioma types. These can refine tumor diagnostics and provide important prognostic and predictive information. We report on the establishment and validation of gene panel next generation sequencing (NGS) for the molecular diagnostics of gliomas. We designed a glioma‐tailored gene panel covering 660 amplicons derived from 20 genes frequently aberrant in different glioma types. Sensitivity and specificity of glioma gene panel NGS for detection of DNA sequence variants and copy number changes were validated by single gene analyses. NGS‐based mutation detection was optimized for application on formalin‐fixed paraffin‐embedded tissue specimens including small stereotactic biopsy samples. NGS data obtained in a retrospective analysis of 121 gliomas allowed for their molecular classification into distinct biological groups, including (i) isocitrate dehydrogenase gene (IDH) 1 or 2 mutant astrocytic gliomas with frequent α‐thalassemia/mental retardation syndrome X‐linked (ATRX) and tumor protein p53 (TP53) gene mutations, (ii) IDH mutant oligodendroglial tumors with 1p/19q codeletion, telomerase reverse transcriptase (TERT) promoter mutation and frequent Drosophila homolog of capicua (CIC) gene mutation, as well as (iii) IDH wildtype glioblastomas with frequent TERT promoter mutation, phosphatase and tensin homolog (PTEN) mutation and/or epidermal growth factor receptor (EGFR) amplification. Oligoastrocytic gliomas were genetically assigned to either of these groups. Our findings implicate gene panel NGS as a promising diagnostic technique that may facilitate integrated histological and molecular glioma classification.
Keywords: glioma, molecular diagnostics, mutation, next generation sequencing
Introduction
Gliomas comprise a genetically, histologically and clinically heterogeneous group of primary brain tumors that are to date histologically classified according to the World Health Organization (WHO) classification of tumors of the central nervous system (CNS) 29. However, histological classification of gliomas is increasingly complemented by diagnostic, prognostic and/or predictive molecular biomarkers, most notably isocitrate dehydrogenase (IDH) 1 or 2 gene mutation (IDH mutation), codeletion of chromosomal arms 1p and 19q (1p/19q codeletion), nuclear α‐thalassemia/mental retardation X‐linked syndrome (ATRX) gene mutations causing loss of nuclear ATRX protein expression, and O6‐methylguanine DNA‐methyltransferase (MGMT) promoter methylation (for recent review see 62). Moreover, large‐scale molecular profiling studies have revealed that different glioma entities carry characteristic genetic and epigenetic aberration profiles that may be employed for molecular tumor classification 62. For example, the vast majority of pilocytic astrocytomas, which constitute the most common pediatric gliomas, carry activating genetic rearrangements or mutations in the B‐Raf proto‐oncogene, serine/threonine kinase (BRAF) gene 22, 66. The activating BRAF‐V600E mutation is also common in pleomorphic xanthoastrocytomas 42, often accompanied by homozygous deletion of the cyclin‐dependent kinase inhibitor 2A (CDKN2A) gene and loss of p16INK4a expression 25, 58. Diffuse gliomas of the astrocytic and oligodendroglial lineages are characterized by frequent IDH mutations. In astrocytic gliomas, IDH mutations are typically associated with mutations in the tumor protein p53 (TP53) and the ATRX genes 4, 54. In contrast, oligodendroglial tumors are characterized by IDH mutation associated with codeletion of chromosomal arms 1p and 19q as well as frequent mutations in the Drosophila homolog of capicua transcriptional repressor (CIC) gene and the telomerase reverse transcriptase (TERT) promoter 4, 54. Primary glioblastomas, the most common and most malignant gliomas in adults, typically lack IDH mutation but often carry mutations in the phosphatase and tensin homolog (PTEN) gene and in the TERT promoter 62. In addition, monosomy of chromosome 10, gains of chromosome 7 or 7q, losses on 9p involving the cyclin‐dependent kinase inhibitor 2A and B (CDKN2A/B) gene loci, and amplifications of proto‐oncogenes, such as epidermal growth factor receptor (EGFR) amplification, are frequent in primary glioblastomas 62. In pediatric glioblastomas and diffuse intrinsic pontine gliomas, mutations in the H3 histone family 3A (H3F3A) gene, often associated with ATRX and TP53 mutations, have been identified as frequent alterations 46, 64.
Based on these findings, we evaluated amplicon‐based next generation sequencing (NGS) of a glioma‐tailored 20‐gene panel as a novel molecular diagnostic tool in gliomas. Sensitivity and specificity of gene panel NGS for detection of glioma‐associated sequence changes and copy number aberrations were assessed. In addition, we optimized the method for application on formalin‐fixed and paraffin‐embedded (FFPE) tissue samples and investigated different glioma types to determine the potential for facilitating integrated histological and molecular brain tumor classification as it has been proposed for the upcoming revision of the WHO classification of CNS tumors 30.
Materials and Methods
Glioma tissue samples
A total of 58 fresh‐frozen and 80 formalin‐fixed paraffin‐embedded (FFPE) tumor tissue samples from 121 glioma patients were selected from the central nervous system (CNS) tumor tissue bank at the Department of Neuropathology, Heinrich Heine University, Düsseldorf, Germany. Ethics approval was obtained from the institutional review board of the Medical Faculty, Heinrich Heine University Düsseldorf (study number: 4012). All tumors were originally classified according to the WHO classification of 2007 29. The tumor series included nine diffuse astrocytomas WHO grade II (A II), 13 anaplastic astrocytomas WHO grade III (AA III), 52 glioblastomas WHO grade IV (GB IV), including 10 secondary glioblastomas (two with oligodendroglial component) and three pediatric glioblastomas, nine oligoastrocytomas WHO grade II (OA II), 11 anaplastic oligoastrocytomas WHO grade III (AOA III), nine oligodendrogliomas WHO grade II (O II), eight anaplastic oligodendrogliomas WHO grade III (AO III), four pleomorphic xanthoastrocytomas WHO grade II (PXA II) and one PXA with anaplastic features (PXA w.a.f.), as well as five pilocytic astrocytomas WHO grade I (PA I). Supporting Information Table 1 provides an overview of relevant clinical and histological data of the 121 patients investigated. All tissue samples used for DNA extraction were histologically evaluated to ensure an estimated tumor cell content of 80% or more. In 15 patients, DNA extracted either from deep‐frozen or from FFPE tissue samples of the same tumor were studied. In two patients, results obtained in stereotactic biopsy specimens were compared to those obtained in larger specimens of follow‐up resections. In 14 patients we also sequenced leukocyte DNA for comparison with the matched tumor DNA.
DNA extraction and quantification
DNA extraction from frozen tissue samples (n = 58 tumors) was performed with the JETQUICK Tissue DNA Spin Kit (Genomed, Loehne, Germany). Leukocyte DNA was extracted from 14 patients with the PureLink Genomic DNA Mini Kit (Life Technologies, Carlsbad, CA, USA). For DNA preparation from FFPE samples, we either used the QIAamp DNA FFPE Tissue Kit (Qiagen, Hilden, Germany) (n = 38 tumors) or the GeneRead DNA FFPE Kit (Qiagen) (n = 49 tumors). In nine cases, DNA samples were separately purified with either kit. High molecular weight DNA extracted from fresh‐frozen tumor tissue or blood samples was quantified using the Qubit system (Life Technologies). DNA extracted from FFPE tissue was quantified with the TaqMan RNase P Detection Reagents Kit (Life Technologies) using a StepOne Plus™ real‐time PCR machine (Life Technologies).
Design of the glioma‐tailored customized gene panel
The customized gene panel for 20 glioma‐associated genes was created using the Ion AmpliSeq™ Designer tool (https://ampliseq.com). It consisted of 660 primer pairs covering the coding sequences (cds) or mutational hot spot regions of the following genes: ATRX (cds), BRAF (hot spot region), CDKN2A (cds), CDKN2B (cds), CDKN2C (cds), CIC (cds), EGFR (cds), FUBP1 (cds), H3F3A (hot spot region), IDH1 (hot spot region), IDH2 (hot spot region), NF1 (cds), NF2 (cds), NRAS (cds), PIK3CA (cds), PIK3R1 (cds), PTEN (cds), RB1 (cds), TERT promoter (hot spot region) and TP53 (cds) (for details see Supporting Information Tables 2 and 3). These 20 genes include the most commonly mutated genes in gliomas 4, 5, 54 as well as those genes previously suggested as diagnostically relevant molecular markers, such as IDH1/2, ATRX, CIC, TERT and BRAF 2, 62. We hypothesized that this glioma‐tailored 20‐gene panel should suffice to evaluate at a reasonable cost the most relevant aspects of the method, such as sensitivity, specificity, applicability to FFPE samples and usefulness for diagnostic purposes.
Library preparation and next generation sequencing
NGS libraries were generated with the Ion AmpliSeq™ Library 2.0 Kit (Life Technologies) and our customized AmpliSeq™ glioma gene panel using ten nanograms of genomic DNA per primer pool for library preparation. Amplification and adapter ligation were performed according to the manufacturer's protocol (MAN0006735 Rev.5, Life Techologies). The libraries were barcoded during the ligation reaction using the Ion Xpress™ Barcode Adapter Kit (Life Technologies). Emulsion‐PCR and enrichment were performed on the Ion OneTouch™ 2 System (Life Technologies) using the Ion PGM™ 200 Template OT2 200 Kit or the Ion PITM Template OT2 200 Kit v3 (MAN0007220 Rev.4 and MAN0009133 Rev.A, Life Technologies). Sequencing runs were either performed on the Ion Torrent Personal Genome Machine (PGM)TM or the Ion ProtonTM System (Life Technologies). For Ion Torrent PGMTM sequencing, we used Ion 316™ or Ion 318™ chips and the Ion PGM™ Sequencing 200 Kit v2 (MAN0007273 Rev.3 and MAN0007517 Rev.1, Life Technologies). Ion PI™ v2 chips and the Ion PI™ Sequencing 200 Kit v3 were used for Ion ProtonTM sequencing (MAN0009136 Rev.A, Life Technologies). In later runs, the Ion PI™ Hi‐Q™ OT2 200 Kit and the Ion PI™ Hi‐Q™ Sequencing 200 Kit with Ion PI™v3 chips were used (MAN001085 Rev.B and MAN0010947B Rev.A, Life Technologies). Depending on the used NGS system and chip, we pooled two to five libraries on 316 and 318 chips and up to 40 samples on one PI chip. Thereby, we generated 1,000,000 reads or more for each library.
Analysis of NGS data for sequence variants and copy number changes
Amplicon sequences were aligned to the human reference genome GRCh37 (hg19) in the target region of our AmpliSeq™ custom gene panel using the Torrent SuiteTM software 4.4 with the implemented TMAP algorithm (Life Technologies). Variants were detected using the Torrent Variant Caller Plugin v4.0 (or Torrent Variant Caller Plugin v4.4 for Hi‐Q chemistry) and the predefined parameter set ‘somatic high stringency’. Detailed annotations to each detected variant were collected in the databases of the NCBI Reference Sequence Database (RefSeq), Exome Sequencing Project (ESP), 1000 Genomes Project (1000g), and dbSNP using the open source software tool ANNOVAR 57. Further information was added by the implemented prediction tools PhyloP 48, SIFT 26, PolyPhen2 1, and LRT 11. The Integrative Genomics Viewer (IGV 2.3) was used to visualize the read alignments and to check for possible errors caused by for example, homopolymer stretches 38. Copy number variations (CNVs) were identified with NextGENe® v.2.3.4 (SoftGenetics, State College, PA, USA). The software computes reads per kilobase per million reads (RPKM) and calculates the likelihood possibility based on dispersion measurements and coverage ratios. The Hidden Markov Model was then used to calculate a CNV classification (NextGENe User Manual, SoftGenetics). Ratios for each region given by NextGENe® were 0.50 for normal gene copy number and 0.33 for hemizygous deletion. For detection of homozygous deletions of the CDKN2A locus, we performed dilution series with predefined mixtures of normal human dermal fibroblast and CDKN2A homozygously deleted U118MG DNA (see below), and thereby determined a ratio threshold of less than 0.19 for homozygous CDNK2A deletion.
Optimization of TERT promoter sequence coverage
Initial sequencing runs revealed a low coverage of the GC‐rich TERT promoter sequence. To increase read numbers, we designed fusion primers including A‐adapter sequence, barcode sequence and adapter (gat) as well as TERT forward primer (5'‐ccatctcatccctgcgtgtctccgactcag‐barcode‐gat‐cagcgctgcc‐3') or P1‐adapter sequence and TERT reverse primer (5'‐cctctctatgggcagtcggtgat‐ccgtcctgccccttcac‐3'). These primers allow for amplification of PCR‐products consisting of A‐adapter sequence, barcode sequence, TERT target sequence and P1‐adapter sequence. These TERT amplicons were then purified with Agencourt® AMPure® XP beads (Beckman Coulter, USA), diluted to 200 pM and mixed to the sample library in an equimolar manner. This approach allowed for increased coverage of the TERT promoter sequence. However, recent improvement of the Ion Torrent sequencing chemistry using the PI™ Hi‐Q™ OT2 200 Kit for the emulsion PCR and the Ion PI™ Hi‐Q™ Sequencing 200 Kit markedly increased TERT promoter coverage so that separate amplification was no longer required (Supporting Information Table 4).
Validation of mutations by Sanger sequencing
DNA sequence changes detected by NGS were validated by Sanger sequencing using the amplicon primer sequences given in the AmpliseqTM Designer list (Supporting Information Table 3). Sequencing of the TERT promoter hotspot mutations located at chromosome 5 nucleotide 1,295,228 (“C228T”) or nucleotide 1,295,250 (“C250T”) was performed with the following primers: forward: 5'‐gtcctgccccttcacctt‐3'; reverse: 5'‐gcttcccacgtgcgcag‐3'. Sanger sequencing was carried out using the Big Dye 3.1 cycle sequencing kit and an ABI 3130XL Genetic Analyzer (Life Technologies).
DNA pyrosequencing for IDH1, IDH2 and BRAF hot spot mutation
Mutations affecting codon 132 of IDH1, codon 172 of IDH2 or codon 600 of BRAF were validated by DNA pyrosequencing as reported 18. The following primer sequences were used: BRAF: F1bio: biotinylated‐5'‐ggtgattttggtctagctaca‐3', R1: 5'‐aaatggatccagacaactg‐3', Seq1: 5'‐ggacccactccatcgagatt‐3'; IDH1: F1bio: biotinylated‐5'‐ggcttgtgagtggatgggta‐3', R1: 5'‐gccaacatgacttacttgatcc‐3', Seq1: 5'‐gatccccataagcatg‐3'; IDH2: R1bio: biotinylated‐5'‐ctccaccctggcctacct‐3', F1: 5'‐ctggaccaagcccatcacc‐3', Seq1: 5'‐aagcccatcaccatt‐3'.
Threshold definition for detection of homozygous CDKN2A deletion
To experimentally define a read ratio threshold for homozygous CDKN2A deletion, we performed a dilution series with DNA extracted from the glioma cell line U118MG (ATCC, Manassas, USA), which has lost both CDKN2A alleles, and DNA extracted from primary normal human dermal fibroblasts (NHDF) (Promocell, Heidelberg, Germany), which have retained both CDKN2A alleles. DNA samples from either cells were mixed in relations of 50:50, 60:40, 70:30, 80:20 and 90:10 (U118MG:NHDF). CDKN2A copy numbers were determined using a TaqManTM copy number assay (see below). For gene panel NGS, libraries were generated for U118MG, NHDF and for each U118MG:NHDF mixture. For threshold determination, the number of reads obtained for CDKN2A in NHDF was compared with the number of reads obtained in each U118MG:NHDF mixture using the CNV Tool from NextGENe® (see below). The average ratio of all CDKN2A amplicon ratios was calculated for each U118MG:NHDF mixture and compared with the expected ratios.
PCR‐based detection of CDKN2A and PTEN deletions
CDKN2A and PTEN gene copy numbers were determined by quantitative PCR using TaqManTM copy number assays (CDKN2A: Hs02738179_cn, 9p21.3c; PTEN: Hs05152772_cn, 10q23.31a; Applied Biosystems, Foster City, CA). RNaseP (4403326, 14q11.2) was used as the reference gene. Duplex‐PCR was carried out according to the manufacturer's protocol with 20 ng of genomic DNA in a final volume of 20 µL using the StepOne PlusTM Real‐Time PCR System. Gene copy numbers were determined using the comparative ΔΔCT method 28 and the CopyCaller™ software version 2.0 (Applied Biosystems). All samples were analyzed in triplicates using human normal brain DNA (D1234035‐BC, Biocat GmbH, Heidelberg, Germany) as calibrator.
PCR‐based detection of EGFR gene amplification
To detect EGFR gene amplification we used semiquantitative real‐time PCR with primers EGFR‐F (5'‐cactgcctcatctctcaccatc‐3') and EGFR‐R (5'‐gactcaccgtagctccagac‐3'). The WI‐3306 locus on 2q served as reference locus using the primers WI‐3306‐F (5'‐catgactgcgagcccaagatg‐3') and WI‐3306‐R (5'‐caggtggtgtcatcagaatcag‐3'). The target:reference gene ratio obtained for each tumor was normalized to the target:reference gene ratio obtained for human normal brain DNA using the comparative ΔΔC T method. DNA from a glioblastoma with known EGFR amplification served as a positive control. Samples with a target:reference gene ratio ≥3 were considered as showing EGFR gene amplification.
Microsatellite analysis for loss of heterozygosity (LOH) on 1p and 19q
Analyses for LOH on 1p and 19q were performed by evaluation of six microsatellite loci on 1p (D1S468, D1S507, D1S200, D1S2696, D1S211 and D1S489) and five microsatellite loci on 19q (D19S219, D19S1182, D19S572, D19S210 and D19S596) as reported 17.
Detection of IDH1‐R132H, ATRX and EGFRvIII by immunohistochemistry
The presence of an IDH1‐R132H mutation was demonstrated by immunohistochemistry using the monoclonal antibody clone H09 (Dianova, Hamburg, Germany) 8. For detection of EGFRvIII we used an EGFRvIII‐specific antibody (rabbit polyclonal lot #6549 antiserum, Celldex, Needham, MA, USA) as reported 59. Nuclear expression of ATRX was demonstrated with a rabbit polyclonal antibody (HPA001906, Sigma‐Aldrich, St. Louis, MO, USA). Antibody‐binding was visualized with 3,3‐diaminobenzidine as substrate for the peroxidase reaction. Immunostained sections were counterstained with hemalum.
Statistical analyses of NGS data
Unsupervised average linkage hierarchical clustering was applied to the NGS data obtained in 121 tumors based on Jaccard's matching coefficient to calculate distances. This analysis was performed using the open source statistical computing language “R” (version 3.2.2) and the integrated development environment “RStudio” (version 0.99.484) as well as the R packages “NMF” (version 0.20.6) and “stats” (version 3.2.2).
Results
Sequence coverage and quality of gene panel NGS analysis
The average number of mapped reads was 1,510,942 with a 106 base pair (bp) mean read length and a median Phred quality score of 27. The average number of total reads per amplicon was 2226, with 97% of all amplicons being covered by at least 300 reads, and 88% of all amplicons being covered by at least 1000 reads. Only four of the 660 amplicons were covered with an average of less than 20 reads per run, likely be caused by the lack of their high GC content (Supporting Information Table 4). These included amplicon AMPL3806956579 that covers the hotspot mutation sites in the TERT promoter. We neither got higher read coverage of this amplicon by increasing the concentration of TERT primer in the multiplex primer pool nor by adding separately amplified TERT promoter sequences to the pool after multiplex PCR. In contrast, TERT coverage could be increased to up to 1600 reads by adding TERT amplicons to the library pool that were generated with specifically designed fusion primers. However, the recently introduced Ion Hi‐Q™ sequencing chemistry also improved average coverage of the TERT amplicon to more than 100‐fold, so that the addition of specific fusion primers for the TERT promoter amplicon was no longer required (Supporting Information Table 4). In total, we identified “C228T” or “C250T” mutations in the TERT promoter by NGS and/or conventional sequencing in 66 of the 121 investigated gliomas. Results of NGS and Sanger sequencing were consistent in 31 tumors successfully investigated by both methods.
Detection of DNA copy number variations (CNVs) by gene panel NGS analysis
Although our glioma gene panel was primarily designed for identification of DNA sequence changes, we additionally applied the method for the detection of glioma‐associated DNA copy number variations (CNVs). We were able to reliably detect EGFR gene amplification by markedly increased coverage of the respective amplicons (Figure 1B). Detection of an additional EGFRvIII deletion mutation in the EGFR‐amplified tumors was also possible (Figure 1B), although at lesser sensitivity as compared to RT‐PCR analysis and EGFRvIII immunohistochemistry (see below). Using the CNV tool of the NextGENe® v.2.3.4 software, we additionally determined codeletion of 1p and 19q, as well as hemizygous deletion of PTEN and homozygous deletion of CDKN2A (Figure 1C and D). To experimentally define the threshold for homozygous CDKN2A deletion, we mixed DNA extracted from U118MG glioma cells, harboring a homozygous CDKN2A deletion, and from primary normal human dermal fibroblasts (NHDF) in variable proportions. DNA from U118MG, NHDF and mixtures of both were investigated by gene panel NGS and a TaqMan® PCR‐based CDKN2A copy number assay. Both methods revealed experimentally determined CDKN2A gene dosages that correlated well with each other and with the expected values (Supporting Information Figure 1A and B). Based on these results and the histological demonstration of more than 80% tumor cell content in the investigated tissue specimens, we set the ratio threshold for detection of homozygous CDKN2A deletion in tumor DNA to a value of 0.19 relative to constitutional DNA. Analysis of the allele frequencies of eight single nucleotide variations (SNVs) present in NHDF but not in U118MG also revealed a good correlation between expected and experimentally determined allele frequencies, with each SNV being readily detectable in a 90:10 (U118MG:NHDF) dilution. These findings indicate reliable SNV detection even in samples with low allele frequencies, for example, be caused by the lack of high normal cell contamination or SNVs restricted to a minor subpopulation of tumor cells (Supporting Information Figure 1C).
Figure 1.
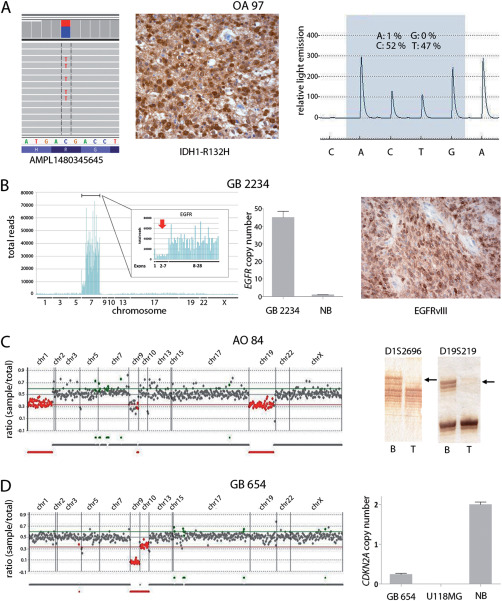
Examples of sequence and copy number changes detected by gene panel NGS and validated by independent methods. A. Detection of IDH1‐R132H mutation in an oligoastrocytoma (OA 97). Shown are selected IDH1 sequencing reads from a total number of 2911 reads, with 44% of all reads corresponding to C>T transition translating into IDH1‐R132H (left). Presence of the IDH1 mutation in OA 97 was validated by immunohistochemistry (middle) and DNA pyrosequencing (right), the latter technique demonstrating a mutant allele frequency of 47%. B. Detection of EGFR amplification and the EGFRvIII deletion rearrangement by gene panel NGS in a glioblastoma (GB 2234). EGFR amplification is reflected by a strong increase in the number of total reads obtained for the EGFR sequences relative to all other sequences (left). The EGFRvIII deletion rearrangement is indicated by reduced read counts obtained for EGFR exons 2‐7 (red arrow) relative to the read counts for the highly amplified EGFR exons 1 and 8–28 (left, insert). EGFR amplification in GB 2234 was confirmed by quantitative real‐time PCR (middle; NB, normal brain). Presence of EGFRvIII was validated by immunohistochemical staining with an EGFRvIII‐specific antibody (right). C. Detection of 1p/19q codeletion in an anaplastic oligodendroglioma (AO 84) by demonstrating reduced coverage ratios for gene sequences on 1p and 19q (left, red data points). Validation of the 1p/19q codeletion in AO 84 was performed by microsatellite analysis (right) demonstrating loss of heterozygosity at microsatellite markers D1S2696 (1p) and D19S219 (19q) in tumor (T) DNA (arrows) relative to the corresponding blood DNA (B). D. Detection of a homozygous CDKN2A deletion in a glioblastoma (GB 654) by gene panel NGS (left). Note that gene sequences on 9p21 (CDKN2A) and 10q23 (PTEN) demonstrate reduced coverage ratios, with the coverage ratio for CDKN2A amplicons (homozygous deletion) being even lower than for PTEN amplicons (hemizygous deletion). Homozygous CDKN2A deletions were validated by quantitative PCR using a CDKN2A TaqMan® copy number assays (right). Normal brain (NB) DNA was used as constitutive control with two gene copies, while U118MG DNA served as positive control for homozygous deletion.
Sensitivity and specificity of gene panel NGS analysis
The gliomas investigated by gene panel NGS included 37 tumors with 38 previously known SNVs and 22 tumors with 22 previously known CNVs. NGS analysis identified all 38 previously known SNVs, including 25 IDH1‐R132H mutations (Figure 1A), three IDH2‐R172K mutations, six BRAF‐V600E mutations, two H3F3A‐K27M mutations, one H3F3A‐G34R mutation and one PTEN‐G132D mutation. In addition, all 22 previously determined CNVs, including 12 EGFR amplifications and ten 1p/19q codeletions were detected (Figure 1B and C). Thus, NGS analysis identified 60 of 60 previously known genetic changes, corresponding to a sensitivity of 100% (Supporting Information Table 1). To assess the sensitivity of NGS‐based detection of CDKN2A homozygous deletion in glioma tissues, we additionally investigated 95 of the 121 gliomas of our series using a TaqMan® CDKN2A copy number assay, which generally revealed concordant results, that is, 13 tumors displayed evidence for homozygous CDKN2A deletion while 82 tumors showed no evidence for homozygous deletion by both methods.
The EGFRvIII variant was detected by immunohistochemistry and/or RT‐PCR in 6 of the 12 tumors with previously known EGFR‐amplification. Three of the EGFRvIII positive cases were also identified by NGS analysis (Figure 1B; Supporting Information Table 1). Thus, sensitivity of NGS‐based detection of EGFRvIII was lower than sensitivity of RT‐PCR or immunohistochemistry, a finding in line with the reported lower sensitivity of EGFRvIII detection by multiplex ligation‐dependent probe amplification 59.
In addition to the 66 previously known genetic alterations and the 66 TERT promoter mutations (see above), NGS analysis revealed 263 new genetic alterations in the 121 investigated gliomas, comprising 214 DNA sequence changes, including nonsynonymous SNVs, stopgain SNVs, nonframeshift substitutions, frameshift insertions, frameshift deletions, splice site mutations, stoploss SNVs and promoter region SNVs, as well as 49 CNVs, including homozygous CDKN2A deletion, 1p/19q codeletion, hemizygous PTEN deletion, ATRX deletion, EGFR amplification and the EGFRvIII deletion rearrangement. From these 263 newly identified alterations we selected 99 alterations, including 59 DNA sequence variations and 40 CNVs for validation by independent methods (Supporting Information Table 1). All 59 selected sequence variations detected by gene panel NGS were confirmed by Sanger sequencing, pyrosequencing or immunohistochemistry (Figure 1A–D; Supporting Information Table 1). Among the 40 newly detected CNVs that were selected for validation experiments, all were confirmed by an independent method (11 of 11 cases with 1p/19q codeletion; 2 of 2 cases with EGFR amplification; 2 of 2 cases with EGFRvIII aberration; 13 of 13 cases with homozygous CDKN2A deletion, 12 of 12 cases with hemizygous PTEN deletion). Thus, specificity of NGS‐based detection of DNA sequence and copy number variations was 100%.
Relationship between ATRX mutation and loss of nuclear expression
Mutation of ATRX and/or loss of nuclear ATRX expression have been shown to be common in IDH and TP53 mutant astrocytic gliomas 23, 27, and to be mutually exclusive to TERT promoter mutation 4, 24. We compared the ATRX mutation status with loss of nuclear ATRX expression determined by immunohistochemistry in 24 of the 31 IDH and TP53 mutant, 1p/19q noncodeleted astrocytic gliomas of our cohort that could be successfully investigated with both methods (Supporting Information Figure 2). Eighteen of the 24 tumors carried ATRX gene alterations and all of these 18 tumors showed loss of nuclear expression by immunohistochemistry. However, all six gliomas without detectable ATRX mutations that were additionally investigated by immunohistochemistry also displayed loss of nuclear ATRX expression (Supporting Information Figure 2).
Gene panel NGS results obtained from matched tumor and blood DNA
The somatic origin of glioma‐associated DNA sequence variations detected by gene panel NGS was confirmed in 14 patients by sequencing matched leukocyte DNA. These analyses confirmed 51 of the 82 DNA sequence variations detected in tumor DNA as tumor associated somatic mutations (Supporting Information Table 5). In addition, 38 sequence variations detected in tumor DNA were also present in matched leukocyte DNA, that is, corresponded to sequence polymorphisms, all of which were documented in public databases (Supporting Information Table 5). These data suggest that additional sequencing of constitutive DNA may not be routinely required for our gene panel as the detection of novel polymorphisms in the 20 selected genes appears to be rare.
Gene panel NGS data obtained in DNA from fresh frozen and FFPE samples
To facilitate mutation detection in DNA extracted from FFPE samples we specifically designed our NGS gene panel for amplification of relatively short amplicons (each approximately 150 bp in length). To experimentally validate proper variant detection using DNA extracted from FFPE material, we extracted DNA from fresh frozen and FFPE tissue samples of 15 gliomas and performed separate NGS runs on the individual DNA extracts. The QIAamp DNA FFPE Tissue Kit (Qiagen) was originally used for DNA extraction from FFPE tissue in these experiments. Most of the DNA variants were called in DNA extracted from either frozen or FFPE material (189 variants, 74%). Eight variants (3%) were detected only in DNA from frozen tissue und 58 variants (23%) were called exclusively in DNA from FFPE tissue. Six of the eight variants called only in DNA from frozen tissue and nine of the 58 variants called only in DNA from FFPE tissue were retrospectively also identified at very low allele frequencies (1–2%) in the matched DNA extracts. However, 49 variants detected in DNA from FFPE tissue were absent in the corresponding DNA from fresh frozen tissue. Interestingly, 46 of the 49 variants were C>T or G>A transitions with low allele frequencies (<10%). Such transition variants may be caused by formalin‐induced deamination of cytosine to uracil 14. To assess this possibility, we selected nine FFPE samples carrying a total of 39 C>T or G>A transitions not detected in the corresponding DNA from frozen tissue and repeated DNA extraction using treatment with uracil‐N‐glycosylase for removal of deaminated cytosine residues. Repeated NGS analysis of the nine newly extracted DNA samples resulted in the disappearance of all but one C>T (G>A) transitions originally detected in the FFPE DNA. The only C>T transition remaining after uracil‐N‐glycosylase treatment corresponded to a TP53 missense mutation (G147E, COSM43714), which may have occurred in a regional subpopulation of tumor cells. Our findings thus corroborate previous studies 14, 15, 47 reporting uracil‐N‐glycosylase treatment of DNA as a versatile method for reduction of formalin‐induced unspecific C>T transitions.
Comparison of mutational profiles detected by gene panel NGS in stereotactic biopsy and matched open resection specimens
As 10 ng of genomic DNA per primer pool is sufficient for multiplex‐PCR amplification and subsequent NGS analysis, it should be possible to apply gene panel NGS for the analysis of limited DNA amounts as extractable from small FFPE specimens obtained by stereotactic biopsy. To validate this hypothesis, we compared glioma gene panel NGS results obtained in matched pairs of stereotactic biopsy specimens and larger tissue samples from subsequent open tumor resections in two glioblastoma patients (Supporting Information Figure 3). In both patients, identical mutation profiles were obtained in stereotactic and open resection samples, except for a single PIK3CA SNV with low allele frequency (7%) that was detected only in the stereotactic biopsy specimens of one patient.
Mutation profiles detected by gene panel NGS analysis and unsupervised molecular classification of gliomas
Gene panel NGS of 121 gliomas of different types revealed a total of 395 genetic aberrations (Supporting Information Table 1). In 115 of the 121 tumors, at least one DNA sequence or copy number change was detected. Only six tumors, including two anaplastic astrocytomas and four pilocytic astrocytomas demonstrated no detectable alterations in any of the 20 selected genes. IDH1 or IDH2 mutations were revealed in 60 of the 69 (87%) diffuse and anaplastic gliomas, including astrocytic, oligodendroglial and oligoastrocytic tumors (n = 59), as well as secondary glioblastomas (n = 10). Most of these mutations corresponded to IDH1‐R132H (85%), followed by IDH1‐R132S (6.7%), IDH2‐R172K (5.0%), IDH1‐R132L and IDH1‐R132C (each 1.7%). TERT promoter mutations (“C228T” or “C250T”) were most commonly detected in oligodendroglial tumors (O II: 89%; AO III: 100%), followed by primary glioblastomas (87%) and oligoastrocytic gliomas (OA II: 38%; AOA III: 67%). Codeletions of 1p and 19q were detected in 27 gliomas, including 88% of the oligodendroglial tumors, 50% of the oligoastrocytic gliomas, and two glioblastomas with oligodendroglial component. All 1p/19q codeleted gliomas carried IDH mutations and TERT promoter mutations. CIC mutations or combined CIC and FUBP1 mutations were detected in 69% and 19% of the tumors with 1p/19q codeletion. TP53 mutations were found in 46 of the 121 gliomas (38%), including the majority of diffuse and anaplastic astrocytomas (A II: 78%; AA III: 85%), secondary glioblastomas (80%), and oligoastrocytomas (56%), as well as a subset of primary glioblastomas (23%). ATRX mutations were also frequent in IDH and TP53 mutant astrocytic gliomas. EGFR amplification was identified in one third of the IDH wildtype glioblastomas as well as single cases of IDH wildtype anaplastic astrocytoma and anaplastic oligoastrocytoma. BRAF‐V600E was found in four of five pleomorphic xanthoastrocytomas (80%), one of five pilocytic astrocytomas (20%) and two glioblastomas. H3F3A mutations were identified in four glioblastomas and one anaplastic astrocytoma. Homozygous deletion of the CDKN2A gene was detected in 11 of 52 glioblastomas (21%), including 10 of 40 IDH wildtype glioblastomas (25%), and two of five PXAs (40%). Gene panel NGS provided evidence for hemizygous PTEN deletion in 11/40 IDH wildtype glioblastomas (28%) and one IDH mutant (secondary) glioblastoma. Mutations in PTEN (n = 20) and PIK3CA (n = 9) were primarily found in IDH wildtype glioblastomas (18/40, 45%). Other genes demonstrating mutations in subsets of the 121 investigated gliomas were (in decreasing frequency) NF1 (n = 10), PIK3R1 (n = 5), NRAS (n = 3), CDKN2A (n = 2), CDKN2C (n = 1), RB1 (n = 1) and NF2 (n = 1) (Supporting Information Table 1).
To investigate the potential of gene panel NGS data for molecular tumor classification, we performed an unsupervised hierarchical cluster analysis taking into account all sequence changes and copy number variations detected in the 121 investigated gliomas (Figure 2). This analysis revealed distinct groups of gliomas, with mutations in IDH1 or IDH2, TERT, CIC, PTEN, TP53 and ATRX, as well as 1p/19q codeletion and EGFR amplification being the most commonly detected aberrations that dominated the results of cluster analysis. One major cluster (green bar in Figure 2) consisted of 38 primarily astrocytic or oligoastrocytic gliomas characterized predominantly by IDH1, TP53 and/or ATRX mutations. This cluster included 22 tumors with concurrent mutations in all three genes, 8 tumors with IDH1 and TP53 mutations and 8 tumors without IDH1 mutation but TP53 and/or ATRX mutations. The latter subgroup included four gliomas with H3F3A mutation, as well as four cases lacking additional mutations or carrying individual mutations in PTEN, NF1 or BRAF (Figure 2). A second major cluster (red bar in Figure 2), including 30 primarily oligodendroglial or oligoastrocytic tumors, was characterized by mutations in IDH1 (n = 27) or IDH2 (n = 3), TERT (n = 30) and CIC (n = 19) as well as 1p/19q codeletion (n = 27). Additional recurrent mutations in this cluster were mutations in FUBP1 (n = 5), PIK3CA (n = 5), PIK3R1 (n = 3), NRAS (n = 2) and TP53 (n = 2). The third major cluster (blue bar in Figure 2) comprised 38 tumors and included most of the primary glioblastomas characterized by lack of IDH1 or IDH2 mutations, frequent mutations in the TERT promoter (n = 34), PTEN mutation and/or hemizygous deletion (n = 30), as well as EGFR amplification (n = 14), with associated EGFRvIII deletion rearrangement in eight tumors. Other recurrent alterations detected in tumors of this cluster included TP53 mutations (n = 7), homozygous CDKN2A deletions (n = 7), NF1 mutations (n = 5), EGFR mutations other than EGFRvIII (n = 4), and BRAF mutations (n = 2). Finally, a total of 15 tumors clustered outside these three major clusters (gray bar in Figure 2). These included the six tumors without any detectable genetic aberrations and a group of seven tumors, including four pleomorphic xanthoastrocytomas, one pilocytic astrocytoma and one glioblastoma, that displayed BRAF mutation (n = 6), homozygous CDKN2A deletion (n = 2) and TERT promoter mutation (n = 2). The remaining three tumors, including two glioblastomas and one tumor with oligodendroglial morphology, showed individual genetic changes comprising PIK3CA mutation (n = 2), EGFR amplification (n = 1), and CIC mutation (n = 1). Overall, the unsupervised molecular classification correctly assigned the vast majority of tumors to either of the three previously characterized biologically and prognostically distinct subgroups of diffusely infiltrating gliomas in adults, namely (i) IDH, TP53 and/or ATRX mutant astrocytic gliomas, (ii) IDH and TERT promoter mutant as well as 1p/19q codeleted oligodendroglial tumors, and (iii) IDH wildtype, TERT promoter mutant glioblastomas with frequent PTEN mutation and/or EGFR amplification 4, 54, 61, 63.
Figure 2.

Results of unsupervised hierarchical cluster analysis of the 20‐gene panel NGS data obtained in 121 gliomas. Blue and gray boxes indicate presence or absence of a given aberration. Note that tumors form major clusters primarily characterized by frequent mutations in IDH1 or H3F3A, TP53 and/or ATRX (green bar), frequent mutations in IDH1 or IDH2, the TERT promoter and CIC, as well as 1p/19q codeletion (red bar), or frequent mutations in the TERT promoter, PTEN and/or NF1, as well as EGFR amplification (blue bar). The remaining tumors (gray bar) included a subgroup of BRAF‐V600E mutant gliomas as well as another subgroup of tumors without detectable aberrations or only single gene mutations. Histological classification of the individual tumors according to the WHO classification 2007 is indicated (A II, astrocytoma WHO grade II; AA III, anaplastic astrocytoma WHO grade III; O II, oligodendroglioma WHO grade II; AO III, anaplastic oligodendroglioma WHO grade III; OA II, oligoastrocytoma WHO grade II; AOA III, anaplastic oligoastrocytoma WHO grade III; GB IV, glioblastoma WHO grade IV; PA I, pilocytic astrocytoma WHO grade I; PXA, pleomorphic xanthoastrocytoma); *includes TERT mutations detected by gene panel NGS and/or conventional sequencing; **refers to CDKN2A homozygous deletion:***includes EGFRvIII mutations detected by gene panel NGS and/or immunohistochemistry/RT‐PCR.
Application of gene panel NGS data for integrated histological and molecular classification
The Haarlem consensus guidelines 30 proposed a novel approach for the revised WHO classification that is based on the integration of histological features and genetic biomarkers. We investigated the potential impact of integrating our gene panel NGS findings in the classification of the investigated gliomas, specifically focusing on the 111 diffusely infiltrative gliomas as the most relevant subset for the integrated diagnosis approach. Figure 3 illustrates how the original histology‐based classification of these tumors according to the WHO classification 2007 could be translated into an integrated classification based on IDH mutation, 1p/19q codeletion status and H3F3A‐K27 mutation. The most pronounced changes were seen for classification of the 20 oligoastrocytic tumors that were completely reclassified according to either IDH mutant and 1p/19q non‐codeleted (astrocytic) gliomas (n = 6), IDH mutant and 1p/19q codeleted (oligodendroglial) tumors (n = 11) and IDH wildtype anaplastic astrocytomas (n = 3). While all nine diffuse astrocytomas of our cohort corresponded to IDH mutant and 1p/19q noncodeleted tumors, the 13 anaplastic astrocytomas were split into eight IDH mutant and four IDH wildtype tumors, as well as one H3F3A‐K27 mutant glioma. The group of 17 oligodendroglial tumors comprised 15 IDH mutant and 1p/19q codeleted oligodendroglial tumors and two tumors without this oligodendroglioma‐associated genetic signature, which indeed would correspond to a not otherwise specified (NOS) category as proposed in the Haarlem consensus guidelines 30. Finally, the group of 52 glioblastomas according to WHO 2007 split up into 40 IDH wildtype glioblastomas (including two H3F3A‐G34 mutant tumors), eight IDH mutant glioblastomas, two IDH mutant, and 1p/19q codeleted anaplastic oligodendrogliomas, and two H3F3A‐K27 mutant tumors (Figure 3).
Figure 3.

Schematic illustration of the diagnostic changes in 111 diffusely infiltrative gliomas originally classified histologically according to the WHO classification of 2007 (left side) and then reclassified by integrating histology and the genetic markers IDH mutation, 1p/19q codeletion and H3F3A‐K27M mutation in line with the Haarlem consensus recommendations 30 for the upcoming revised WHO classification. *The three H3F3A‐K27 mutant tumors were all midline (thalamic) lesions.
Detection of potentially predictive DNA aberrations by gene panel NGS
Our glioma‐tailored gene panel was primarily designed for facilitating glioma classification by assessment of the diagnostically most relevant DNA aberrations. However detection of specific mutations or copy number changes in several of the 20 selected genes, for example, EGFR, PIK3CA, PIK3R1, IDH1, BRAF, NRAS and H3F3A, may additionally serve as potentially predictive markers to guide upcoming novel approaches for targeted therapy. These include strategies that are or will soon be in clinical evaluation, for example, vaccination against EGFRvIII 41, 44 or mutant IDH1‐R132H 45, as well as new pharmacologic approaches with only preclinical evidence to date, such as the recently reported experimental strategies for epigenetic treatment of H3‐K27M mutant diffuse midline gliomas 19, 20. Supporting Information Table 6 provides an overview of potentially predictive aberrations detected by gene panel NGS and their detection rates in the subset of 52 glioblastomas. However, these alterations remain of limited relevance in current routine clinical practice as therapeutic efficacy of the corresponding strategies remains to be proven.
Discussion
The upcoming revised WHO classification of CNS tumors will integrate both histological features and molecular biomarkers for glioma diagnostics following the Haarlem consensus guidelines 30. To date, diagnostic neuropathology laboratories employ individual testing for selected biomarkers, such as mutations in IDH1, IDH2, ATRX, TERT, H3F3A and BRAF as well as 1p/19q codeletion 2, 62. This involves various testing methods including immunohistochemistry with mutation‐specific antibodies, for example, against IDH1‐R132H, BRAF‐V600E and H3‐K27M 3, 7, 8, 56, conventional Sanger sequencing or pyrosequencing of tumor DNA for detection of mutations, as well as fluorescence or chromogenic in situ hybridisation (FISH/CISH) and microsatellite analyses for detection of 1p/19q codeletion 37. In addition, novel genetic aberrations are continuously emerging that bear great promises as diagnostic, prognostic and/or predictive biomarkers 62. These impressive developments demand the establishment and validation of new diagnostic techniques that ideally should fulfill the following criteria: (i) ability to detect multiple or even all clinically relevant biomarkers in a single experiment, (ii) reliable detection of these biomarkers in routinely processed FFPE material, (iii) applicability to small biopsy specimens and limited amounts of tumor DNA and (iv) generation of test results at reasonable costs and in a time period not prolonging the start of adjuvant treatment. Recent studies indicated that these criteria may be accomplished in brain tumor diagnostics by different, in part complementary high‐throughput approaches using microarray‐based DNA methylation profiling 21, 63, whole‐genome array comparative genomic hybridization combined with mass spectrometry‐based mutation genotyping 34, multiplexed PCR‐based (SNaPshot) genotyping 10, and NGS‐based approaches employing commercial 13, 50, 51, 55 or customized gene panels 16, 31, 40.
In the present study, we successfully established and validated a customized NGS‐based approach for diagnostic sequencing of 20 genes commonly aberrant in gliomas. Our data indicate that this approach may to a large extent fulfill the criteria mentioned above. We found a high sensitivity and specificity of the method for detection of DNA sequence changes, including diagnostically relevant mutations in IDH1, IDH2, TP53, ATRX, PTEN, H3F3A, BRAF and the TERT promoter. Moreover, we were able to reliably determine diagnostically important DNA copy number variations, including 1p/19q codeletion and EGFR gene amplification. We also demonstrated that amplicon‐based gene panel NGS can be successfully applied not only to high molecular weight DNA from fresh‐frozen tissue but also to degraded DNA from routinely processed FFPE tissue, including small tissue specimens obtained by stereotactic biopsy. In line with previous studies 14, 15, we observed that formalin‐induced C>T artifacts may cause false‐positive DNA variant calls in NGS analyses of FFPE‐DNA. We also corroborated that this phenomenon can be avoided by using DNA extraction protocols involving treatment of the DNA with uracil–DNA glycosylase 14, 15, 47. Concerning costs, expenses for our 20‐gene panel NGS are in the range of those required for the individual molecular analysis of 2‐3 genetic markers, such as IDH1 and IDH2 mutation analysis by DNA pyrosequencing and 1p/19q codeletion analysis by FISH or microsatellite analysis. Moreover, the procedure from DNA extraction to evaluation of sequencing results can be readily performed within the usual time frame from surgical resection to start of adjuvant radio‐and/or chemotherapy 53, that is, usually can be accomplished within 2–3 weeks following resection.
Having established our glioma‐tailored gene panel and demonstrated its reliable performance on routinely processed tissue samples, we used this method for molecular profiling of 121 gliomas of different histological types and WHO grades. Unsupervised analysis of the obtained NGS data revealed groups of genetically similar tumors that by and large corresponded to the previously characterized biologically and prognostically distinct adult glioma types, namely IDH wildtype glioblastomas, IDH mutant astrocytic gliomas, as well as IDH mutant and 1p/19q codeleted oligodendroglial tumors 4, 54, 61, 63. These findings are in line with a recent study employing gene panel NGS for the molecular characterization of 126 high‐grade gliomas from patients of the EORTC 26951 trial 16. We also employed our glioma gene panel NGS data for an integrated histological and molecular classification of the 111 adult diffuse gliomas included in our tumor series. Corroborating previous results based on individual marker analyses 36, 39, 450k methylation bead array analysis 63 or exome sequencing of a predefined cancer gene panel 13, we found that all 20 tumors histologically classified as oligoastrocytic gliomas according to the WHO classification of 2007 29 could be reclassified as either IDH mutant astrocytic gliomas, IDH mutant and 1p/19q codeleted oligodendroglial tumors, or IDH wildtype anaplastic gliomas, including high‐grade tumors with genetic alterations typical for IDH wildtype glioblastomas. In addition, the group of glioblastomas could be stratified into IDH wildtype and IDH mutant glioblastomas, but also revealed two cases of IDH mutant and 1p/19q codeleted anaplastic oligodendroglioma. Moreover, tumors with H3F3A‐G34 or ‐K27 mutations were identified. The tumors histologically classified as anaplastic astrocytomas were resolved into IDH mutant and IDH wildtype cases, the latter again including tumors with genetic hallmarks of IDH wildtype glioblastoma, thus corroborating previous studies 4, 35, 54, 61, 63. The fact that the histological diagnosis according to the WHO classification of 2007 was changed or refined in a considerable fraction of tumors when additionally considering molecular biomarkers as proposed for the upcoming revised WHO classification 30 illustrates the high impact of molecular markers in future glioma classification and provides a proof of principle that gene panel NGS may become an important tool in future glioma diagnostics by facilitating timely and robust molecular profiling.
We also recognize several limitations of the 20‐gene panel NGS approach reported here. While the initial low coverage of the GC‐rich TERT promoter region impeded reliable detection of activating TERT promoter mutations, a phenomenon also observed in other NGS studies 16, 54, the recently improved sequencing chemistry solved this problem by increasing median coverage of this particular amplicon to more than 100‐fold. Concerning detection of ATRX alteration, our data suggest that gene panel NGS analysis may be less sensitive when compared to immunohistochemical detection of loss of ATRX expression. A similar observation has been reported in a NGS study of leiomyosarcomas 65. The mechanistic basis of this finding needs to be further investigated but might be related to mutations in intronic or promoter regions that are not covered by sequencing of coding regions, or even other, for example, epigenetic mechanisms potentially leading to loss of ATRX expression.
With respect to detection of diagnostic DNA copy number changes, our customized panel reliably revealed 1/19q codeletion and EGFR gene amplification. However, hemizygous 10q deletion analysis was restricted to the 19 amplicons of the PTEN gene, which overall turned out to be of limited sensitivity as indicated by the low fraction of PTEN‐deleted glioblastomas identified by gene panel NGS (23%) when compared to published data indicating monosomy 10 or loss of 10q in the vast majority of glioblastomas 62. Detection of CDKN2A homozygous deletion was achieved with identical sensitivity and specificity as compared to a TaqMan® PCR‐based copy number assay. However, the overall incidence of homozygous CDKN2A deletions detected by either method in our cohort of IDH wildtype glioblastomas (10/40 tumors, 25%) was somewhat lower as compared to previous studies reporting homozygous CDKN2A deletions in more than 40% of glioblastomas 5, 43. This discrepancy may reflect an incidental finding in our small cohort or could be caused the lower sensitivity of amplification‐based techniques in primary tissue samples due to background noise caused by normal cell contamination and/or genetic heterogeneity 52.
The limited sensitivity for NGS‐based detection of the EGFRvIII deletion rearrangement based on reduced read counts for exons 2–7 on the background of highly increased read counts of the other EGFR exons (caused by EGFR gene amplification) is an additional inherent problem of the method and in line with the observation that multiplex ligation‐dependent amplification analysis, which also relies on detection of reduced gene dosages for EGFR exons 2–7 on the background of EGFR amplification, similarly suffers from a lower sensitivity compared to RT‐PCR analysis and immunohistochemistry 59. This result reflects that EGFRvIII may be restricted to small subpopulations of glioma cells, which may not suffice to cause detectable reduction of exon 2–7 gene dosage but can be readily identified at the mRNA or protein levels 59. On the other hand, gene panel NGS is a sensitive method to identify other types of EGFR mutations that may predict response to targeted pharmacological inhibition 12.
A principal limitation of our small gene panel relates to the fact that certain genetic aberrations known to contribute to the pathogenesis of less common glioma types, for example, hamartin (TSC1) or tuberin (TSC2) mutations in subependymal giant cell astrocytomas 9, v‐myb avian myeloblastosis viral homolog (MYB) or MYB‐like 2 (MYBL2) rearrangements in pediatric diffuse gliomas 66, as well as histone gene cluster 1, H3 histone family member A/B (HIST1H3A/B) and activin receptor type 1 (ACVR1) mutations in diffuse intrinsic pontine gliomas 6, 64 are not covered in our panel. In addition, several genetic aberrations restricted to smaller subsets of common glioma entities, for example, amplification of cyclin‐dependent kinase 4 and 6 (CDK4, CDK6), murine double minute gene 2 and 4 (MDM2, MDM4) and platelet‐derived growth factor receptor A (PDGFRA) in glioblastomas 62 as well as v‐ki‐ras2 Kirsten rat sarcoma viral homolog (KRAS), fibroblast growth factor receptor 1 (FGFR1) and protein‐tyrosine phophatase, nonreceptor type 11 (PTPN11) mutations in small subsets of pilocytic astrocytomas 22, cannot be assessed with our current panel. However, it would easily be possible to complement the 20‐gene panel by an additional gene panel allowing for mutational and copy number analyses of additional glioma candidate genes when diagnostically required. In addition, diagnostic assessment of the growing number of glioma‐associated fusion genes, including KIAA1549‐BRAF and other fusion genes in pilocytic astrocytomas 22, NF‐κB downstream intermediate transcription factor p65 (RELA) and YES‐associated protein 1 gene (YAP1) gene fusions in supratentorial ependymomas 32, 33, as well as the rare FGFR‐TACC 49, ARHGEF2‐NTRK1 and CHTOP‐NTRK1 in glioblastoma 67 is not possible with our small panel, but may be achieved by specifically designed panels based on genomic or transcriptomic sequencing 31, 40. Similarly, while certain potentially predictive genetic aberrations may be detected with our 20‐gene panel, comprehensive analysis of actionable mutations for future individualized therapy strategies would require sequencing of additional genes, depending on the available drugs and therapeutic options. At present, however, clinically relevant predictive markers for malignant gliomas that may guide therapeutic stratification are restricted to O6‐methylguanine DNA methyltransferase (MGMT) promoter methylation in glioblastoma patients and 1p/19q codeletion in anaplastic glioma patients 60, with the latter being reliably detectable by our gene panel NGS while MGMT promoter analysis does require independent testing.
In summary, we report on the establishment and comprehensive validation of a glioma‐tailored 20‐gene panel NGS approach for the improvement of molecular diagnostic assessment of gliomas. Our data provide proof of principle that gene panel NGS represents a robust method for the detection of diagnostic DNA aberrations in gliomas with high sensitivity and specificity. Moreover, the method is applicable to routinely processed FFPE tissue samples and thus bears great potential for facilitating future integrated glioma diagnostics as it has been proposed for the revised WHO classification 30.
Supporting information
Additional Supporting Information may be found in the online version of this article at the publisher's web‐site:
Figure S1. (A‐B) Quantitative assessment of CDKN2A gene copy numbers in various mixtures of DNA from the CDKN2A deficient glioma cell line U118MG and normal human dermal fibroblasts (NHDF) cells based on results obtained by a TaqMan® (TM) copy number assay (A) or by gene panel next generation sequencing (NGS) (B). A copy number of 2 (A) or a ratio of 0.5 (B) each corresponds to constitutional DNA with two CDKN2A copies. Data points from left to right correspond to 100% U118MG DNA, U118MG/NHDF DNA mixtures of 90:10, 80:20, 70:30, 60:40, 50:50, and 100% NHDF DNA. (C) Allele frequencies of eight distinct NHDF‐specific SNVs in the same dilution series of U118MG/NHDF DNA.
Figure S2. Comparison between ATRX mutation detected by NGS analysis and loss of nuclear ATRX expression detected by immunohistochemistry in IDH and TP53 mutant, 1p/19q non‐codeleted astrocytic gliomas. Among the 31 IDH and TP53 mutant, 1p/19q non‐codeleted tumors in our cohort, 24 (18 with and 6 without ATRX mutation) could be successfully investigated by ATRX immunohistochemistry. All 24 tumors showed loss of nuclear ATRX expression by immunohistochemistry. Exemplary immunohistochemical pictures of two tumors (AA 472, GB 2189) are shown on the right hand side. Note loss of nuclear ATRX in tumor cells but retained expression in nuclei of interspersed non‐neoplastic microglial cells and vascular cells. Both sections are counterstained with hemalum.
Figure S3. Detection of DNA sequence changes by gene panel NGS analysis in pairs of matched stereotactic biopsy and open resection specimens from two patients with anaplastic astrocytoma WHO grade III (A) or glioblastoma WHO grade IV (B). Shown are the total hematoxylin‐eosin stained stereotactic biopsy specimens from which DNA was extracted (left) and enlarged areas from these specimens demonstrating histological features of the respective tumors (middle). The tables on the right list all genetic variations detected in DNA extracted from these stereotactic biopsy specimens (STB) or corresponding open resection (OR) specimens later on obtained from the same tumors. Note that identical mutations were detected in the matched pairs of specimens from each patient except for a single PIK3CA mutation (c.G3129T, p.M1043I) detected in the stereotactic biopsy specimen but not in the open resection specimen of the anaplastic astrocytoma. Individual allele frequencies of the detected mutations in each specimen are indicated.*The TERT promoter mutation was only detected by conventional sequencing, thus mutant TERT allele frequency was not determined in this case.
Table S1. Summary of the 121 investigated gliomas with associated clinical data, histological classification according to the WHO classification 2007 [3], DNA mutations and copy number variations (CNVs) detected by gene panel NGS analysis, and integrated diagnoses considering histological features and genetic markers (IDH mutation, 1p/19q codeletion, H3F3A‐K27M mutation). Mutations in TERT hg19 chr5:g.[1295228C>T] and hg19 chr5:g.[1295250C>T] are abbreviated as TERT, g.C1295228T and g.C1295250T. Abbreviations: A II, diffuse astrocytoma WHO grade II; AA III, anaplastic astrocytoma WHO grade III; AO III, anaplastic oligodendroglioma WHO grade III; AOA III, anaplastic oligoastrocytoma WHO grade III; APXA III, anaplastic pleomorphic xanthoastrocytoma WHO grade III; GB IV, glioblastoma WHO grade IV; O II, oligodendroglioma WHO grade II; OA II, oligoastrocytoma WHO grade II; PA I, pilocytic astrocytoma WHO grade I; PXA II, pleomorphic xanthoastrocytoma WHO grade II; PXA w.a.f., PXA with anaplastic features; mut, mutant; codel, codeleted; NOS, not otherwise specified. Blue color indicates mutations/CNVs that had been previously known and were validated by gene panel NGS. Red color indicates mutations/CNVs that were newly identified by gene panel NGS and later on validated by other methods. *Cases with low coverage of the TERT promoter amplicon and validation of TERT promoter mutations by Sanger sequencing; **Anaplastic astrocytomas, IDH wildtype with glioblastoma‐associated genetic changes; ***Glioblastoma, IDH wildtype, with H3F3A‐G34 mutation. #Tumor O 71 recurred as GB IV 21 months after the first operation.§Tumor O 77 carried a 1p deletion but no 19q deletion.
Table S2. Summary of the 20 glioma‐associated candidate genes analyzed by next generation sequencing. The table provides information on the chromosomal location of each gene, the numbers of exons analyzed from each gene, the number of amplicons analyzed per gene, the number of covered or missed nucleotides per gene, and the overall coverage rate. Type indicates whether the entire coding sequence (cds) or mutational hot spot regions were investigated. n/a, not applicable.
Table S3. Summary of the genomic positions of the 660 amplicons analyzed by next generation sequencing and the respective primer sequences used for multiplex‐PCR (Chr, chromosome).
Table S4. Summary of the four GC‐rich amplicons that were originally covered by less than 20 reads on average in the sequencing runs. Note substantially increased average coverage of two of the four amplicons when using the new HiQ chemistry (AMPL3806956579, TERT; AMPL388003993, EGFR).
Table S5. Summary of sequence variations identified either in tumor DNA or in tumor and blood DNA of 14 selected glioma patients.
Table S6. Summary of potentially actionable mutations and copy number variations detected in the 52 investigated glioblastomas (WHO grade IV). *Including experimental/preclinical approaches; **including three cases with EGFRvIII identified by RT‐PCR and immunohistochemistry only.
Acknowledgments
The authors would like to thank B. Friedensdorf, C. Fleisgarten and C. Walther for excellent technical assistance. The project was supported by the German Cancer Consortium (DKTK) within the joint funding project on “Next generation molecular diagnostics of gliomas” (to G.R. and K. Kaulich). Additional support was provided by a start‐up grant from the Research Commission of the Medical Faculty of Heinrich Heine University Düsseldorf (to M.W., K. Köhrer and G.R.). A.Z. is supported by a doctoral fellowship of the Düsseldorf School of Oncology (DSO) at the University Tumor Center (UTZ) Düsseldorf.
Disclosure: G.R. has received research grants from Roche and Merck, honoraria for advisory boards or lectures from Roche, Merck Serono and Amgen. The other authors declare no conflicts of interest.
References
- 1. Adzhubei IA, Schmidt S, Peshkin L, Ramensky VE, Gerasimova A, Bork P et al (2010) A method and server for predicting damaging missense mutations. Nat Methods 7:248–249. [DOI] [PMC free article] [PubMed] [Google Scholar]
- 2. Appin CL, Brat DJ (2015) Molecular pathways in gliomagenesis and their relevance to neuropathologic diagnosis. Adv Anat Pathol 22:50–58. [DOI] [PubMed] [Google Scholar]
- 3. Bechet D, Gielen, Gerrit G H, Korshunov A, Pfister SM, Rousso C et al (2014) Specific detection of methionine 27 mutation in histone 3 variants (H3K27M) in fixed tissue from high‐grade astrocytomas. Acta Neuropathol 128:733–741. [DOI] [PMC free article] [PubMed] [Google Scholar]
- 4. Brat DJ, Verhaak, Roel G W, Aldape KD, Yung WKA, Salama SR et al (2015) Comprehensive, integrative genomic analysis of diffuse lower‐grade gliomas. N Engl J Med 372:2481–2498. [DOI] [PMC free article] [PubMed] [Google Scholar]
- 5. Brennan CW, Verhaak RGW, McKenna A, Campos B, Noushmehr H, Salama SR, Zheng S et al (2013) The somatic genomic landscape of glioblastoma. Cell 155:462–477. [DOI] [PMC free article] [PubMed] [Google Scholar]
- 6. Buczkowicz P, Hoeman C, Rakopoulos P, Pajovic S, Letourneau L, Dzamba M et al (2014) Genomic analysis of diffuse intrinsic pontine gliomas identifies three molecular subgroups and recurrent activating ACVR1 mutations. Nat Genet 46:451–456. [DOI] [PMC free article] [PubMed] [Google Scholar]
- 7. Capper D, Preusser M, Habel A, Sahm F, Ackermann U, Schindler G et al (2011) Assessment of BRAF V600E mutation status by immunohistochemistry with a mutation‐specific monoclonal antibody. Acta Neuropathol 122:11–19. [DOI] [PubMed] [Google Scholar]
- 8. Capper D, Zentgraf H, Balss J, Hartmann C, von Deimling A (2009) Monoclonal antibody specific for IDH1 R132H mutation. Acta Neuropathol 118:599–601. [DOI] [PubMed] [Google Scholar]
- 9. Chan JA, Zhang H, Roberts PS, Jozwiak S, Wieslawa G, Lewin‐Kowalik J et al (2004) Pathogenesis of tuberous sclerosis subependymal giant cell astrocytomas: biallelic inactivation of TSC1 or TSC2 leads to mTOR activation. J Neuropathol Exp Neurol 63:1236–1242. [DOI] [PubMed] [Google Scholar]
- 10. Chi AS, Batchelor TT, Dias‐Santagata D, Borger D, Stiles CD, Wang DL et al (2012) Prospective, high‐throughput molecular profiling of human gliomas. J Neurooncol 110:89–98. [DOI] [PMC free article] [PubMed] [Google Scholar]
- 11. Chun S, Fay JC (2009) Identification of deleterious mutations within three human genomes. Genome Res 19:1553–1561. [DOI] [PMC free article] [PubMed] [Google Scholar]
- 12. Cimino PJ, Bredemeyer A, Abel HJ, Duncavage EJ (2015) A wide spectrum of EGFR mutations in glioblastoma is detected by a single clinical oncology targeted next‐generation sequencing panel. Exp Mol Pathol 98:568–573. [DOI] [PMC free article] [PubMed] [Google Scholar]
- 13. Cryan JB, Haidar S, Ramkissoon LA, Bi WL, Knoff DS, Schultz N et al (2014) Clinical multiplexed exome sequencing distinguishes adult oligodendroglial neoplasms from astrocytic and mixed lineage gliomas. Oncotarget 5: 8083–8092. [DOI] [PMC free article] [PubMed] [Google Scholar]
- 14. Do H, Dobrovic A (2012) Dramatic reduction of sequence artefacts from DNA isolated from formalin‐fixed cancer biopsies by treatment with uracil–DNA glycosylase. Oncotarget 3:546–558. [DOI] [PMC free article] [PubMed] [Google Scholar]
- 15. Do H, Dobrovic A (2015) Sequence artifacts in DNA from formalin‐fixed tissues: causes and strategies for minimization. Clin Chem 61:64–71. [DOI] [PubMed] [Google Scholar]
- 16. Dubbink HJ, Atmodimedjo PN, Kros JM, French PJ, Sanson M, Idbaih A et al (2015) Molecular classification of anaplastic oligodendroglioma using next‐generation sequencing: a report of the prospective randomized EORTC Brain Tumor Group 26951 phase III trial. Neuro Oncol 18:388–400. [DOI] [PMC free article] [PubMed] [Google Scholar]
- 17. Felsberg J, Erkwoh A, Sabel MC, Kirsch L, Fimmers R, Blaschke B et al (2004) Oligodendroglial tumors: refinement of candidate regions on chromosome arm 1p and correlation of 1p/19q status with survival. Brain Pathol 14:121–130. [DOI] [PMC free article] [PubMed] [Google Scholar]
- 18. Felsberg J, Wolter M, Seul H, Friedensdorf B, Göppert M, Sabel MC, Reifenberger G (2010) Rapid and sensitive assessment of the IDH1 and IDH2 mutation status in cerebral gliomas based on DNA pyrosequencing. Acta Neuropathol 119:501–507. [DOI] [PubMed] [Google Scholar]
- 19. Grasso CS, Tang Y, Truffaux N, Berlow NE, Liu L, Debily MA et al (2015) Functionally defined therapeutic targets in diffuse intrinsic pontine glioma. Nat Med 21:555–559. [DOI] [PMC free article] [PubMed] [Google Scholar]
- 20. Hashizume R, Andor N, Ihara Y, Lerner R, Gan H, Chen X et al (2014) Pharmacologic inhibition of histone demethylation as a therapy for pediatric brainstem glioma. Nat Med 20:1394–1396. [DOI] [PMC free article] [PubMed] [Google Scholar]
- 21. Hovestadt V, Remke M, Kool M, Pietsch T, Northcott PA, Fischer R et al (2013) Robust molecular subgrouping and copy‐number profiling of medulloblastoma from small amounts of archival tumour material using high‐density DNA methylation arrays. Acta Neuropathol 125:913–916. [DOI] [PMC free article] [PubMed] [Google Scholar]
- 22. Jones DTW, Hutter B, Jäger N, Korshunov A, Kool M, Warnatz H et al (2013) Recurrent somatic alterations of FGFR1 and NTRK2 in pilocytic astrocytoma. Nat Genet 45:927–932. [DOI] [PMC free article] [PubMed] [Google Scholar]
- 23. Kannan K, Inagaki A, Silber J, Gorovets D, Zhang J, Kastenhuber ER et al (2012) Whole‐exome sequencing identifies ATRX mutation as a key molecular determinant in lower‐grade glioma. Oncotarget 3:1194–203. [DOI] [PMC free article] [PubMed] [Google Scholar]
- 24. Killela PJ, Reitman ZJ, Jiao Y, Bettegowda C, Agrawal N, Diaz LA Jr. et al (2013) TERT promoter mutations occur frequently in gliomas and a subset of tumors derived from cells with low rates of self‐renewal. Proc Natl Acad Sci USA 110:6021–6026. [DOI] [PMC free article] [PubMed] [Google Scholar]
- 25. Koelsche C, Sahm F, Wöhrer A, Jeibmann A, Schittenhelm J, Kohlhof P et al (2014) BRAF‐mutated pleomorphic xanthoastrocytoma is associated with temporal location, reticulin fiber deposition and CD34 expression. Brain Pathol 24:221–229. [DOI] [PMC free article] [PubMed] [Google Scholar]
- 26. Kumar P, Henikoff S, Ng PC (2009) Predicting the effects of coding non‐synonymous variants on protein function using the SIFT algorithm. Nat Protoc 4:1073–1081. [DOI] [PubMed] [Google Scholar]
- 27. Liu XY, Gerges N, Korshunov A, Sabha N, Khuong‐Quang DA, Fontebasso AM et al (2012) Frequent ATRX mutations and loss of expression in adult diffuse astrocytic tumors carrying IDH1/IDH2 and TP53 mutations. Acta Neuropathol 124:615–625. [DOI] [PubMed] [Google Scholar]
- 28. Livak KJ, Schmittgen TD (2001) Analysis of relative gene expression data using real‐time quantitative PCR and the 2(‐Delta Delta C(T)) Method. Methods 25:402–408. [DOI] [PubMed] [Google Scholar]
- 29. Louis DN, Ohgaki H, Wiestler OD, Cavenee WK (2007) WHO Classification of Tumours of the Central Nervous System. IARC: Lyon, pp. 13–68. [DOI] [PMC free article] [PubMed] [Google Scholar]
- 30. Louis DN, Perry A, Burger P, Ellison DW, Reifenberger G, von Deimling A et al (2014) International Society of Neuropathology—Haarlem Consensus Guidelines for Nervous System Tumor Classification and Grading. Brain Pathol 24:429–435. [DOI] [PMC free article] [PubMed] [Google Scholar]
- 31. Nikiforova MN, Wald AI, Melan MA, Roy S, Zhong S, Hamilton RL et al (2016) Targeted next‐generation sequencing panel (GlioSeq) provides comprehensive genetic profiling of central nervous system tumors. Neuro Oncol 18: 379–387. [DOI] [PMC free article] [PubMed] [Google Scholar]
- 32. Pajtler KW, Witt H, Sill M, Jones DTW, Hovestadt V, Kratochwil F et al (2015) Molecular classification of ependymal tumors across all CNS compartments, histopathological grades, and age groups. Cancer Cell 27:728–743. [DOI] [PMC free article] [PubMed] [Google Scholar]
- 33. Parker M, Mohankumar KM, Punchihewa C, Weinlich R, Dalton JD, Li Y et al (2014) C11orf95‐RELA fusions drive oncogenic NF‐κB signalling in ependymoma. Nature 506:451–455. [DOI] [PMC free article] [PubMed] [Google Scholar]
- 34. Ramkissoon SH, Bi WL, Schumacher SE, Ramkissoon LA, Haidar S, Knoff D et al (2015) Clinical implementation of integrated whole‐genome copy number and mutation profiling for glioblastoma. Neuro Oncol 17:1344–1355. [DOI] [PMC free article] [PubMed] [Google Scholar]
- 35. Reuss DE, Kratz A, Sahm F, Capper D, Schrimpf D, Koelsche C et al (2015) Adult IDH wild type astrocytomas biologically and clinically resolve into other tumor entities. Acta Neuropathol 130:407–417. [DOI] [PubMed] [Google Scholar]
- 36. Reuss DE, Sahm F, Schrimpf D, Wiestler B, Capper D, Koelsche C et al (2015) ATRX and IDH1‐R132H immunohistochemistry with subsequent copy number analysis and IDH sequencing as a basis for an “integrated” diagnostic approach for adult astrocytoma, oligodendroglioma and glioblastoma. Acta Neuropathol 129:133–146. [DOI] [PubMed] [Google Scholar]
- 37. Riemenschneider MJ, Jeuken JWM, Wesseling P, Reifenberger G (2010) Molecular diagnostics of gliomas: state of the art. Acta Neuropathol 120:567–584. [DOI] [PMC free article] [PubMed] [Google Scholar]
- 38. Robinson JT, Thorvaldsdóttir H, Winckler W, Guttman M, Lander ES, Getz G, Mesirov JP (2011) Integrative genomics viewer. Nat Biotechnol 29:24–26. [DOI] [PMC free article] [PubMed] [Google Scholar]
- 39. Sahm F, Reuss D, Koelsche C, Capper D, Schittenhelm J, Heim S et al (2014) Farewell to oligoastrocytoma: in situ molecular genetics favor classification as either oligodendroglioma or astrocytoma. Acta Neuropathol 128:551–559. [DOI] [PubMed] [Google Scholar]
- 40. Sahm F, Schrimpf D, Jones DT, Meyer J, Kratz A, Reuss D et al (2015) Next‐generation sequencing in routine brain tumor diagnostics enables an integrated diagnosis and identifies actionable targets. Acta Neuropathol [Epub ahead of print] PMID:26671409. [DOI] [PubMed] [Google Scholar]
- 41. Sampson JH, Heimberger AB, Archer GE, Aldape KD, Friedman AH, Friedman HS et al (2010) Immunologic escape after prolonged progression‐free survival with epidermal growth factor receptor variant III peptide vaccination in patients with newly diagnosed glioblastoma. J Clin Oncol 28:4722–4729. [DOI] [PMC free article] [PubMed] [Google Scholar]
- 42. Schindler G, Capper D, Meyer J, Janzarik W, Omran H, Herold‐Mende C et al (2011) Analysis of BRAF V600E mutation in 1,320 nervous system tumors reveals high mutation frequencies in pleomorphic xanthoastrocytoma, ganglioglioma and extra‐cerebellar pilocytic astrocytoma. Acta Neuropathol 121:397–405. [DOI] [PubMed] [Google Scholar]
- 43. Schmidt EE, Ichimura K, Reifenberger G, Collins VP (1994) CDKN2 (p16/MTS1) gene deletion or CDK4 amplification occurs in the majority of glioblastomas. Cancer Res 54:6321–6324. [PubMed] [Google Scholar]
- 44. Schuster J, Lai RK, Recht LD, Reardon DA, Paleologos NA, Groves MD et al (2015) A phase II, multicenter trial of rindopepimut (CDX‐110) in newly diagnosed glioblastoma: the ACT III study. Neuro Oncol 17:854–861. [DOI] [PMC free article] [PubMed] [Google Scholar]
- 45. Schumacher T, Bunse L, Pusch S, Sahm F, Wiestler B, Quandt J et al (2014) A vaccine targeting mutant IDH1 induces antitumour immunity. Nature 512:324–327. [DOI] [PubMed] [Google Scholar]
- 46. Schwartzentruber J, Korshunov A, Liu X, Jones DTW, Pfaff E, Jacob K et al (2012) Driver mutations in histone H3.3 and chromatin remodelling genes in paediatric glioblastoma. Nature 482:226–231. [DOI] [PubMed] [Google Scholar]
- 47. Serizawa M, Yokota T, Hosokawa A, Kusafuka K, Sugiyama T, Tsubosa Y et al (2015) The efficacy of uracil DNA glycosylase pretreatment in amplicon‐based massively parallel sequencing with DNA extracted from archived formalin‐fixed paraffin‐embedded esophageal cancer tissues. Cancer Genet 208:415–427. [DOI] [PubMed] [Google Scholar]
- 48. Siepel A (2006) New methods for detecting lineage‐specific selection. In: Research in Computational Molecular Biology, Vol. 3909. Hutchison D, Kanade T, Kittler J et al (eds), pp 190–205. Springer: Berlin. [Google Scholar]
- 49. Singh D, Chan JM, Zoppoli P, Niola F, Sullivan R, Castano A et al (2012) Transforming fusions of FGFR and TACC genes in human glioblastoma. Science 337:1231–1235. [DOI] [PMC free article] [PubMed] [Google Scholar]
- 50. Singh RR, Patel KP, Routbort MJ, Aldape K, Lu X, Manekia J et al (2014) Clinical massively parallel next‐generation sequencing analysis of 409 cancer‐related genes for mutations and copy number variations in solid tumours. Br J Cancer 111:2014–2023. [DOI] [PMC free article] [PubMed] [Google Scholar]
- 51. Singh RR, Patel KP, Routbort MJ, Reddy NG, Barkoh BA, Handal B et al (2013) Clinical validation of a next‐generation sequencing screen for mutational hotspots in 46 cancer‐related genes. J Mol Diag 15:607–622. [DOI] [PubMed] [Google Scholar]
- 52. Solomon DA, Kim JS, Ressom HW, Sibenaller Z, Ryken T, Jean W et al (2009) Sample type bias in the analysis of cancer genomes. Cancer Res 69:5630 – 5633. [DOI] [PMC free article] [PubMed] [Google Scholar]
- 53. Sun MZ, Oh T, Ivan ME, Clark AJ, Safaee M, Sayegh ET et al (2015) Survival impact of time to initiation of chemoradiotherapy after resection of newly diagnosed glioblastoma. J Neurosurg 122:1144–1150. [DOI] [PubMed] [Google Scholar]
- 54. Suzuki H, Aoki K, Chiba K, Sato Y, Shiozawa Y, Shiraishi Y et al Mutational landscape and clonal architecture in grade II and III gliomas. Nat Genet 47:458–468. [DOI] [PubMed] [Google Scholar]
- 55. Tabone T, Abuhusain HJ, Nowak AK; Australian Genomics and Clinical Outcome of Glioma (AGOG) Network , Erber WN, McDonald KL (2014) Multigene profiling to identify alternative treatment options for glioblastoma: a pilot study. J Clin Pathol 67:550–555. [DOI] [PubMed] [Google Scholar]
- 56. Venneti S, Santi M, Felicella MM, Yarilin D, Phillips JJ, Sullivan LM et al (2014) A sensitive and specific histopathologic prognostic marker for H3F3A K27M mutant pediatric glioblastomas. Acta Neuropathol 128:743–753. [DOI] [PMC free article] [PubMed] [Google Scholar]
- 57. Wang K, Li M, Hakonarson H (2010) ANNOVAR: functional annotation of genetic variants from high‐throughput sequencing data. Nucleic Acids Res 38:e164. [DOI] [PMC free article] [PubMed] [Google Scholar]
- 58. Weber RG, Hoischen A, Ehrler M, Zipper P, Kaulich K, Blaschke B et al (2007) Frequent loss of chromosome 9, homozygous CDKN2A/p14(ARF)/CDKN2B deletion and low TSC1 mRNA expression in pleomorphic xanthoastrocytomas. Oncogene 26:1088–1097. [DOI] [PubMed] [Google Scholar]
- 59. Weller M, Kaulich K, Hentschel B, Felsberg J, Gramatzki D, Pietsch T et al (2014) Assessment and prognostic significance of the epidermal growth factor receptor vIII mutation in glioblastoma patients treated with concurrent and adjuvant temozolomide radiochemotherapy. Int J Cancer 134:2437–2447. [DOI] [PubMed] [Google Scholar]
- 60. Weller M, van den Bent M, Hopkins K, Tonn JC, Stupp R, Falini A et al (2014) EANO guideline for the diagnosis and treatment of anaplastic gliomas and glioblastoma. Lancet Oncol 15:e395–e403. [DOI] [PubMed] [Google Scholar]
- 61. Weller M, Weber RG, Willscher E, Riehmer V, Hentschel B, Kreuz M et al (2015) Molecular classification of diffuse cerebral WHO grade II/III gliomas using genome‐ and transcriptome‐wide profiling improves stratification of prognostically distinct patient groups. Acta Neuropathol 129:679–693. [DOI] [PubMed] [Google Scholar]
- 62. Weller M, Wick W, Aldape K, Brada M, Berger M, Pfister SM et al (2015) Glioma. Nat Rev Dis Primers 1, article number 15017: 1–18. [DOI] [PubMed] [Google Scholar]
- 63. Wiestler B, Capper D, Sill M, Jones DTW, Hovestadt V, Sturm D et al (2014) Integrated DNA methylation and copy‐number profiling identify three clinically and biologically relevant groups of anaplastic glioma. Acta Neuropathol 128:561–571. [DOI] [PubMed] [Google Scholar]
- 64. Wu G, Broniscer A, McEachron TA, Lu C, Paugh BS, Becksfort J et al (2012) Somatic histone H3 alterations in pediatric diffuse intrinsic pontine gliomas and non‐brainstem glioblastomas. Nat Genet 44:251–253. [DOI] [PMC free article] [PubMed] [Google Scholar]
- 65. Yang CY, Liau JY, Huang WJ, Chang YT, Chang MC, Lee JC et al (2015) Targeted next‐generation sequencing of cancer genes identified frequent TP53 and ATRX mutations in leiomyosarcoma. Am J Transl Res 7:2072–2081. [PMC free article] [PubMed] [Google Scholar]
- 66. Zhang J, Wu G, Miller CP, Tatevossian RG, Dalton JD, Tang B et al (2013) Whole‐genome sequencing identifies genetic alterations in pediatric low‐grade gliomas. Nat Genet 45:602–612. [DOI] [PMC free article] [PubMed] [Google Scholar]
- 67. Zheng Z, Liebers M, Zhelyazkova B, Cao Y, Panditi D, Lynch KD et al (2014) Anchored multiplex PCR for targeted next‐generation sequencing. Nat Med 20:1479–1484. [DOI] [PubMed] [Google Scholar]
Associated Data
This section collects any data citations, data availability statements, or supplementary materials included in this article.
Supplementary Materials
Additional Supporting Information may be found in the online version of this article at the publisher's web‐site:
Figure S1. (A‐B) Quantitative assessment of CDKN2A gene copy numbers in various mixtures of DNA from the CDKN2A deficient glioma cell line U118MG and normal human dermal fibroblasts (NHDF) cells based on results obtained by a TaqMan® (TM) copy number assay (A) or by gene panel next generation sequencing (NGS) (B). A copy number of 2 (A) or a ratio of 0.5 (B) each corresponds to constitutional DNA with two CDKN2A copies. Data points from left to right correspond to 100% U118MG DNA, U118MG/NHDF DNA mixtures of 90:10, 80:20, 70:30, 60:40, 50:50, and 100% NHDF DNA. (C) Allele frequencies of eight distinct NHDF‐specific SNVs in the same dilution series of U118MG/NHDF DNA.
Figure S2. Comparison between ATRX mutation detected by NGS analysis and loss of nuclear ATRX expression detected by immunohistochemistry in IDH and TP53 mutant, 1p/19q non‐codeleted astrocytic gliomas. Among the 31 IDH and TP53 mutant, 1p/19q non‐codeleted tumors in our cohort, 24 (18 with and 6 without ATRX mutation) could be successfully investigated by ATRX immunohistochemistry. All 24 tumors showed loss of nuclear ATRX expression by immunohistochemistry. Exemplary immunohistochemical pictures of two tumors (AA 472, GB 2189) are shown on the right hand side. Note loss of nuclear ATRX in tumor cells but retained expression in nuclei of interspersed non‐neoplastic microglial cells and vascular cells. Both sections are counterstained with hemalum.
Figure S3. Detection of DNA sequence changes by gene panel NGS analysis in pairs of matched stereotactic biopsy and open resection specimens from two patients with anaplastic astrocytoma WHO grade III (A) or glioblastoma WHO grade IV (B). Shown are the total hematoxylin‐eosin stained stereotactic biopsy specimens from which DNA was extracted (left) and enlarged areas from these specimens demonstrating histological features of the respective tumors (middle). The tables on the right list all genetic variations detected in DNA extracted from these stereotactic biopsy specimens (STB) or corresponding open resection (OR) specimens later on obtained from the same tumors. Note that identical mutations were detected in the matched pairs of specimens from each patient except for a single PIK3CA mutation (c.G3129T, p.M1043I) detected in the stereotactic biopsy specimen but not in the open resection specimen of the anaplastic astrocytoma. Individual allele frequencies of the detected mutations in each specimen are indicated.*The TERT promoter mutation was only detected by conventional sequencing, thus mutant TERT allele frequency was not determined in this case.
Table S1. Summary of the 121 investigated gliomas with associated clinical data, histological classification according to the WHO classification 2007 [3], DNA mutations and copy number variations (CNVs) detected by gene panel NGS analysis, and integrated diagnoses considering histological features and genetic markers (IDH mutation, 1p/19q codeletion, H3F3A‐K27M mutation). Mutations in TERT hg19 chr5:g.[1295228C>T] and hg19 chr5:g.[1295250C>T] are abbreviated as TERT, g.C1295228T and g.C1295250T. Abbreviations: A II, diffuse astrocytoma WHO grade II; AA III, anaplastic astrocytoma WHO grade III; AO III, anaplastic oligodendroglioma WHO grade III; AOA III, anaplastic oligoastrocytoma WHO grade III; APXA III, anaplastic pleomorphic xanthoastrocytoma WHO grade III; GB IV, glioblastoma WHO grade IV; O II, oligodendroglioma WHO grade II; OA II, oligoastrocytoma WHO grade II; PA I, pilocytic astrocytoma WHO grade I; PXA II, pleomorphic xanthoastrocytoma WHO grade II; PXA w.a.f., PXA with anaplastic features; mut, mutant; codel, codeleted; NOS, not otherwise specified. Blue color indicates mutations/CNVs that had been previously known and were validated by gene panel NGS. Red color indicates mutations/CNVs that were newly identified by gene panel NGS and later on validated by other methods. *Cases with low coverage of the TERT promoter amplicon and validation of TERT promoter mutations by Sanger sequencing; **Anaplastic astrocytomas, IDH wildtype with glioblastoma‐associated genetic changes; ***Glioblastoma, IDH wildtype, with H3F3A‐G34 mutation. #Tumor O 71 recurred as GB IV 21 months after the first operation.§Tumor O 77 carried a 1p deletion but no 19q deletion.
Table S2. Summary of the 20 glioma‐associated candidate genes analyzed by next generation sequencing. The table provides information on the chromosomal location of each gene, the numbers of exons analyzed from each gene, the number of amplicons analyzed per gene, the number of covered or missed nucleotides per gene, and the overall coverage rate. Type indicates whether the entire coding sequence (cds) or mutational hot spot regions were investigated. n/a, not applicable.
Table S3. Summary of the genomic positions of the 660 amplicons analyzed by next generation sequencing and the respective primer sequences used for multiplex‐PCR (Chr, chromosome).
Table S4. Summary of the four GC‐rich amplicons that were originally covered by less than 20 reads on average in the sequencing runs. Note substantially increased average coverage of two of the four amplicons when using the new HiQ chemistry (AMPL3806956579, TERT; AMPL388003993, EGFR).
Table S5. Summary of sequence variations identified either in tumor DNA or in tumor and blood DNA of 14 selected glioma patients.
Table S6. Summary of potentially actionable mutations and copy number variations detected in the 52 investigated glioblastomas (WHO grade IV). *Including experimental/preclinical approaches; **including three cases with EGFRvIII identified by RT‐PCR and immunohistochemistry only.