

Abstract
Progressive aggregation of α‐synuclein (αS) from pale bodies (PBs) and extension from Lewy neurites (LNs) are candidate mechanisms for Lewy body (LB) formation. To identify how aggregation of αS is related to its extension along neurites, 60‐µm‐thick brainstem sections of Parkinson disease (PD) patients were prepared for three‐dimensional (3D) reconstruction of αS‐positive neurites with neurofilament (NF) and thiazin red (TR), a fluorochrome with an affinity to solid aggregates. This demonstrated 3D layering of αS surrounded by NF with the aggregates probed by TR in the center, corresponding to the eosinophilic core of mature LBs. This eosinophilic/TR‐positive profile, characteristically absent in PBs, premature counterpart of LBs, was similarly absent in some LNs. We would like to refer these premature LNs as “pale neurites” (PNs). Their premature nature was evidenced by 3D fluoroprofiling with quantum dots (QDs) and subsequent electron microscopic identification (3D‐oriented immunoelectron microscopy) as loosely packed αS (QDs)‐positive filaments. Quantification of LNs, frequently extended around branching axons, demonstrated that LNs are initiated at axon collaterals to extend centripetally into proximal segments. This branching‐oriented extension of αS is related to its selective predisposition to systems with highly divergent axons, preferentially affected in PD, which may explain barely somatotopic manifestations of PD.
Keywords: α‐synuclein, axon, collateral, pale neurite, Parkinson disease
INTRODUCTION
Lewy bodies (LBs), round hyaline inclusions with an eosinophilic core and peripheral halo, are hallmarks of Parkinson disease (PD) (22). Neurite abnormalities, parallel with LBs, are also found in PD (16); these are called Lewy neurites (LNs) (17). Because the appearances of LBs and LNs are quite different under conventional two‐dimensional (2D) observation, their identities and mutual relation remained speculative until α‐synuclein (αS) was identified as a shared constituent of LBs and LNs 2, 47, 48, 55. In addition to these molecular features shared between LBs and LNs, our previous three‐dimensional (3D) study of triple‐immunofluorolabeled sections for αS, ubiquitin [Ub, (34)] and neurofilament (NF) demonstrated that LBs and LNs share a three‐layered structure: more precisely, Ub at the core and NF at the outermost layer. Furthermore, each layer exhibited layer‐to‐layer continuity when LBs and LNs were contiguous (28). Because this layer‐to‐layer continuity is hardly explained if large and spherical LBs extend to form thin and slender LNs while maintaining their layer continuity, it is more probable that LNs are formed initially and extend subsequently to develop LBs. This is in agreement with previous reports that αS‐positive neurites appear earlier than LBs 5, 39 and before perikaryal immunoreactivity (43). In parallel with this extension from neurites to cell body, αS deposition is putatively initiated in its poorly aggregated form 23, 54 such as pale bodies (PBs), faintly eosinophilic inclusions displacing neuromelanin in brainstem neurons (20), to develop more solid aggregates with dense accumulation of αS‐positive fibrils as in LBs 42, 55. If these two mechanisms of αS deposition—(i) extension from neurites to cell body; and (ii) progressive aggregation—are at work to generate a variety of Lewy‐related lesions, it is expected that some LNs with poorly aggregated αS may represent a premature stage of αS deposition, while others with solid aggregates of αS may represent its mature stage. This prompted us in the present study to examine how αS is aggregated and extended in neurites on 3D basis either by observing their heterogeneity using a fluorochrome, thiazin red (TR), with an affinity to fibrillary structures such as LBs (44), or by conventional hematoxylin and eosin (H&E) staining in comparison with the 3D‐reconstructed fluorescent profile. This fluorescent profile, including that for αS, was also detectable with fluorescent nanocrystal quantum dots (QDs), and was compared with electron microscopy (EM) to identify QD‐labeled Lewy filaments 2, 23 on the same neurites. Finally, LNs, frequently extended around their branch points, were quantified by using a new tracing method to demonstrate the progressive extension of LNs in the direction from axon to cell body. This branching‐oriented extension of LNs and their relation to clinical manifestations of PD will be discussed.
MATERIALS AND METHODS
Subjects
Brainstem tissue samples from four PD patients were obtained from Yokufukai Geriatric Hospital, Tokyo, Japan. Their ages at death and gender were at 73 years old, male; 83 years old, female; 91 years old, female; and 100 years old, female. The formalin‐fixed brainstem blocks, including substantia nigra (SN), locus ceruleus (LC) or dorsal motor nucleus of vagus (DNV), were cryoprotected with 20% sucrose to obtain free‐floating sections with a thickness of 60 µm.
Double fluorolabeling of LBs and LNs and subsequent comparison with H&E or sensitive silver impregnation
In order to monitor aggregation states of αS in LBs and LNs, TR, a fluorochrome with an affinity to fibrillary structures such as LBs (44) and neurofibrillary tangles (41), was combined with immunofluorolabeling for αS (ab6162, 1:1000, sheep polyclonal, Abcam, Cambridge, MA, USA) (4), coupled with biotinylated secondary antibody to sheep IgG (1:200, donkey polyclonal, Chemicon, Temecula, CA, USA), enhanced with avidin‐biotin‐peroxidase complex (1:200, ABC Elite, Vector, Burlingame, CA, USA) and visualized with a streptavidin‐Alexa Fluor® 488 conjugate (1:200, Molecular Probes, Eugene, OR, USA). They were then stained with TR (1:10 000 for 30 minutes; Wako, Osaka, Japan). Alexa Fluor® 488, which labeled the αS epitope, was excited by a 488‐nm beam and was detected through a light path ranging from 500 to 540 nm. TR (emission peak: 620 nm) was excited by a 543‐nm beam and was detected through a light path ranging from 600 to 640 nm. Serial optical sections were obtained and stacked. After double‐stained images were digitally recorded with a laser confocal system (Leica TCS/SP5; Heidelberg, Germany), coverslips were removed and the same sections were stained using the Campbell‐Switzer silver impregnation method (CS), a sensitive method for detection of LBs 45, 51 or H&E staining with eosin Y diluted to 0.05%. It was possible to identify the same target structure so that different staining profiles (TR for aggregation, H&E for conventional appearance and CS for sensitive identification) of the same αS‐positive aggregates could be compared.
3D reconstruction of LNs triple‐labeled with αS, TR and NF
Because LNs and LBs are frequently contiguous when visualized in three dimensions (28), 3D reconstruction of multifluorolabeled sections may reveal how different staining profiles, representing molecular composition and aggregation states, are related to 3D structuring of LNs and LBs. For triple fluorolabeling, an anti‐NF antibody (SMI31, 1:1000, mouse monoclonal, SMI, Baltimore, MD, USA) was combined with the double staining for αS and TR as mentioned earlier by its introduction into primary incubation as a mixture and final visualization with an anti‐mouse IgG antibody conjugated with Alexa Fluor® 633 (1:200), excited by a 633‐nm beam and detected through a light path ranging from 640 to 670 nm. With an interval of 0.2 µm, serial optical sections at 16‐bit depth for each channel were obtained through a Plan Apochromat x63/1.4 oil objective. In order to perform 3D deconvolution, a stack of serial confocal optical sections from 100‐nm beads (TetraSpeck™ microspheres, 0.1 µm, fluorescent blue/green/orange/dark red, Molecular Probes) was sampled for each channel separately. The difference between the averaged bead image and a theoretical sphere was used for 3D deconvolution as the reference of the point spread function of the optical system. Image stacks were restored by deconvolution operating in the iterative maximum likelihood estimation mode on the software AutoDeblur® version X2.0.1 (Media Cybernetics, Bethesda, MD, USA). After deconvolution, the image stacks were reconstructed for 3D observation using TRI/3D‐SRF II® software (Ratoc, Tokyo, Japan).
3D‐oriented immunoelectron microscopy
Although the aggregation or fibrillary state of αS, represented by the staining profile including TR, may be different from point to point, we wanted to compare how these light microscopic (LM) profiles are related to electron microscopic findings. Because fluorescent nanocrystals QDs (7) are also recognizable as electron‐dense dots on ultrathin sections prepared for EM (10), immunofluorolabeled sections with QDs for 3D reconstruction at LM resolution (200 nm) of αS‐positive LBs and LNs were subsequently prepared for EM (1‐nm resolution) to compare the 3D fluorescent profiles and ultrastructure of the exactly corresponding point of interest in the same structure. The sections were incubated with the mixture of an anti‐αS antibody (ab6162, 1:1000) and an anti‐NF antibody (SMI31, 1:1000) for 7 days or longer. The sections were then incubated with a secondary antibody of Qdot® 655 rabbit anti‐goat IgG conjugate (1:100, Invitrogen, Carlsbad, CA, USA) for 5 h. After blocking with 5% normal goat serum, the anti‐NF antibody was visualized with the anti‐mouse IgG secondary antibody‐Alexa Fluor® 488 (1:200), prior to TR staining. Qdot® 655, which labeled the αS epitope, was excited by a 488‐nm beam and was detected through a light path ranging from 635 to 675 nm. After serial optical sections were digitally recorded for 3D reconstruction, holes were punched at four corners around the target LN as landmarks using a UV Laser Micro Dissection System PALM MB‐III (P.A.L.M. Microlaser Technologies, Bernried, Germany). The same section was detached from the glass slide and fixed in 2% glutaraldehyde, postfixed in 1% osmic acid solution and embedded in epon. The epon‐embedded block was trimmed so that the target LN, already digitally reconstructed as a 3D data set, was identified using the punched‐out holes as landmarks for orientation. Ultrathin sections including the target LN were stained with uranyl acetate and examined with an electron microscope H‐7650 (Hitachi High‐Technologies, Tokyo, Japan). We refer to this novel series of procedures as “3D‐oriented immunoelectron microscopy.” This method makes it possible to directly compare the ultrathin sections of the LN and the corresponding fluorescent planes of the 3D‐reconstructed LN.
Quantification of CS‐positive neurites with branchings
Because 3D reconstruction of αS‐positive neurites demonstrated frequent branchings and local swellings, formation of the neurites and their extensions were quantitatively analyzed around each branch point. Although 3D quantitative analysis is desirable, full 3D visualization of the fluorescent LNs may suffer from low sensitivity, influenced by the condition of acquisition at different depths within the 60‐µm‐thick sections, making quantification troublesome. We then decided to use the most sensitive method of CS‐silver staining so that LNs are visualized for subsequent analysis on 2D basis (4). High resolution digital micrographs (0.33 µm/pixel) overlapping each other were automatically tiled to encompass the entire 2D area of the preparation. Tiled 2D images (60 000 × 150 000 pixels for 20 × 50 mm area) at different focal depths (15 planes/60‐µm‐thick section) were then stacked to generate a “digital camera lucida‐like, high‐resolution” image of CS‐positive neurites, which made it possible to analyze all the CS‐positive neurites in the entire section (Carl Zeiss Mirax Scan, Carl Zeiss MicroImaging, Toronto, Canada). The contour of each CS‐positive neurite was operationally defined using Adobe® Photoshop® CS4 software (San Jose, CA, USA) as shown in Figure 1. The procedure of binarization was previously described (1) and is briefly summarized in the legend for Figure 1.
Figure 1.

Operational calibration and binarization of Campbell‐Switzer (CS)‐positive neurites around branching for quantification. On an 8‐bit grayscale (0 = black to 255 = white) original image, the mean intensity for CS‐positive neurites (red circles, A) and that for unstained areas (yellow circles, A) were calculated and defined as 50 and 255 to transform the entire histogram (B) to generate the calibrated image (C). The average intensity (AV) and its standard deviation (SD) of the calibrated CS‐positive neurites (green, D) were used to calculate the threshold, AV + 2SD (E), to binarize the image (F), where three angles around the branch point X were defined as α < β < γ and the segments opposite to α, β and γ were defined as segment A, B and C (gray italics), respectively (G), each representing proximal (A), distal (B) and collateral (C) axons. Intersections of each segment with a circle with a radius of 15 µm from X (red circle, H) were counted and classified as stage 0 (no intersection), stage I (one intersection), stage II (two intersections) and stage III (three intersections). Branch point X was defined as the intersection of the axial line of segment (C), with the putative surface line bridging segments A and B to separate A, B and C into segments (I). Each segment within a 30‐µm radius from the branch points (blue circle, J) was quantified for area using NIH Image J v 1.42 (National Institutes of Health, Bethesda, MD). See text for more details.
Relative orientations of three segments of CS‐positive neurites around a branch point were defined as follows. The smallest angle around a branch point was defined as α and the segment opposite to α was defined as A (Figure 1G). The largest angle was defined as γ and the segment opposite to γ was defined as C. The remaining angle and the segment were defined as β and B, respectively. The parent axon divides and gives rise, usually at right angle but occasionally at more acute angles, to several branches (9). We selected branch points with the largest angle γ, more than 150 degrees, so that segment C, opposite to the largest angle γ, was operationally defined as a collateral and segment A corresponds to the proximal segment of the parent axon and segment B corresponds to the distal segment of the parent axon. Based on the assumption that most axon collaterals branch off from the preexisting axon in the centrifugal direction towards its periphery (50), segment C was isolated first by the putative surface line bridging segments A and B. The intersection of the axial line of segment C with the surface of contiguous structure composed of segments A and B was defined as branch point X, which served as a reference to bisect segments A and B (Figure 1I).
In order to test whether neurite extension around branch points is dependent on the local orientation of these operationally defined segments A–C, the number of intersections of each segment by a circle with a radius of 15 µm from the center of X (red circle, Figure 1H) was counted. Each branch point was classified according to the number of these intersections into stage 0 (no intersection), stage I (one intersection), stage II (two intersections) and stage III (three intersections) (Figure 1H). Moreover, in order to evaluate possible differences in size among these three segments A–C, the areas of each segment within a 30‐µm radius from branch point X (blue circle, Figure 1I,J) were measured using NIH Image J version 1.42 (National Institutes of Health, Bethesda, MD, USA). The size correlation between segment A and segment B was tested with a Wilcoxon signed‐rank test. Analyses were performed with SPSS, version 18 (SPSS Japan, Tokyo, Japan).
RESULTS
Inter‐ and intraneurite heterogeneities of αS‐positive LNs
Comparison of multifluorescence images (3D reconstructed and stacked into a single 2D plane) of a variety of αS‐positive neurites with subsequent H&E‐ or CS‐stained images of the same structure (Figure 2) demonstrated that some of the αS‐positive neurites (green, Figure 2A,E and I, arrows) were fluorolabeled with TR (red, Figure 2B,F,J, arrows). Among neurites positive for both αS and TR, those with intense fluorescence of TR were so eosinophilic that they were detectable on H&E‐stained sections (Figure 2A–D, arrows). None of the TR‐negative neurites were visible on H&E‐stained sections (Figure 2A–D, arrowheads). It is possible to classify heterogeneous staining profiles of αS‐positive neurites based on this parallel TR and H&E profile into three groups: TR+/eosin (Eo) + (Figure 2A–D, arrows); TR+/Eo− (Figure 2A–D, asterisks); and TR–/Eo− (Figure 2A–D, arrowheads). In spite of these heterogeneous staining profiles with TR and H&E (interneurite heterogeneity), αS‐positive neurites were argyrophilic with CS without exception 44, 45 (Figure 2E–H, arrows and arrowheads). This heterogeneity of TR signal on different LNs was similarly observed even in different parts within a single αS‐positive contiguous neurite (intraneurite heterogeneity, Figure 2I,J, arrows and arrowheads). Regardless of this variability of TR fluorescence (Figure 2I–K, arrows and arrowheads), the entire portion of an αS‐positive neurite and intervening axon in between was intensely positive for CS (Figure 2L, arrow and arrowhead) in detail (Figure 2M–P).
Figure 2.
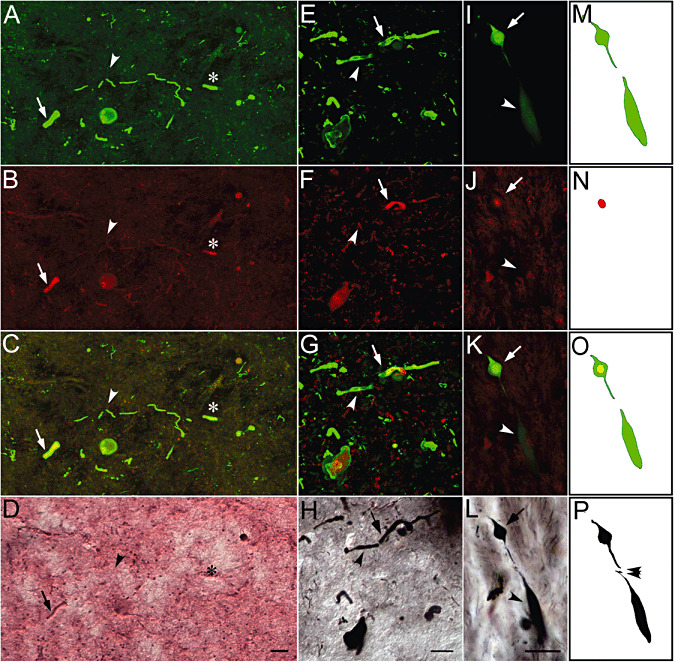
Heterogeneities of α‐synuclein (αS)‐positive neurites differentiated by thiazin red (TR), eosin and Campbell‐Switzer (CS) silver staining. Stacked series (0.5‐µm interval × 100 planes) of double‐fluorolabeled images with αS (green, A,E) and TR (red, B,F) with their merged presentations (C,G) demonstrated that TR fluorescence differed from one Lewy neurite (LN) to another; the fluorescence could be intense (arrows, A–C, E–G), negative (arrowheads, A–C, E–G) or intermediate (asterisks, A–C). LNs with intense TR fluorescence were eosinophilic (arrows, B,D), while this eosinophilic property was not discernible on LNs with negative (arrowheads, B,D) or intermediate (asterisks, B,D) TR fluorescence on the section stained with hematoxylin‐eosin (H&E, D) after fluorescence recording (A–C). In contrast, subsequent CS silver staining (H) after fluorescence recording (E–G) visualized all LNs (E–G, arrows and arrowheads) regardless of their fluorescent profiles. This variability of TR fluorescence was also observed even in different parts of a contiguous αS‐positive neurite (I–L). Although the TR signal was limited to a portion of an αS‐positive neurite (I–K, arrows), the entirety of the αS‐positive structure was intensely positive for CS (L, arrow and arrowhead) regardless of their fluorescent profiles, possibly variable even within a contiguous structure. This regional difference in fluorescent profile was more readily schematized by tracing αS (green, M), TR (red, N) and their merged representation (O) in comparison with CS staining (black, P), which can clearly detect the details of αS‐negative segment of LNs. Bars = 30 µm (D for A–D, H for E–H, L for I–P).
This intraneurite heterogeneity was further confirmed with 3D visualization, as demonstrated in Figure 3 at a higher magnification. Triple fluorolabeling for αS (green), TR (red) and NF (blue) of LNs (Figure 3A–H) demonstrated that these epitopes were stratified into concentric inner layers with TR fluorescence in the center surrounded by αS in a portion (Figure 3A–D, arrows), while this TR fluorescence was not detectable in another portion (Figure 3A–D, arrowheads). Although these two αS ‐positive portions (green) either with (arrow) and without (arrowhead) TR fluorescence (red) were independent in appearance on X‐Y views (Figure 3A–D), a lateral view of this 3D‐reconstructed LN (Figure 3E) demonstrated that they were connected (Figure 3E, asterisk) to form a contiguous complex positive for αS (green). This 3D complex was enveloped by a continuous NF‐positive structure (blue, Figure 3C,D,G).
Figure 3.
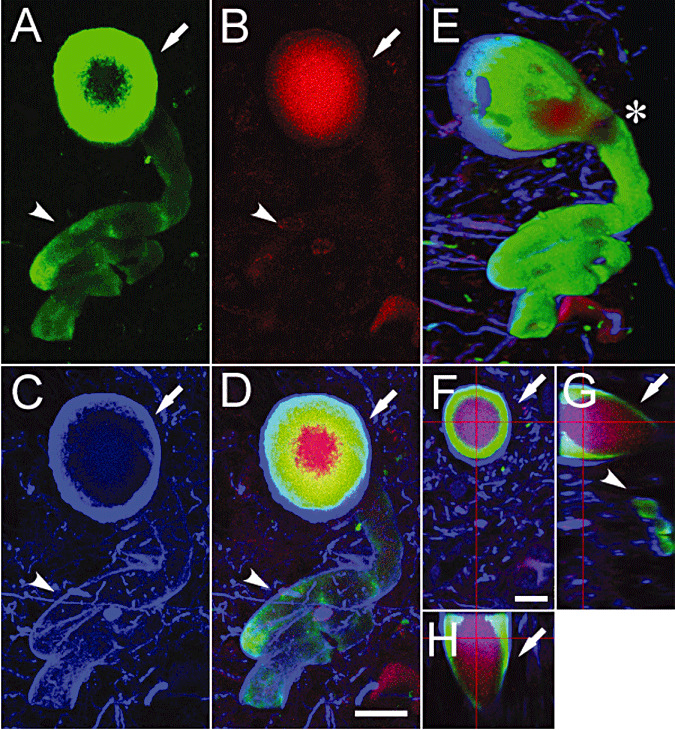
Three‐dimensional (3D) observation of Lewy neurites (LNs) triple fluorolabeled for α‐synuclein (αS), thiazin red (TR) and neurofilament (NF). Triple fluorolabeling with αS (green), TR (red) and NF (blue) showed a LN (A–H) consisting of two parts. Stacked images of serial optical sections (0.2‐µm interval × 200 planes, A–D) showed that a portion of this LN had concentric inner layers with TR fluorescence in the center surrounded by αS (green, A–D, arrows) and the other portion lacked this TR fluorescence (red, A–D, arrowheads); both portions were rimmed by the outermost layer of NF (blue, C,D). A lateral view of this LN (E), reconstructed in three dimensions showed the continuity of these two parts, which exhibited different intensities of TR fluorescence (E, asterisk). Layered structure was detectable in whatever cross‐sections of the reconstructed LN (F: X–Y; G: Y–Z; H: X–Z at depth indicated by red lines, arrows and arrowheads). Bars = 10 µm (D for A–E, F for F–H).
3D‐oriented immunoelectron microscopy to compare αS‐positive neurites with and without aggregation
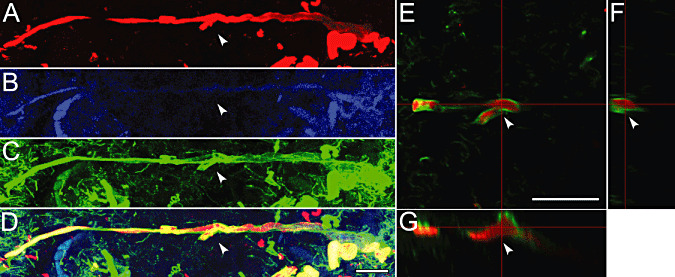
By taking advantage of the dual property (fluorescent and electron‐dense nature) of QD nanocrystals, the ultrastructure of LNs was compared with their fluorescent profiles. Because the fluorescent profiles of the LNs have already been reconstructed to form 3D datasets before processing for EM, it is possible to look for whatever LM planes (fluorescence) exactly corresponding to the ultrathin sections containing the same structure labeled by QDs. Serial optical sections of triple‐fluorolabeled LNs with an interval of 0.2 µm were stacked (Figure 4A). Cross‐sections of reconstructed LNs (Figure 4B–D) revealed that αS immunoreactivity (Figure 4E, blue labeling by QDs) was surrounded by NF (green, Figure 4G), but the TR fluorescence could be intense (red, Figure 4F, arrow) or nearly negative (Figure 4F, arrowhead), even in the same LN. This intraneurite heterogeneity was not easily recognized on stacked LNs (Figure 4A) but was readily detectable on cross‐sections (Figure 4B–D) or in 3D movies (Supporting Information Video Clip S1). After subsequent preparation of this fluorolabeled section for EM, it is possible to compare point by point the ultrastructure of LNs (Figure 4H–J) and their fluorescent profile using 3D analysis (Figure 4A–G). A TR‐positive portion (Figure 4B,E–G, arrows) was filled with electron‐dense materials (Figure 4H, arrow), while the TR‐nearly‐negative portion (Figure 4B,E–G, arrowheads) was composed of loosely aggregated, randomly oriented filaments (Figure 4I, asterisk), 10 nm in diameter with a vague outer surface. The filaments, compatible with the reported ultrastructure of Lewy filaments 2, 23, were immunolabeled with an electron‐dense core, 10 nm in diameter surrounded by a halo (Figure 4J), compatible with the reported ultrastructure and size of Qdot® 655 (13). Moreover, these immunolabeled filaments were surrounded by another type of filaments, 10 nm in diameter, running in parallel (Figure 4I, double asterisks). The latter structures were neither immunolabeled with Qdot® 655 as a fluorescent signal (Figure 4A–G) nor as electron‐dense particles (Figure 4I). Thus, the layered structure characterized by LM was confirmed by EM.
Figure 4.

Three‐dimensional (3D)‐oriented immunoelectron microscopy to show the ultrastructure of pale neurites. Serial optical sections (0.2‐µm interval × 150 planes) of Lewy neurites (LNs), triple‐fluorolabeled with anti‐α‐synuclein (αS) (labeled by Qdot® 655, blue), anti‐ neurofilament (NF) antibodies and thiazin red (TR) (red), were stacked (A). Their cross‐sectional planes (B: X–Y, C: Y–Z and D: X–Z at depth indicated by green lines) demonstrated that αS‐positive structures, one portion positive for both αS (labeled by Qdot® 655, blue, E) and TR (red, F, arrows) and another lacking TR fluorescence (F, arrowheads), were entirely rimmed by NF (green, G). The exact same area of interest (B,E,F,G) at the exact same Z plane was identified on ultrathin sections (H) for comparison with its fluorescent profile (B,E,F,G). The TR‐positive part (B,F, arrows) was filled with electron‐dense materials (H, arrow), while the TR‐negative parts were composed of filamentous materials (B,F,H, arrowheads). At a higher magnification (I) of the area indicated in H, these filaments were loosely packed and randomly oriented (I, asterisk). These were 10 nm in diameter with a vague outer surface and immunolabeled with an electron‐dense core, 10 nm in diameter surrounded by a halo (J: higher magnification of rectangle in I), compatible with the reported ultrastructure and size of Qdot® 655. These particles were mainly laid on the αS‐positive filaments, but not on NF‐positive structures (B,G, green), where there was another type of filament, 10 nm in diameter, running parallel at the periphery and surrounding the groups of the randomly oriented filaments (I, double asterisks). Bars = 10 µm (A,B for B–G, H), 50 nm (I), 20 nm (J). H–J: stained with uranyl acetate.
Branching‐oriented extension of LNs
In addition to the regional heterogeneities of staining profiles (2, 3) and of ultrastructures (Figure 4), we became aware of frequent branchings and swellings of αS‐positive neurites, sometimes enveloped by NF (Figure 5A–D, arrowheads). It is notable that the layered structure, αS enveloped by NF, was maintained even around the branch points (Figure 5E–G). Patterns of branchings and swellings were analyzed on 60‐µm‐thick sections stained with CS, the most sensitive method (Figure 2P) to yield high‐resolution images (see Materials and Methods for details). After operational binarization of the images (Figure 1A–F), relative orientation of proximal segment A, distal segment B of the parent axon and collateral C was defined according to the corresponding angles opposite to each segment (α < β < γ), respectively (Figure 1G). Around 70 branch points, 210 segments were analyzed for their extension relative to the branch point X by placing a circle with a radius of 15 µm so that an intersection of each segment with this circle could be evaluated (Figure 1H). None of the three segments (A–C) around 22 branch points intersected this circle at stage 0 (Figure 6A–C). Only one segment around 21 branch points intersected this circle (stage I, Figure 6D), two segments around 18 branch points intersected this circle (stage II, Figure 6E) and three segments around nine branch points intersected this circle (stage III, Figure 6F).
Figure 5.
Layered structures of Lewy neurites (LNs) triple‐fluorolabeled with α‐synuclein (αS), thiazin red (TR) and neurofilament (NF) were contiguous layer by layer. Stacked series (A–D) of serial optical sections (0.2‐µm interval × 100 planes), triple‐fluorolabeled with αS (red, A), TR (blue, B), NF (green, C) and merge (D), and cross‐sectional planes of 3D‐reconstructed images (E–G) demonstrated a branching of NF‐positive structures filled with αS‐positive deposits (A–G, arrowheads). Bars = 20 µm (D for A–D, E for E–G).
Figure 6.

Extension of Lewy pathology from axon collateral. Campbell‐Switzer (CS) ‐positive neurites around branch points were binarized and their local orientation was defined according to the three angles around the branch point as α < β < γ and the segments opposite to α, β and γ were defined as segments A, B, C (gray italics), respectively, putatively representing proximal, distal and collateral segments (see Materials and Methods and Figure 1 for details). None of these segments (A–C) around 22 branch points intersected the circle at stage 0 (A–C), when axonal swellings were found more frequently in segment C (15/22, 68.2%, C) than in segments A and B[A,B, chi‐square goodness of fit degrees of freedom (d.f.) = 1, χ2 = 12.023, P = 0.001]. The number of intersections was one (stage I, D) around 21 branch points, two (stage II, E) around 18 branch points and three (stage III, F) around nine branch points. Bars = 20 µm (F for A–F).
In stage 0, axonal swellings were found more frequently in segment C (15/22, 68.2%, Figure 6C) than in segments A and B (Figure 6A,B). Chi‐square goodness of fit revealed the significance of deviation of the distribution of the largest areas (d.f. = 1, χ2 = 12.023, P = 0.001), suggesting the preferential swelling of segment C at an initial stage of CS‐positive material deposition. To test whether the progressive enlargement is different between segment A and segment B, they were compared for area in each stage (Figure 7A,B). This difference was not significant (Wilcoxon signed‐rank test, P = 0.879, stage 0 and P = 0.139, stage III, Figure 7B) at stages 0 and III with significant correlation between them (r = 0.692, P < 0.01, stage 0 and r = 0.807, P < 0.01, stage III, Figure 7A). In stages I and II, by contrast, the area of segment A was larger than that of segment B (Wilcoxon signed‐rank test, P < 0.05, Figure 7B) with no (r = −0.43, stage I, Figure 7A) or limited correlation (r = 0.56, P < 0.05, stage II, Figure 7A), suggesting preferential extension of neurites into proximal segment A after initial deposition in collateral segment C.
Figure 7.
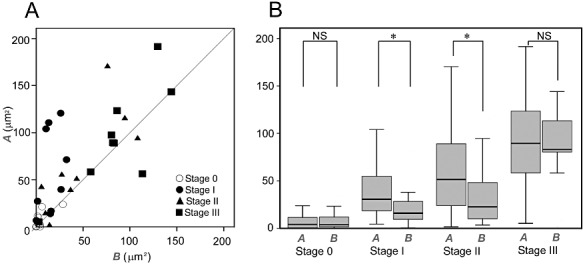
Centripetal extension of Lewy pathology to the proximal segment. Comparison between segments A and B (B) demonstrated significant deviation to segment A over B in stages I and II (Wilcoxon signed‐rank test, P < 0.05, B) with no (r = −0.43, stage I, A) or limited correlation (r = 0.56, P < 0.05, stage II, A) between them, while this deviation was not significant (Wilcoxon signed‐rank test, P = 0.879, stage 0 and P = 0.139, stage III, B) in stages 0 and III with significant correlation between them (r = 0.692, P < 0.01, stage 0 and r = 0.807, P < 0.01, stage III, A).
DISCUSSION
Pale neurites evolve into LNs with progressive aggregation of αS
Double fluorolabeling (αS/TR) followed by H&E or CS silver impregnation is a powerful combination of methods for comparing the extended staining profile of each target structure for their 2D qualitative evaluation 44, 51, which we expanded to 3D analysis in the present study. Comparison of the stacked images clarified that CS stained all αS‐positive neurites, including their contiguous αS‐negative portion (Figure 2E–P, arrowheads and double arrowheads), as previously reported 4, 51. TR fluorescence was limited to some LNs (Figure 2A–C, arrows and asterisks), and eosinophilic property was further limited to some TR‐positive LNs (Figure 2A–C, arrows). This hierarchy of staining profile (CS > αS >> TR > Eo) may represent a heterogeneity of LNs (interneurite heterogeneity) corresponding to different phases of LN formation. If PBs represent a premature state of LBs, CS‐positive LNs without TR fluorescence or eosinophilic properties similarly correspond to a premature state prior to eosinophilic LNs. It would be natural to call this premature state of LN formation “pale neurites” as a neuritic counterpart of PBs to represent an early change of αS deposition.
This hierarchy of extended staining profile (CS > αS >> TR > Eo), observed in different LNs, was similarly reproduced even within continuous LNs, where TR fluorescence was restricted to some portions of αS‐positive LN (Figure 2J,K, arrows). This may represent a heterogeneity (intraneurite heterogeneity) corresponding to different phases of aggregation even within a single LN (Figure 2I–L). This intraneurite heterogeneity was confirmed further using 3D visualization of continuous αS‐positive deposits (Figure 3A–H).
3D‐oriented immunoelectron microscopy to detect ultrastructural changes of pale neurites
3D‐oriented immunoelectron microscopy is a novel technique, which enables the bridging LM (3D data set with multiple fluorescence) and EM findings of the same structure 29, 30. This bridging was possible for the first time on 2D data by taking advantage of the dual nature of QDs (10), which are not only brightly fluorescent but also electron‐dense. This parallel bridging is applicable to even 3D reconstruction (fluorescence, LM) of the target LN and its subsequent processing for EM to accurately compare the same structure by these two different methods.
With this novel technique, it is now possible to identify two contrasting portions either with an intense TR fluorescence (Figure 4B,E–G, arrows) or without (Figure 4B,E–G, arrowheads) TR fluorescence, but within a continuous LN for immunoelectron microscopy. In contrast to the amorphous electron‐dense materials (Figure 4H, arrow) in an LN segment with intense TR fluorescence (Figure 4F, arrow), another portion without TR fluorescence (Figure 4F, arrowhead) contained a small number of loosely packed and randomly oriented filaments with a diameter of 10 nm (Figure 4I, asterisk), compatible with Lewy filaments 2, 23. Although similar EM findings have been reported as representative of PBs 23, 55, this is the first demonstration of a neuritic counterpart (pale neurites) of PBs, precisely characterized by LM. Moreover, the identity of the immunolabeling by QDs on the same filaments (Figure 4I, rectangle) was corroborated not only by their characteristic size and surrounding halo of QDs (Figure 4J) but also by its concordance with its fluorescence (blue, Figure 4E) and finally by the contrast with another epitope on distinct types of filaments (NF, Figure 4G, green, Figure 4I, double asterisks) as a negative control within the same EM field. It is plausible that these αS‐positive Lewy filaments, even small in quantity, represent an early ultrastructural change of αS deposition in neurites.
Lewy pathology from axon collateral and its centripetal extension
It has been reported that αS‐positive neurites appear earlier than LBs (5) or than perikaryal immunoreactivity (43). In the present study, we clarified that a more premature form of LNs appears to represent an early change of αS deposition. However, it is not yet clear where and how LNs extend along axons. Because careful 3D observations identified frequent branchings of LNs (Figure 5), we tried to identify how LNs evolve around branch points. Because CS silver impregnation is most sensitive to detect Lewy‐related pathology including PBs and neurites 44, 45, 51 but do not label normal axons (49), CS‐positive neurites around branch points were quantified for their extension in two ways. Contiguous extension of CS‐positive neurites around the branch points was first classified into stages 0, I, II and III according to the number of segments (0, 1, 2 and 3, respectively) extending more than 15 µm from each branch point (Figure 1H). It was collateral segment C (Figure 6C) where swelling was most frequent at its earliest stage (stage 0). Subsequent extension was more accentuated in proximal segment A than in distal segment B in stages I and II (6, 7), while this difference was not significant in the last stage (stage III, 6, 7). Taken together, it is plausible that initial αS deposition most frequently occurs at the collateral segment C (stage 0, Figure 8A). Subsequent extension was preferentially directed centripetally to proximal segment A (stages I and II, 7, 8), while this difference between segments A and B was not significant in the last stage (stage III, 7, 8).
Figure 8.
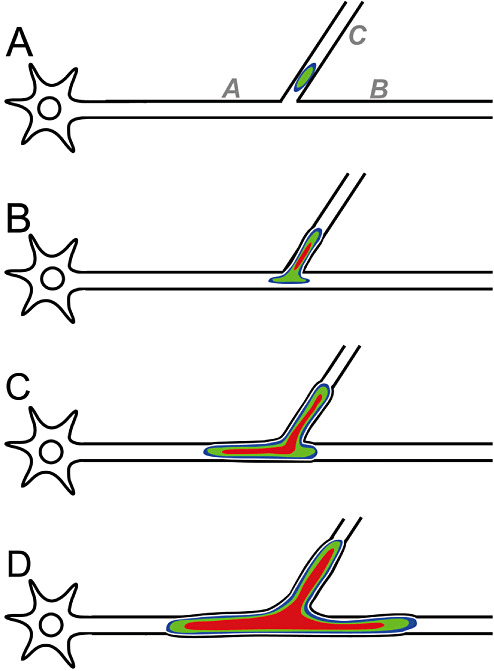
Centripetal evolution of Lewy neurites (LNs) from the axon collateral to the proximal segment. Layered structure with neurofilament (NF) (blue) surrounding α‐synuclein (αS) (green) with or without thiazin red (TR) (red) in the center is consistent even around the branch point. Deposition of αS in collateral (A) as an initial stage, followed by extension and aggregation in the center (B). At some stages, LNs extend preferentially into proximal segment (C), followed by further enlargement (D).
Similar centripetal extension has been suspected in the cardiac sympathetic nerve of PD patients based on the early accumulation of αS in the distal axons followed by subsequent centripetal extension to sympathetic ganglia (39). Our morphometric approach, focused around branched LNs, clarified for the first time that initial accumulation of CS‐positive materials in collateral segment C is followed by contiguous centripetal extension to proximal segment A (Figure 8). Moreover, early accumulation of αS in some tyrosine hydroxylase (TH)‐positive axon terminals of the neostriatum 38, 46 may represent initial involvement of distal axons in PD (14). Furthermore, preferential accumulation of αS in pathologically altered synaptic components suggests accentuated involvement of synapses, the distal ends of axons, in PD 18, 32. This “distal‐dominant” nature of αS deposition is a feature of the selective degeneration of the nigrostriatal system projecting from the ventrolateral part of the SN in PD. For example, more pronounced loss of axon terminals in the striatum with relative preservation of SN dopaminergic neurons (3) and a decrease in TH immunoreactivity even in presymptomatic LB disease (12) may represent “the distal‐dominant” nature of nigrostriatal degeneration in the human brain with PD as well. Furthermore, artificial overexpression of wild‐type or A53T‐mutated αS in primate ventral midbrain reproduced axonal degeneration earlier than cell loss (15). These lines of evidence strongly suggest that axonal involvement by αS is initiated at its distal end to extend centripetally.
In addition to this centripetal extension of αS, our morphometric approach clarified that this extension of αS deposits is guided by branching. If axonal αS deposition is oriented by its branching: (i) highly divergent axons might be more susceptible to αS deposition as a whole; and (ii) axonal segments distal to branching may be more vulnerable than their proximal counterparts to engender “distal‐dominant” nature of axonal degeneration, which is theoretically enhanced in systems with highly divergent axons. Indeed, single‐cell labeling study has clarified that the axons originated from neurons in the ventrolateral part of the SN, one of the most vulnerable subsystems, are highly collateralized (36) within the dorsolateral part of the striatum (40). This underlying anatomical background may explain the selective involvement of this system leading to preferential loss of dopamine in the dorsolateral putamen (3). It is interesting that this “distal‐dominant” nature (8) of nigrostriatal degeneration (19) has been similarly reproduced in monkeys treated with 1‐methyl‐4‐phenyl‐1,2,3,6‐tetrahydropyridine (MPTP). Because MPTP is metabolized to MPP+, which is taken up through dopamine transporters at axon terminals (27), its retrograde transport (25) may account for the selective loss of dopaminergic neurons in the SN (24). In contrast with this superselective nature of dopaminergic nigrostriatal pathology induced by MPTP, αS‐related pathologies in the human brain are not restricted to the nigrostriatal system but are also found in other subcortical nuclei. It is interesting that these subcortical nuclei with αS‐related pathologies are characterized by highly extended projections, while the relevant neurotransmitters and targets of projection are variable and include cortex 21, 33, 37, 52, striatum (36), spinal cord (52), the autonomic nervous system (26) and the enteric nervous system 6, 53. Even if some toxic external substances, such as MPTP (6) or αS itself 31, 35, 56, are taken up to propagate degeneration (6), this anatomical feature may further enhance the selectivity of degeneration and may also facilitate the so‐called “distal‐dominant” nature of these lesions.
Clinical manifestations of PD include troubles in motor and emotional initiations, disturbances in sleep, mood, attention or autonomic nervous system and cognitive impairments. These generalized and barely somatotopic clinical features of PD may be related to highly divergent axons projecting to extended areas of the nervous system, which are preferentially affected in PD as clarified by the present study. If these early αS lesions in distal portion of highly divergent axons are sufficient for clinical manifestations to develop (11), we then have a means to identify PD patients at an early stage, before the loss of neurons becomes irreversible. Although deposition of αS is central to the pathogenesis of PD, how these systems with highly divergent axons precipitate αS deposits to engender characteristic clinical features is another essential issue to be clarified in order to better understand the mechanisms of αS‐related degeneration in PD and to provide improved therapeutic strategies before neurons are depleted.
Supporting information
Video Clip S1. 3D reconstructed fluorescent image of Lewy neurites (Figure 4) before being processed for immunoelectron microscopy.
Supporting info item
ACKNOWLEDGMENTS
We thank Dr Atsushi Takahashi (Department of Organ Pathology, Yokufukai Geriatric Hospital) for providing tissue samples. The authors are grateful to Ms Kyoko Ajiki for her excellent technical assistance. This study (TU) was supported by Grants‐in‐Aid for Scientific Research (22500325) from the Ministry of Education, Culture, Sports, Science and Technology, the Mitsui Life Social Welfare Foundation and the Tokyo Metropolitan Organization for Medical Research “Mechanism for Early Diagnosis and Prevention of Parkinson Disease”.
REFERENCES
- 1. Amino T, Orimo S, Itoh Y, Takahashi A, Uchihara T, Mizusawa H (2005) Profound cardiac sympathetic denervation occurs in Parkinson disease. Brain Pathol 15:29–34. [DOI] [PMC free article] [PubMed] [Google Scholar]
- 2. Arima K, Uéda K, Sunohara N, Hirai S, Izumiyama Y, Tonozuka‐Uehara H, Kawai M (1998) Immunoelectron‐microscopic demonstration of NACP/alpha‐synuclein‐epitopes on the filamentous component of Lewy bodies in Parkinson's disease and in dementia with Lewy bodies. Brain Res 808:93–100. [DOI] [PubMed] [Google Scholar]
- 3. Bernheimer H, Birkmayer W, Hornykiewicz O, Jellinger K, Seitelberger F (1973) Brain dopamine and the syndromes of Parkinson and Huntington. Clinical, morphological and neurochemical correlations. J Neurol Sci 20:415–455. [DOI] [PubMed] [Google Scholar]
- 4. Braak H, Sandmann‐Keil D, Gai WP, Braak E (1999) Extensive axonal Lewy neurites in Parkinson's disease: a novel pathological feature revealed by alpha‐synuclein immunocytochemistry. Neurosci Lett 265:67–69. [DOI] [PubMed] [Google Scholar]
- 5. Braak H, Del Tredici K, Rüb U, de Vos RAI, Jansen Steur ENH, Braak E (2003) Staging of brain pathology related to sporadic Parkinson's disease. Neurobiol Aging 24:197–211. [DOI] [PubMed] [Google Scholar]
- 6. Braak H, de Vos RAI, Bohl J, Del Tredici K (2006) Gastric α‐synuclein immunoreactive inclusions in Meissner's and Auerbach's plexuses in cases staged for Parkinson's disease‐related brain pathology. Neurosci Lett 396:67–72. [DOI] [PubMed] [Google Scholar]
- 7. Bruchez M Jr, Moronne M, Gin P, Weiss S, Alivisatos AP (1998) Semiconductor nanocrystals as fluorescent biological labels. Science 281:2013–2016. [DOI] [PubMed] [Google Scholar]
- 8. Burns RS, Chiueh CC, Markey SP, Ebert MH, Jacobowitz DM, Kopin IJ (1983) A primate model of parkinsonism: selective destruction of dopaminergic neurons in the pars compacta of the substantia nigra by N‐methyl‐4‐phenyl‐1,2,3,6‐tetrahydropyridine. Proc Natl Acad Sci USA 80:4546–4550. [DOI] [PMC free article] [PubMed] [Google Scholar]
- 9. Cajal SR (1972) Histologie du Système Nerveux de L'homme et Des Vertébrés. p. 74. Consejo Superior de Investigaciones Científicas, Madrid: Madrid. [Google Scholar]
- 10. Chan WC, Nie S (1998) Quantum dot bioconjugates for ultrasensitive nonisotopic detection. Science 281:2016–2018. [DOI] [PubMed] [Google Scholar]
- 11. Coleman MP, Perry VH (2002) Axon pathology in neurological disease: a neglected therapeutic target. Trends Neurosci 25:532–537. [DOI] [PubMed] [Google Scholar]
- 12. Dickson DW, Fujishiro H, DelleDonne A, Menke J, Ahmed Z, Klos KJ et al (2008) Evidence that incidental Lewy body disease is pre‐symptomatic Parkinson's disease. Acta Neuropathol 115:437–444. [DOI] [PubMed] [Google Scholar]
- 13. Dubertret B, Skourides P, Norris DJ, Noireaux V, Brivanlou AH, Libchaber A (2002) In vivo imaging of quantum dots encapsulated in phospholipid micelles. Science 298:1759–1762. [DOI] [PubMed] [Google Scholar]
- 14. Duda JE, Giasson BI, Mabon ME, Lee VM‐Y, Trojanowski JQ (2002) Novel antibodies to synuclein show abundant striatal pathology in Lewy body disease. Ann Neurol 52:205–210. [DOI] [PubMed] [Google Scholar]
- 15. Eslamboli A, Romero‐Ramos M, Burger C, Bjorklund T, Muzyczka N, Mandel RJ et al (2007) Long‐term consequences of human alpha‐synuclein overexpression in the primate ventral midbrain. Brain 130:799–815. [DOI] [PubMed] [Google Scholar]
- 16. Gai WP, Blessing WW, Blumbergs PC (1995) Ubiquitin‐positive degenerating neurites in the brainstem in Parkinson's disease. Brain 118:1447–1459. [DOI] [PubMed] [Google Scholar]
- 17. Gai WP, Blumbergs PC, Blessing WW (1996) Microtubule‐associated protein 5 is a component of Lewy bodies and Lewy neurites in the brainstem and forebrain regions affected in Parkinson's disease. Acta Neuropathol 91:78–81. [DOI] [PubMed] [Google Scholar]
- 18. Garcia‐ Reitböck P, Anichtchik O, Bellucci A, Iovino M, Ballini C, Fineberg E et al (2010) SNARE protein redistribution and synaptic failure in a transgenic mouse model of Parkinson's disease. Brain 133:2032–2044. [DOI] [PMC free article] [PubMed] [Google Scholar]
- 19. German DC, Dubach M, Askari S, Speciale SG, Bowden DM (1988) 1‐Methyl‐4‐phenyl‐1,2,3,6‐tetrahydropyridine‐induced parkinsonian syndrome in Macaca fascicularis: which midbrain dopaminergic neurons are lost? Neuroscience 24:161–174. [DOI] [PubMed] [Google Scholar]
- 20. Gibb WRG, Scott T, Lees AJ (1991) Neuronal inclusions of Parkinson's disease. Mov Disord 6:2–11. [DOI] [PubMed] [Google Scholar]
- 21. Gold PW (2005) The neurobiology of stress and its relevance to psychotherapy. Clin Neurosci Res 4:315–324. [Google Scholar]
- 22. Greenfield JG, Bosanquet FD (1953) The brain‐stem lesions in Parkinsonism. J Neurol Neurosurg Psychiatry 16:213–226. [DOI] [PMC free article] [PubMed] [Google Scholar]
- 23. Hayashida K, Oyanagi S, Mizutani Y, Yokochi M (1993) An early cytoplasmic change before Lewy body maturation: an ultrastructural study of the substantia nigra from an autopsy case of juvenile parkinsonism. Acta Neuropathol 85:445–448. [DOI] [PubMed] [Google Scholar]
- 24. Herkenham M, Little MD, Bankiewicz K, Yang S‐C, Markey SP, Johannessen JN (1991) Selective retention of MPP+ within the monoaminergic systems of the primate brain following MPTP administration: an in vivo autoradiographic study. Neuroscience 40:133–158. [DOI] [PubMed] [Google Scholar]
- 25. Imai H, Nakamura T, Endo K, Narabayashi H (1988) Hemiparkinsonism in monkeys after unilateral caudate nucleus infusion of 1‐methyl‐4‐phenyl‐1,2,3,6‐tetrahydropyridine (MPTP): behavior and histology. Brain Res 474:327–332. [DOI] [PubMed] [Google Scholar]
- 26. Jarvinen MK, Powley TL (1999) Dorsal motor nucleus of the vagus neurons: a multivariate taxonomy. J Comp Neurol 403:359–377. [PubMed] [Google Scholar]
- 27. Javitch JA, D'Amato RJ, Strittmatter SM, Snyder S (1985) Parkinsonism‐inducing neurotoxin, N‐methyl‐4‐phenyl‐1,2,3,6‐tetrahydropyridine: uptake of the metabolite N‐methyl‐4‐phenylpyridine by dopamine neurons explains selective toxicity. Proc Natl Acad Sci USA 82:2173–2177. [DOI] [PMC free article] [PubMed] [Google Scholar]
- 28. Kanazawa T, Uchihara T, Takahashi A, Nakamura A, Orimo S, Mizusawa H (2008) Three‐layered structure shared between Lewy bodies and Lewy neurites‐three‐dimensional reconstruction of triple‐labeled sections. Brain Pathol 18:415–422. [DOI] [PMC free article] [PubMed] [Google Scholar]
- 29. Kawai Y, Takagi H, Kumoi Y, Shiosaka S, Tohyama M (1987) Nigrostriatal dopamine neurons receive substance P‐ergic inputs in the substantia nigra: application of the immunoelectron microscopic mirror technique to fluorescent double‐staining for transmitter‐specific projections. Brain Res 401:371–376. [DOI] [PubMed] [Google Scholar]
- 30. Kireev I, Lakonishok M, Liu W, Joshi VN, Powell R, Belmont AS (2008) In vivo immunogold labeling confirms large‐scale chromatin folding motifs. Nat Methods 5:311–313. [DOI] [PubMed] [Google Scholar]
- 31. Kordower JH, Chu Y, Hauser RA, Freeman TB, Olanow CW (2008) Lewy body‐like pathology in long‐term embryonic nigral transplants in Parkinson's disease. Nat Med 14:504–506. [DOI] [PubMed] [Google Scholar]
- 32. Kramer ML, Schulz‐Schaeffer WJ (2007) Presynaptic alpha‐synuclein aggregates, not Lewy bodies, cause neurodegeneration in dementia with Lewy bodies. J Neurosci 27:1405–1410. [DOI] [PMC free article] [PubMed] [Google Scholar]
- 33. Krettek JE, Price JL (1977) Projections from the amygdaloid complex to the cerebral cortex and thalamus in the rat and cat. J Comp Neurol 172:687–722. [DOI] [PubMed] [Google Scholar]
- 34. Kuzuhara S, Mori H, Izumiyama N, Yoshimura M, Ihara Y (1988) Lewy bodies are ubiquitinated. A light and electron microscopic immunocytochemical study. Acta Neuropathol 75:345–353. [DOI] [PubMed] [Google Scholar]
- 35. Li JY, Englund E, Holton JL, Soulet D, Hagell P, Lees AJ et al (2008) Lewy bodies in grafted neurons in subjects with Parkinson's disease suggest host‐to‐graft disease propagation. Nat Med 14:501–503. [DOI] [PubMed] [Google Scholar]
- 36. Matsuda W, Furuta T, Nakamura KC, Hioki H, Fujiyama F, Arai R, Kaneko T (2009) Single nigrostriatal dopaminergic neurons form widely spread and highly dense axonal arborizations in the neostriatum. J Neurosci 29:444–453. [DOI] [PMC free article] [PubMed] [Google Scholar]
- 37. Mesulam MM, Mufson EJ, Levey AI, Wainer BH (1983) Cholinergic innervation of cortex by the basal forebrain: cytochemistry and cortical connections of the septal area, diagonal band nuclei, nucleus basalis (substantia innominata), and hypothalamus in the rhesus monkey. J Comp Neurol 214:170–197. [DOI] [PubMed] [Google Scholar]
- 38. Mori F, Tanji K, Zhang H, Kakita A, Takahashi H, Wakabayashi K (2008) α‐synuclein pathology in the neostriatum in Parkinson's disease. Acta Neuropathol 115:453–459. [DOI] [PubMed] [Google Scholar]
- 39. Orimo S, Uchihara T, Nakamura A, Mori F, Kakita A, Wakabayashi K, Takahashi H (2008) Axonal α‐synuclein aggregates herald centripetal degeneration of cardiac sympathetic nerve in Parkinson's disease. Brain 131:642–650. [DOI] [PubMed] [Google Scholar]
- 40. Parent M, Parent A (2006) Relationship between axonal collateralization and neuronal degeneration in basal ganglia. J Neural Transm 70(Suppl.):85–88. [DOI] [PubMed] [Google Scholar]
- 41. Resch JF, Scott Lehr G, Wischik CM (1991) Design and synthesis of a potential affinity/cleaving reagent for beta‐pleated sheet protein structures. Bioorganic Med Chem Lett 1:519–522. [Google Scholar]
- 42. Roy S, Wolman L (1969) Ultrastructural observations in parkinsonism. J Path 99:39–43. [DOI] [PubMed] [Google Scholar]
- 43. Saito Y, Kawashima A, Ruberu NN, Fujiwara H, Koyama S, Sawabe M et al (2003) Accumulation of phosphorylated α‐synuclein in aging human brain. J Neuropathol Exp Neurol 62:644–654. [DOI] [PubMed] [Google Scholar]
- 44. Sakamoto M, Uchihara T, Hayashi M, Nakamura A, Kikuchi E, Mizutani T et al (2002) Heterogeneity of nigral and cortical Lewy bodies differentiated by amplified triple‐labeling for alpha‐synuclein, ubiquitin, and thiazin red. Exp Neurol 177:88–94. [DOI] [PubMed] [Google Scholar]
- 45. Sandmann‐Keil D, Braak H, Okochi M, Haass C, Braak E (1999) Alpha‐synuclein immunoreactive Lewy bodies and Lewy neurites in Parkinson's disease are detectable by an advanced silver‐staining technique. Acta Neuropathol 98:461–464. [DOI] [PubMed] [Google Scholar]
- 46. Shoji M, Harigaya Y, Sasaki A, Uéda K, Ishiguro K, Matsubara E et al (2000) Accumulation of NACP/α‐synuclein in Lewy body disease and multiple system atrophy. J Neurol Neurosurg Psychiatry 68:605–608. [DOI] [PMC free article] [PubMed] [Google Scholar]
- 47. Spillantini MG, Schmidt ML, Lee VM‐Y, Trojanowski JQ, Jakes R, Goedert M (1997) Alpha‐synuclein in Lewy bodies. Nature 388:839–840. [DOI] [PubMed] [Google Scholar]
- 48. Spillantini MG, Crowther RA, Jakes R, Hasegawa M, Goedert M (1998) alpha‐Synuclein in filamentous inclusions of Lewy bodies from Parkinson's disease and dementia with lewy bodies. Proc Natl Acad Sci USA 95:6469–6473. [DOI] [PMC free article] [PubMed] [Google Scholar]
- 49. Switzer RC (2000) Application of silver degeneration stains for neurotoxicity testing. Toxicol Pathol 28:70–83. [DOI] [PubMed] [Google Scholar]
- 50. Szebenyi G, Callaway JL, Dent EW, Kalil K (1998) Interstitial branches develop from active regions of the axon demarcated by the primary growth cone during pausing behaviors. J Neurosci 18:7930–7940. [DOI] [PMC free article] [PubMed] [Google Scholar]
- 51. Uchihara T (2007) Silver diagnosis in neuropathology: principles, practice and revised interpretation. Acta Neuropathol 113:483–499. [DOI] [PMC free article] [PubMed] [Google Scholar]
- 52. Ungerstedt U (1971) Stereotaxic mapping of the monoamine pathways in the rat brain. Acta Physiol Scand Suppl 367:1–48. [DOI] [PubMed] [Google Scholar]
- 53. Wakabayashi K, Takahashi H, Ohama E, Ikuta F (1990) Parkinson's disease: an immunohistochemical study of Lewy body‐containing neurons in the enteric nervous system. Acta Neuropathol 79:581–583. [DOI] [PubMed] [Google Scholar]
- 54. Wakabayashi K, Matsumoto K, Takayama K, Yoshimoto M, Takahashi H (1997) NACP, a presynaptic protein, immunoreactivity in Lewy bodies in Parkinson's disease. Neurosci Lett 239:45–48. [DOI] [PubMed] [Google Scholar]
- 55. Wakabayashi K, Hayashi S, Kakita A, Yamada M, Toyoshima Y, Yoshimoto M et al (1998) Accumulation of alpha‐synuclein/NACP is a cytopathological feature common to Lewy body disease and multiple system atrophy. Acta Neuropathol 96:445–452. [DOI] [PubMed] [Google Scholar]
- 56. Yazawa I, Giasson BI, Sasaki R, Zhang B, Joyce S, Uryu K et al (2005) Mouse model of multiple system atrophy alpha‐synuclein expression in oligodendrocytes causes glial and neuronal degeneration. Neuron 45:847–859. [DOI] [PubMed] [Google Scholar]
Associated Data
This section collects any data citations, data availability statements, or supplementary materials included in this article.
Supplementary Materials
Video Clip S1. 3D reconstructed fluorescent image of Lewy neurites (Figure 4) before being processed for immunoelectron microscopy.
Supporting info item