Abstract
The macrophage migration inhibitory factor (MIF) receptor CD74 is overexpressed in various neoplasms, mainly in hematologic tumors, and currently investigated in clinical studies. CD74 is quickly internalized and recycles after antibody binding, therefore it constitutes an attractive target for antibody‐based treatment strategies. CD74 has been further described as one of the most up‐regulated molecules in human glioblastomas. To assess the potential relevance for anti‐CD74 treatment, we determined the cellular source and clinicopathologic relevance of CD74 expression in human gliomas by immunohistochemistry, immunofluorescence, immunoblotting, cell sorting analysis and quantitative polymerase chain reaction (qPCR). Furthermore, we fractionated glioblastoma cells and glioma‐associated microglia/macrophages (GAMs) from primary tumors and compared CD74 expression in cellular fractions with whole tumor lysates. Our results show that CD74 is restricted to GAMs in vivo, while being absent in tumor cells, the latter strongly expressing its ligand MIF. Most interestingly, a higher amount of CD74‐positive GAMs was associated with beneficial patient survival constituting an independent prognostic parameter and with an anti‐tumoral M1 polarization. In summary, CD74 expression in human gliomas is restricted to GAMs and positively associated with patient survival. In conclusion, CD74 represents a positive prognostic marker most probably because of its association with an M1‐polarized immune milieu in high‐grade gliomas.
Keywords: CD74, glioma, immune polarization, MIF
Introduction
In diffusely infiltrating high‐grade astrocytomas, the overall survival in population‐based studies is dismal despite maximum treatment including surgical resection followed by radio‐ and chemotherapy 23, 33. The pro‐tumorigenic molecule macrophage migration inhibitory factor (MIF) exerts multimodal functions in glioblastoma including pro‐proliferative, pro‐migratory, pro‐angiogenic as well as immune‐evasive properties 4, 5, 22. In combination with the availability of small molecules acting as MIF inhibitors, MIF represents a promising target in future glioma treatment 1, 4, 5, 22, 25. However, to date, it is still unclear, on which cellular subsets MIF is acting in high‐grade gliomas upon being released by glioma cells. In general, the binding of MIF to the extracellular domain of the non‐polymorphic type II integral membrane protein CD74 is necessary as an initial step for the MIF signaling cascade 28. It has been demonstrated in proteomic and microarray analyses that the MIF binding protein CD74 is one of the most strongly up‐regulated molecules in high‐grade gliomas as compared with normal central nervous system (CNS) tissue controls 2. In glioma cell culture‐based and xenograft transplantation models, CD74 expression was linked to an increased resistance toward chemotherapeutic treatment with temozolomide 14. Therefore, it is of importance to decipher the cellular source of CD74 expression in high‐grade gliomas. So far, two major distinct MIF‐CD74 interactions are known: on the one hand, binding of MIF to CD74 can induce the recruitment of CD44 to the complex, which then activates non‐receptor tyrosine kinases, leading ultimately to extracellular signal‐regulated kinase phosphorylation 28. This is thought to enhance tumor growth in several human neoplasms including human renal or breast cancer in an autocrine manner. On the other hand, MIF and CD74 may also form complexes with the cysteine‐X‐cysteine (CXC)‐chemokine receptors CXCR2 on myeloid cells and CXCR4 on T cells 7. Thus acting as a chemokine, MIF may recruit myeloid cells and influence M1/M2 polarization in intratumoral immune cells 9, 11, 20. Meanwhile, the humanized monoclonal anti‐CD74 antibody milatuzumab already entered phase I clinical trials for cancer therapies currently mainly focusing on hematopoietic neoplasms 6. The aim of the present study was to characterize the cellular source of CD74 expression in the normal human brain and in CNS tumors. Additionally, we address the question of clinical relevance of CD74 expression in astrocytic brain tumors especially with regard to patient survival to evaluate the rationale for further CD74 targeted therapy approaches in gliomas.
Material and Methods
Patient tissue and tissue microarrays (TMAs)
In total, 303 paraffin‐embedded tissue samples from patients with brain tumor were investigated comprising 45 pilocytic astrocytomas of World Health Organization (WHO) grade I, 14 astrocytomas of WHO grade II, 28 astrocytomas of WHO grade III and 216 glioblastomas, WHO grade IV. Normal brain tissue from autopsy cases, histologically normal‐appearing brain tissue surrounding glioblastoma samples and human tonsil tissue were used as controls. The samples were obtained from the tissue bank of the Edinger Institute (Neurological Institute), Frankfurt, Germany. Tissue samples were fixed in 4% buffered formalin (Roth, Karlsruhe, Germany) and embedded in paraffin. We constructed TMAs by punching 896 representative tissue cores from paraffin blocks of the aforementioned cohort (e.g. infiltration zone, tumor center, normal‐appearing brain tissue), reintegrating them into preformed holes of recipient paraffin blocks. The histopathologic diagnoses were performed according to the WHO criteria by experienced neuropathologists (MM, PNH, KHP). The use of patient material was approved by the local ethics committee (GS‐04/09 and GS‐249/11).
Cell culture
The following established glioma cell lines were tested: LN18, U138, U87, LN428, D247, T98G, LN319, LNT229, A172, U251 and U373 were kindly provided by Dr. N. de Tribolet (University Hospital, Lausanne, Switzerland). As LN‐229 cells used in different laboratories differ in their p53 status, the p53 wild‐type LN‐229 cells used in our experiments were renamed LNT‐229 for clarification (T for Tübingen) 22. Of note, genetic screening by short tandem repeat analyses of highly polymorphic DNA regions revealed that U251MG and U373MG are subclones of the identical tumor and it could not be clarified which line was the authentic one. The B cell lymphoma cell lines Raji and Ramos served as positive controls for CD74 expression. The adherent human glioma cell lines were grown in Dulbecco's modified Eagle medium (DMEM, Gibco Invitrogen, Darmstadt, Germany) supplemented with 10% fetal calf serum (FCS, Provitro, Berlin, Germany) and 1% penicillin/streptomycin (P/S, Sigma Aldrich, Steinheim, Germany). The nonadherent lymphoma cell lines Raji and Ramos were cultured in Roswell Park Memorial Institute (RPMI, Gibco Invitrogen) medium. In addition to 1% P/S, Raji cells were supplemented with 10% FCS and Ramos cells with 20% FCS. All cells were grown in an incubator atmosphere of 5% CO2 at 37°C (Heraeus, Thermo Scientific, Dreieich, Germany). Furthermore, glioma and endothelial cell pellets were constructed as micro array in paraffin blocks similarly to the human tissue samples described earlier.
Cell culture of primary human tumor cells
Primary cultures from human gliomas were established under sterile conditions. Native tumor tissue was mechanically dissociated using a sterile scalpel followed by enzymatic digestion with a papain‐based enzyme mix (Worthington Biochemical Corporation, Lakewood, NJ, USA) containing Leibovitz‐L15 (Gibco Invitrogen), 0.5 μmol ethylenediaminetetraacetic acid (EDTA) and DNAse1 1000 U (Sigma Aldrich) at 37°C in the water bath for 30 min. After filtration through a 40‐μm cell strainer (BD Biosciences, Heidelberg, Germany), washing and centrifugation steps, cells were resuspended in culture medium. Primary cultures were grown in 75 cm2 culture flasks at 37°C, 5% CO2 in 10 mL of DMEM/10% FCS or neurosphere medium [50 mL DMEM‐F12 (Gibco Invitrogen) supplemented with 50 μL epidermal growth factor (EGF, PeproTech, Hamburg, Germany), 100 μL basic fibroblast growth factor (bFGF, PeproTech), 1 mL B27 Supplement (Gibco Invitrogen), 0.5 mL N‐2‐hydroxyethylpiperazine‐N'‐2‐ethanesulfonic acid (HEPES, Gibco Invitrogen), 0.5 mL P/S (Sigma Aldrich) ]. Culture media was changed one day after isolation to remove dead cells and debris and in the course of cultivation once or twice a week, depending on the growth rate. The use of patient material for primary cell cultures was approved by the local ethics committee (GS‐04/09).
Magnetic‐activated cell sorting (MACS)® isolation and cell culture of primary human microglia/macrophages
Primary microglia/macrophage cultures were prepared from native human glioma tissue and normal brain autopsy cases. The isolation of human glioma‐associated microglia/macrophages (GAMs) from tissues was performed by MACS® technique (Miltenyi Biotec, Bergisch Gladbach, Germany). Antibodies labeled with magnetic beads against CD11b were used for GAM isolation. Glioma tissue was first mechanically dissociated using a sterile scalpel followed by an enzymatic digestion with the papain‐based Neural Tissue Dissociation Kit (Miltenyi Biotec, Bergisch Gladbach, Germany) according to the manufacturer's protocol. Further mechanical and enzymatic dissociation were performed by trituration using the gentleMACS® dissociator (Miltenyi Biotec, Bergisch Gladbach, Germany). After washing and centrifugation steps, cell suspension was incubated at 2–4°C for 15 min together with CD11b (Microglia)‐MicroBeads (Miltenyi Biotec) that were diluted in MACS buffer containing phosphate buffer solution (PBS), 0.5% bovine serum albumin (BSA) and 2 mM EDTA. The single‐cell suspension was loaded onto the MS Isolation Columns, fixed in the magnetic OctoMACS™ Separator (Miltenyi Biotec). By disconnecting the columns from the magnetic separator and enhancing the pressure on the columns with a stopper, magnetic labeled cells passed and were collected for cultivation or processed directly for further experiments [e.g. RNA isolation, fluorescence‐activated cell sorting (FACS), immunocytochemistry]. Purity of the isolated microglia/macrophages was determined by Iba‐1, major histocompatibility complex (MHC)‐II and CD45 immunocytochemistry, Iba‐1 immunoblotting and FACS analyses. Tissue samples for primary microglia/macrophage isolation were obtained from the Departments of Neurosurgery, Pathology and Forensic Medicine of the Goethe University, Frankfurt, Germany. The use of patient material was approved by the local ethical committee (GS‐04/09 and GS‐249/11).
Immunohistochemistry (IHC) and immunofluorescence (IF)
Immunohistochemical and immunofluorescent analyses were performed using the following antibodies: anti‐CD3 (Dako A0452, dilution for IF 1:500), anti‐leukocyte common antigen CD45 (Dako M0701, dilution for IHC 1:2000), anti‐MIF (Abcam, Cambridge, UK; ab65869, dilution for IF 1:250), anti‐CD74 (Abcam, ab9514, dilution for IHC and IF 1:100 and 1:200), anti‐astrocytic glial fiber acid protein (GFAP; Dako Z0334, dilution for IHC/IF 1:20.000/1:10.000), anti‐Iba‐1 (Wako, 019–19741, dilution for IF and IHC 1:1000), anti‐MHC‐II (Dako M0775, dilution for IHC 1:1000), anti‐Ki67 (Dako M7240, dilution for IHC 1:200) and anti‐CD68 (Dako M0876, dilution for IHC 1:500). All immunohistochemical stainings with monoclonal antibodies were controlled using mouse IgG1 antibody against an epitope of nonhuman origin (Aspergillus niger, DAKO, Glostrup, Denmark) as isotype control. For polyclonal antibodies and all immunofluorescent stainings, control sections without primary antibodies were used as controls. Paraffin full mount and TMA tissue blocks were cut in 3–4‐μm thick slices using a microtome (Leica Microsystems, Nussloch, Germany) and placed on SuperFrost slides (Thermo Scientific). For manual IHC/IF staining, paraffin‐embedded tissue, TMA and cell pellet slices were deparaffinized and rehydrated, followed by a treatment with citrate buffer (pH 6.0) and a heating step for antigen retrieval. Endogenous peroxidase was blocked by H2O2 solution for 15 min to prevent non‐specific antibody binding. Specimens were incubated with the diluted primary antibodies for 1 h. The secondary antibodies Alexa Fluor® 488 and 568 (Gibco Invitrogen) were used according to the manufacturer's protocol [IHC Kit DCS Detection Line‐Polylink, horseradish peroxidase (HRP)‐Label, DCS Diagnostics, Hamburg, Germany] for immunofluorescent analyses. 3,3′‐diaminobenzidine (DAB, DCS Diagnostics) served as chromogen to visualize specific antigen binding in immunohistochemical analyses followed by nuclear counterstaining with hematoxylin. Furthermore, IHC stainings for CD74, GFAP, Iba1, CD68, Ki67 und CD45 were performed according to standardized protocols using a Discovery XT automated immunostainer (Ventana Medical Systems, München, Germany). Manual double‐IF stainings of paraffin‐embedded tissues required the same preparation using deparaffinization and rehydration steps. Primary antibodies of different species were diluted in 10% normal goat serum (NGS) and 90% PBS and applied on the slides for 1 h. The fluorochromes Alexa Fluor® 568 and 488, each conjugated to secondary antibodies (Gibco Invitrogen, Darmstadt, Germany) against the particular species of the respective primary antibodies, absorb and emit a different wave length after activation, showing antigen binding in red (Alexa Fluor 568) or green fluorescence (Alexa Fluor 488) spectrum. 4′,6‐diamidin‐2‐phenylindol (DAPI) and To‐Pro3 (both Gibco Invitrogen) served as nuclear counterstaining. The IHC stainings were analyzed using a light microscope (BX41, Olympus, Hamburg, Germany). IF stainings were evaluated using Eclipse 80i fluorescent microscope as well as a C1 confocal microscope (both Nikon, Düsseldorf, Germany).
FACS
Membranous CD74 expression of the glioma cell lines U87, LN428, T98G, LNT229, A172, U251 and U373 were tested by FACS against the positive controls Raji and Ramos. After the incubation of the primary antibodies (Anti‐CD74, ab9514, 1:100) for 30 min, fluorochrome (Alexa Fluor 488, rb‐anti‐mouse, dilution 1:200) conjugated secondary antibodies were applied for another 30 min. Sorting of the stained cells was performed by the FACSCanto‐II flow cytometer (BD Bioscience). An anti‐mouse IgG1 antibody (Dako, Hamburg, Germany) was used as an isotype control for CD74 stainings. Data were analyzed by Flow Jo software (TreeStar, Ashland, OR, USA).
Western blot analysis
Protein lysates were generated by mechanical (Destroy‐S, Biozym Scientific GmbH, Hessisch Oldendorf, Germany) and enzymatic treatment with lysis buffer (50 mM HEPES, 150 mM NaCl, 1 mM EDTA, 1 mM EGTA, 10% glycerin, 1% TritonX100, 25 mM NaF, 50 mM ZnCl2) from cryo‐conserved tissue samples of human brain tumors and tonsil, cell lines as well as primary tumor cells and GAMs. The protein concentration was determined according to the manufacturer's protocol using the Micro BCA™ Protein Assay Kit (Thermo Scientific) to analyze equal amounts of protein loading for each sample. The electrophoretic separation of the denatured proteins was performed on 12,5% sodium dodecyl sulfate (SDS)‐polyacrylamide‐gels using the Bio‐Rad electrophoresis system (Bio‐Rad, München, Germany) at 80 V for 10 min and 120 V for the following hour. The separated proteins were transferred onto nitrocellulose membranes (Amersham Hybond ECL Membrane, GE Healthcare, München, Germany) in a Bio‐Rad blotting system by applying 100 V for 1 h. The blots were blocked in 1% Roti‐Block blocking buffer (Roth, Karlsruhe, Germany) and then incubated with the primary antibodies CD74 (Abcam, ab9514, dilution for immunoblotting 1:200), Iba‐1 (Wako, 016–20001, dilution for WB 1:1000), MIF (Abcam, ab65869, dilution for WB 1:250) and beta‐actin (Abcam, ab8227, dilution for WB 1:2500) as a loading control. Immunodetection was performed by HRP enzyme‐coupled secondary antibodies which oxidized luminol (Santa Cruz Biotechnology, Heidelberg, Germany) resulting in a chemoluminescent reaction visible on processed X‐ray films (Super RX, Fujifilm Europe GmbH, Düsseldorf, Germany).
The cancer genome atlas (TCGA), the Repository of Molecular Brain Neoplasia Data (REMBRANDT) and R2: microarray analysis and visualization platform analyses
To determine gene expression of the MIF‐CD74 system in gliomas, we additionally analyzed data from the TCGA using the Agilent 244K G4502A microarray to determine mRNA profiles (http://tcga.cancer.gov/; accessed November 2011). The raw data of gene expression change between each of the 424 patients with glioblastoma and the mean expression of 11 normal CNS tissue cohort was downloaded for further correlation analyses. The calculations were performed using Microsoft Excel (Excel for MAC 2008; Redmond, WA, USA) and the JMP 8.0 software (SAS, Cary, NC, USA). Also, for gene cluster analyses the TCGA database was accessed. Furthermore the REMBRANDT database using Affymetrix U133 Plus 2.0 GeneChip analyses (NCI2005; REMBRANDT version 1.5.5; http://rembrandt.nci.nih.gov) was accessed. REMBRANDT contained mRNA expression data of 228 glioblastomas, 148 grade II/III astrocytomas, 67 grade II/III oligodendrogliomas, 11 mixed gliomas and 28 normal control tissues. Kaplan–Meier survival curves were generated by analyzing the glioma patient cohort (n = 343) of which associated survival data were available. CD74 up‐ or down‐regulation was defined as a twofold (or greater) difference from the mean expression level within a given dataset. P‐values for differences in patient survival curves were obtained using the log–rank test. The “highest geometric mean intensity” of CD74 expression was used as the reporter for relative CD74 expression within the database. Differential expression data of genes correlating with CD74 expression deriving from the TCGA were assessed using R2: microarray analysis and visualization platform (http://r2.amc.nl; 03.12.2013)
Quantitative real‐time reverse‐transcription polymerase chain reaction (q‐RT‐PCR)
Total RNA was extracted from primary cells and cell lines by first using trizol (Invitrogen, Carlsbad, CA, USA) for cell lysis following a precipitation step with glycogen and isopropanol. The concentration of total RNA was determined photometrically with a TECAN fluorescence plate reader (Tecan, Männedorf, Switzerland). After pretreatment of 2.2 μg total RNA with the DNA‐free Kit (Applied Biosystems, Darmstadt, Germany) reverse transcription into complementary DNA (cDNA) was performed according to the manufacturer's protocol of the ABI High‐Capacity cDNA Archive Kit (Applied Biosystems, Foster City, CA, USA). The quantitative polymerase chain reaction (qPCR) reactions were prepared in a final volume of 20 μL, with the TaqMan Fast Universal PCR Master Mix, the target assay (Applied Biosystems) and 20 ng of cDNA for the analysis of chemokine (C‐C motif) ligand (CCL) 22, interleukin (IL)‐10, mannose receptor C type 1 (MRC1) CD206, nitric oxide 2 (NOS2) [inducible NOS (iNOS) ] and Arg1. All analyses were performed in triplicate, and the dCT was determined.
Recombinant human MIF (rhMIF) stimulation of microglia/macrophages
Cultures of primary microglia/macrophages were stimulated with rhMIF (eBioscience/Natutec, Frankfurt, Germany) at a concentration of 10 ng/mL. To determine MIF‐CD74 signaling the MIF receptor CD74 was blocked via the neutralizing anti‐CD74 antibody (Abcam, ab9514, concentration 1 μg/mL) and with anti‐mouse IgG1 as an isotype control (Dako, concentration 1 μg/mL). Human recombinant macrophage colony stimulating factor (rhM‐CSF, R&D Systems, Wiesbaden, Germany) is known to induce M2 polarization in GAM at a concentration of 10 ng/mL and was therefore used as a positive control stimuli 15. Morphologic changes were analyzed every 12 h over 3 days using a light microscope (Olympus IX70). Q‐RT‐PCR was performed to check for effects of MIF‐CD74 on the M1/M2 polarization profile. For q‐RT‐PCR, cells were harvested after 24 h of stimulation and tested for their arginase, iNOS, IL‐10, CCL22 and CD206 gene expression.
Statistical analyses of tissue micro array data
For statistical evaluation an intracellular and membrane‐associated CD74 labeling was counted. The percentage of positive stained cells was put in relation to the total number of cell nuclei in the specimens. The collected expression data were analyzed by analysis of variance (ANOVA) followed by Tukey's honestly significant difference (HSD) test to detect significant differences. P‐values are indicated including their 95% confidence intervals (**P = 0.01; ***P = 0.0001). The association of patient survival with the response variable (CD74 expression) was assessed by Kaplan–Meier analysis tested by log–rank and Wilcoxon's test. Multivariate analysis was performed using the Cox proportional hazard model controlling for CD74‐positive GAMs (positive cells/all cells), Ki67 proliferation rate, CD68‐positive GAMs, sex and patient age. A significance level of alpha = 0.05 was selected for all tests. Statistical analysis was performed using JMP 8.0.1 software (SAS). Graphics were prepared using the GraphPad Prism software (GraphPad Software, Inc., La Jolla, CA, USA).
Results
CD74 mRNA levels increase with the grade of malignancy in human glioma tissue
The analysis of mRNA expression data using the REMBRANDT platform revealed significant up‐regulation of CD74 in diffuse astrocytic tumors (Figure 1). In astrocytomas of WHO grades II and III as well as in glioblastomas WHO grade IV we detected a significant CD74 overexpression compared with normal CNS control tissues (both P < 0.0001). In addition, glioblastomas showed the highest CD74 expression of all investigated brain tumor entities. In contrast, brain tumors with oligodendroglial differentiation only showed a mild increase in CD74 expression as compared with normal CNS control tissue although not reaching levels of significance (P = 0.7334 and P = 0.6096 in two different probe sets).
Figure 1.
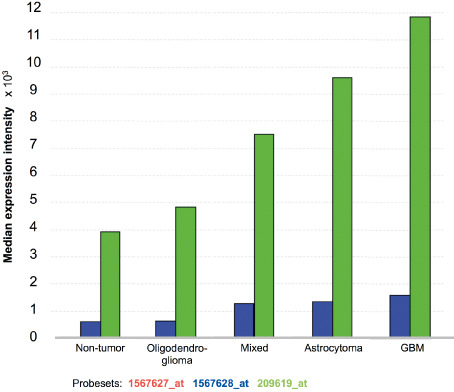
CD74 mRNA levels increase with the grade of malignancy in human glioma tissue. The Repository of Molecular Brain Neoplasia Data (REMBRANDT) data analysis of the CD74 gene expression (median expression × 103) in 454 gliomas [REMBRANDT National Institutes of Health (NIH) 2011; https://caintegrator.nci.nih.gov/rembrandt/]. Three different probesets were studied: 1567627_at (red; on chromosome 5 at 149.762876 Mb on the plus strand); 1567628_at (blue; on chromosome 5 at 149.762876 on the minus strand); 209619_at (green; on chromosome at 149.761492 Mb on the minus strand).
CD74 protein expression is absent in glioma cell lines, but present in normal and neoplastic CNS tissues
To investigate CD74 expression in human gliomas, we first analyzed glioblastoma cell lines that completely lacked membranous CD74 expression in immunofluorescent analyses (Figure 2A,B). FACS analyses of the human glioma cell lines D251, MZ18, LN319, A172, LN428, LN18, T98G also displayed negative results for CD74 expression, while a marked expression was observed in the human Burkitt lymphoma cell lines Raji and Ramos serving as positive controls (Figure 2C–K). These findings indicate that CD74 is not expressed on the cellular surface of glioma cell lines. To corroborate the findings that glioma cells lack intracellular CD74 expression (Figure 2A,B), we performed immunoblotting analyses, which also revealed complete absence of intracellular CD74 protein expression (Figure 2L). In contrast, both primary human tissue specimens deriving from normal and neoplastic brains showed a distinct population of CD74‐positive cells (Figure 3). In normal human gray matter (Figure 3A) only very few CD74‐positive cells with elongated cellular processes were present, while in corresponding white matter (Figure 3B), a slightly higher percentage of CD74‐expressing cells with similar so‐called resting‐state morphology were visible. Considerably higher levels of CD74‐positive cells were encountered in pilocytic astrocytomas (Figure 3C). Very similar fractions of CD74‐positive cells were observed in diffuse astrocytomas WHO grade II (Figure 3D), anaplastic astrocytomas WHO grade III (Figure 3E) and glioblastomas WHO grade IV (Figure 3F). In contrast to CD74‐positive cells in normal CNS tissue and pilocytic astrocytomas WHO grade I, cells expressing CD74 in diffusely infiltrating gliomas WHO grades II–IV presented with a more round‐shape morphology, mainly lacking fine cellular processes. While CD74‐positive cells in infiltration zones of glioblastomas (Figure 3G) showed thickened and shortened cellular processes, cellular morphology in the recurrent glioblastomas (Figure 3H) was similar to the primary tumor (Figure 3F). The statistical analysis of the fraction of CD74‐positive cells in the distinct astrocytoma subgroups, glioblastoma infiltration zones and normal‐appearing brain tissues revealed highest CD74‐positive cell fractions in pilocytic astrocytomas WHO grade I being significantly higher as in normal CNS areas and all other diffuse astrocytoma subtypes (P < 0.0001 for all comparisons) (Figure 4). In addition, similarly to the REMBRANDT mRNA expression database analyses, glioblastomas also presented with significantly higher fractions of CD74‐positive cells as compared with normal‐appearing gray matter (P = 0.0017). No further significant differences were obtained for the comparisons among diffuse astrocytomas of different WHO grades. Of note, very similar CD74‐positive cell fractions were observed in WHO grade II astrocytomas and normal‐appearing white matter (Figure 4).
Figure 2.
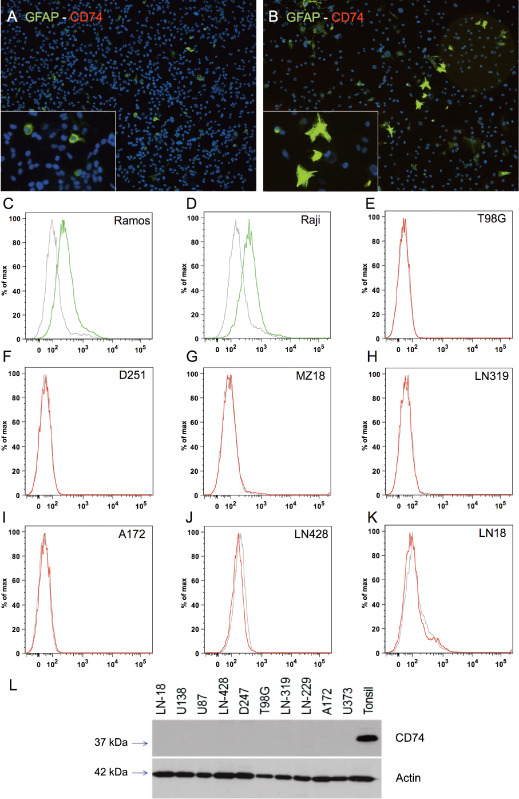
CD74 expression is absent in human malignant glioma cell lines. In double‐immunofluorescence (IF) staining CD74 (Alexa 568, red) was absent in all tested glioma cell lines (not shown), only glial fiber acid protein (GFAP) (Alexa 488, green) was positive in (A) U251 and (B) U373 (original magnification ×10 in A and B; images taken with the Eclipse 80i fluorescent microscope). While human lymphoma cell lines Ramos (C) and Raji (D) exhibited CD74 expression on the cell surface thereby serving as positive controls, glioma cell lines (E–K) did not show CD74 expression. The CD74 immunoblot from glioma cell lysates and human tonsil as positive control showed a complete absence of CD74 protein in glioma cell lines (L).
Figure 3.
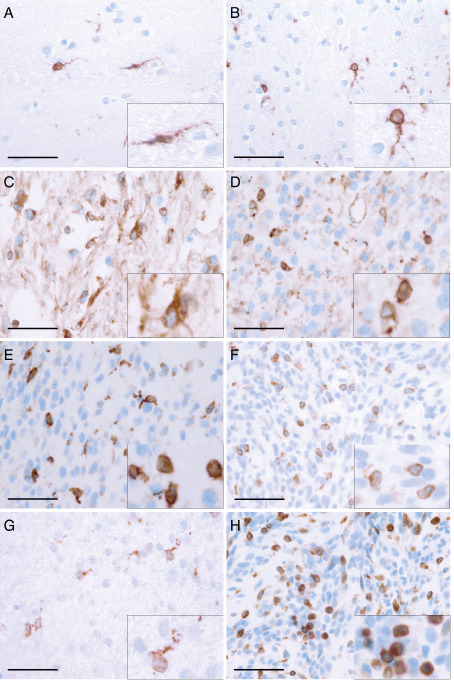
CD74 is strongly expressed in normal and neoplastic central nervous system (CNS) tissue in vivo. Representative immunhistochemical stainings showing CD74 expression on a distinct cellular subset in (A) normal‐appearing grey matter (n = 44), (B) normal‐appearing white matter (n = 16) and astrocytomas of (C) World Health Organization (WHO) grade I (n = 47), (D) WHO grade II (n = 16), (E) WHO grade III (n = 35) as well as (F) glioblastoma, WHO grade IV (n = 252). Histomorphologic characteristics of CD74‐positive cells were also analyzed with regard to the microlocalisation such as (F) GBM tumor centers (n = 252), (G) GBM infiltration zones (n = 37) or (H) in GBM recurrence (n = 114). While in tumor centers of both primary (F) and recurrent (H) GBMs CD74 expression was detected on the surface of mostly rounded to ovoid cells, CD74 expression in normal CNS tissue (A, B) and GBM infiltration zones (G) was mainly observed on elongated cellular protrusions. (scale bars = 50 μm; inserts = higher magnification).
Figure 4.
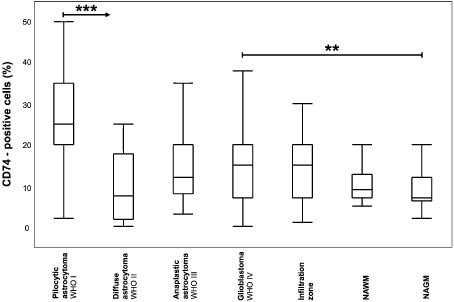
CD74 expression is differentially regulated in astrocytic tumors and normal central nervous system (CNS) tissues. Box and Whisker plots for CD74‐positive cells (in %) in astrocytomas I–IV, GBM infiltration zones as well as normal‐appearing CNS tissues are depicted. The relative amount of CD74‐positive cells in pilocytic astrocytoma, World Health Organization (WHO) grade I (n = 47); diffuse astrocytoma WHO grade II (n = 16); anaplastic astrocytoma WHO grade III (n = 35); glioblastoma WHO grade IV (n = 252), GBM infiltration zone (n = 37), normal‐appearing white matter of GBM samples (NAWM; n = 16) as well as normal‐appearing grey matter of GBM samples (NAGM; n = 44) was statistically assessed using the nonparametric Wilcoxon's test. A significance level of alpha = 0.05 was chosen for all testings. For adjustment of the P‐values because of multiple testing we used the method of Bonferroni–Holm. Statistical analysis was performed using JMP 8.0.1 software (SAS).
CD74 expression is restricted to microglia in normal and to GAMs in neoplastic CNS tissue while its ligand MIF is produced by glioma cells
To further decipher the exact cellular source of CD74 expression in the normal human brain and malignant gliomas, we first addressed the question whether GAMs constitute a major cellular source of CD74 as morphologic and immunohistochemical features were reminiscent of quiescent and activated microglial cells (Figure 3). Immunofluorescent analyses revealed a strict co‐expression of CD74 and the microglia/macrophage marker Iba‐1 in all normal white (Figure 5A) and gray (Figure 5B) as well as in glioblastoma samples (Figure 5C) pointing to a GAM‐restricted CD74 expression. Of note, while virtually all cells displayed CD74 and Iba1 co‐expression in glioblastomas (Figure 5C), a moderate amount of Iba1‐positive cells was CD74‐negative in normal‐appearing CNS tissues (Figure 5A,B). In contrast, no CD74 expression was observed on T cells (Supporting Information Figure S1A,B) or glial cells (Supporting Information Figure S1C,D) in both normal CNS tissue (Supporting Information Figure S1A,C) and glioblastomas (Supporting Information Figure S1B,D). While the CD74 ligand MIF was virtually absent in normal CNS tissue samples (Figure 5D), glioblastoma tissue samples showed prominent MIF expression, however, deriving from a another cell population than the CD74‐positive GAM fraction (Figure 5E).
Figure 5.
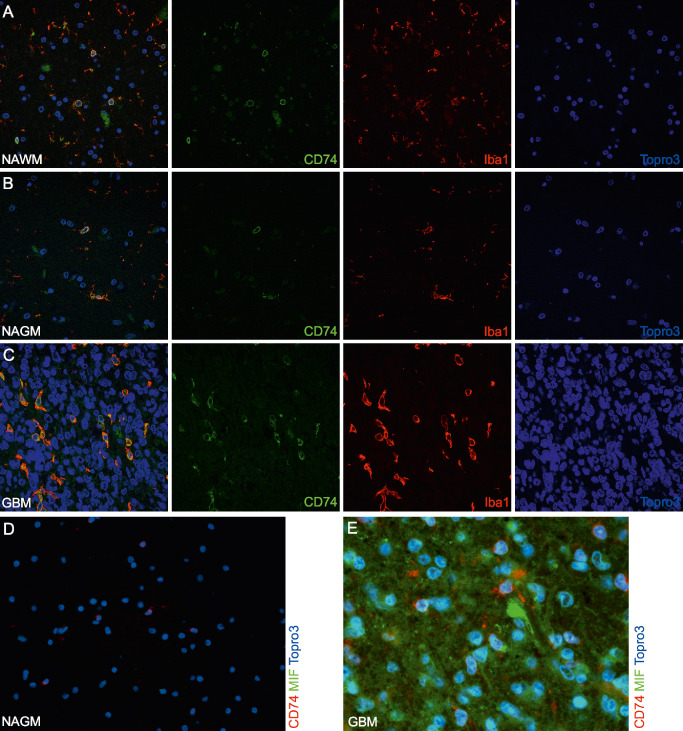
CD74 expression in vivo is restricted to microglia cells in normal central nervous system (CNS) tissues as well as glioma‐associated microglia/macrophages (GAMs) in gliomas. Representative double‐immunofluorescence (IF) stainings of CD74 (Alexa 488, green) and the microglia/macrophage marker Iba1 (Alexa 568, red) show a colocalization in (A) normal white (n = 4), (B) grey matter (n = 4) and (C) glioblastoma World Health Organization (WHO) grade IV (n = 15) samples (images A–C were taken with the C1 confocal microscope). No colocalization of the ligand migration inhibitory factor (MIF) (Alexa 488, green) and its receptor CD74 (Alexa 568, red) was seen in (D) normal brain or (E) glioblastoma WHO grade IV samples (images D–E were taken with the Eclipse 80i fluorescent microscope; original magnification A–D: 20×; E: 40×). In addition, pilocytic astrocytoma WHO grade I (n = 2) as well as WHO grade II (n = 2) and III (n = 2) astrocytomas were assessed revealing similar staining results (data not shown).
CD74 gene expression correlates with the content of GAMs in gliomas
In TCGA data analysis, the intratumoral CD74 gene expression strongly clustered with the expression profiles of other microglia/macrophage markers such as Iba1 (AIF1), CD68 and CD45 (Figure 6A). In contrast, other immune cell markers such as CD8 for cytotoxic T cells or natural killer cell p46‐related protein (NKp46) indicating NK cells were not found within the CD74 cluster (Figure 6A). Direct correlation analyses revealed that CD74 gene expression most strongly correlated with the expression levels of Iba1 (AIF1) (r 2 = 0.543; P < 0.0001) (Figure 6B) and CD68 (r 2 = 0.505; P < 0.0001) (Figure 6C) while the correlation with CD11b (ITGAM) (r 2 = 0.27; P < 0.0001) (Figure 6D) was slightly weaker. Next, we sorted GAMs from fresh glioblastomas using the CD11b‐MACS technique reaching a purity of >95% (Supporting Information Figure S2). To corroborate the mRNA correlation data, we assessed CD74 at protein level by immunoblotting of the sorted GAMs, corresponding primary glioblastoma cells and whole tumor tissue lysates derived from the same tumors. These blots likewise showed a strong association of CD74 protein expression with Iba1‐positive GAMs (Figure 6E).
Figure 6.
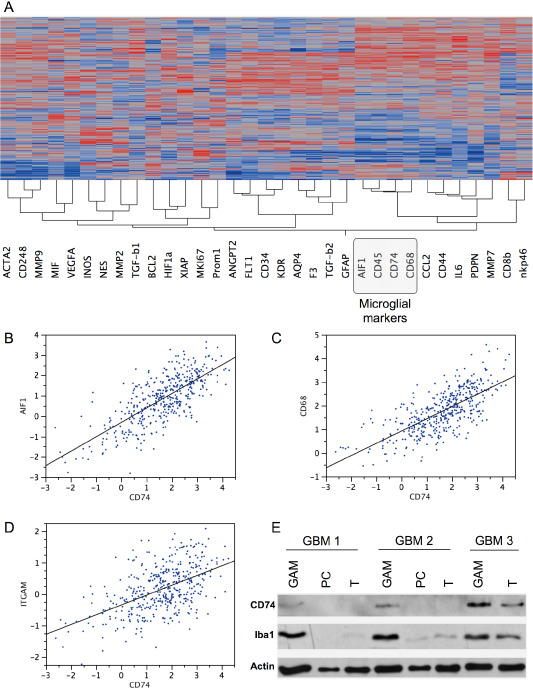
CD74 mRNA and protein levels correlate with the content of glioma‐associated microglia/macrophages (GAMs). Hierarchical cluster analyses (A) of gene expression signatures of selected key factors of immune cells, glioblastoma cells as well as glioblastoma micromilieu of 424 primary glioblastomas and 11 normal brain samples deriving from the cancer genome atlas (TCGA) data portal using the Agilent 244K G4502A microarray to determine mRNA profiles. Hierarchical clustering of this data was performed using the Ward's minimum variance method. Dark red color indicates a perfect positive correlation (+1) gradually decreasing to a perfect negative correlation (−1) indicated in blue. Correlation analyses of the same data subset comparing CD74 with either (B) Iba1 (AIF1), (C) CD68 or (D) CD11b (ITGAM) are depicted. CD74 and Iba1 immunoblotting (E) of GAMs, glioblastoma cells (PC) and whole glioblastoma tissue (T) of three different patients with primary glioblastoma World Health Organization (WHO) grade IV showing a positive correlation of CD74 and Iba1 protein expression. Actin served as positive control.
rhM‐CSF but not MIF stimulation changes immune polarization or activation state of primary GAMs
Freshly isolated GAMs displayed mainly an amoeboid morphology with short thickened cellular processes (Figure 7A). The application of recombinant human MIF, constituting the natural ligand for CD74, did not change the morphologic activation state of GAMs (Figure 7B) while the application of rhM‐CSF led to a considerable increase in the number of GAMs accompanied by a change in morphology (Figure 7C). Morphologic changes of GAMs upon rhM‐CSF administration mainly consisted of cellular hypertrophy with elongated cellular processes. Addition of rhMIF to rhM‐CSF did not further affect GAM proliferation and morphology (Figure 7D). Of note, the application of neutralizing anti‐CD74 antibodies added to rhMIF only exerted a very mild effect on GAMs leading to a dramatic change in cell morphology with increasing cellular processes (Figure 7E). As rhMIF did neither notably change morphology nor proliferation of GAMs, we next aimed to analyze by qPCR if more subtle changes might occur upon application of rhMIF. However, no changes in classical M1/M2 polarization markers (iNOS, CCL22, IL‐10, CD206) were detected as compared with BSA and anti‐CD74 control conditions (Figure 7F). Interestingly, most cytokine subsets and their receptors that significantly correlate with CD74 mRNA expression in glioblastomas belong to the M1 polarization arm, while most factors indicating an M2 phenotype were not significantly associated with CD74 expression (among others including: CCL1, ARG1, CCL16, CCL17, CCL22, CCL24, CCR2, CXCR1, CXCR2) [TCGA database, analyzed using the R2: microarray analysis and visualization platform (http://r2.amc.nl); 03.12.2013] (Figure 7G). Remarkably, while most M2 cytokines and respective receptors were not associated with CD74 expression, almost exclusively M2 molecules that are involved in phagocytic/endocytic and/or adhesion processes strongly correlated with CD74 expression (Figure 7G).
Figure 7.
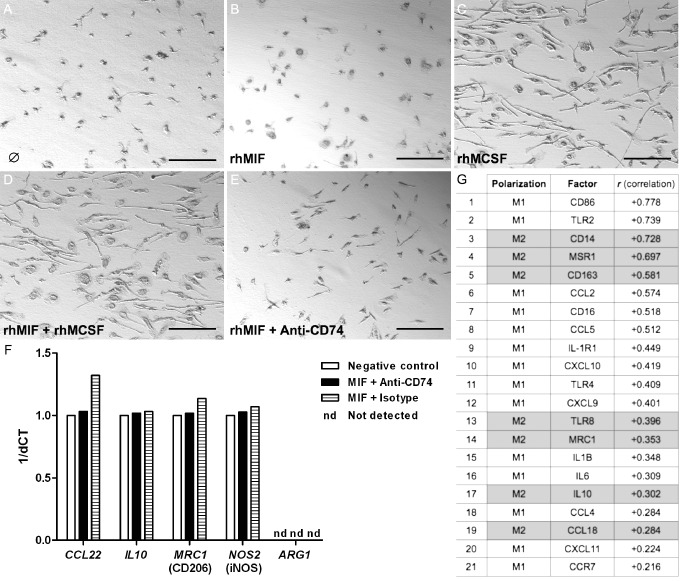
The migration inhibitory factor (MIF)‐CD74 system is associated with a distinct M1‐polarized, phagocytic glioma‐associated microglia/macrophage (GAM)‐phenotype in glioblastomas. Light microscopy of unstimulated GAMs (A) or GAMs after stimulation with (B) recombinant human MIF (rhMIF) 10 ng/mL, (C) human recombinant macrophage colony stimulating factor (rhM‐CSF) 10 ng/mL, (D) rhMIF 10 ng/mL and rhM‐CSF 10 ng/mL, (E) rhMIF 10 ng/mL and neutralizing anti‐CD74 antibody (GAM in A–E were derived from glioblastoma World Health Organization (WHO) grade IV). (F) Differential mRNA expression for classical M1/M2 molecules as assessed by quantitative polymerase chain reaction (qPCR) [using TaqMan Fast Universal PCR Master Mix, the target assay (Applied Biosystems) and 20 ng of complementary DNA (cDNA) ] did not reveal any considerable differences between the stimulation of GAMs with MIF and an anti‐CD74 approach as compared with the IgG1 isotype (at the same concentration as anti‐CD74 antibody) or negative (bovine serum albumin at 10 ng/mL also serving as diluent for rhMIF) control. (G) Analyses of the cancer genome atlas (TCGA) data using the R2 platform revealed a distinct, mainly M1‐based profile with additional phagocytic or adhesion molecules (correlation with CD74 expression is given in descending order).
The fraction of CD74‐expressing GAMs is positively associated with patient survival and represents an independent prognostic factor in GBM
Kaplan–Meier survival analysis of n = 216 glioblastomas of our patient cohort showed a significant positive association of CD74 expression with prolonged patient survival. In addition, a higher fraction of CD74‐positive GAMs in glioblastomas turned out as an independent prognostic factor in glioblastomas (Figure 8) together with patient age.
Figure 8.
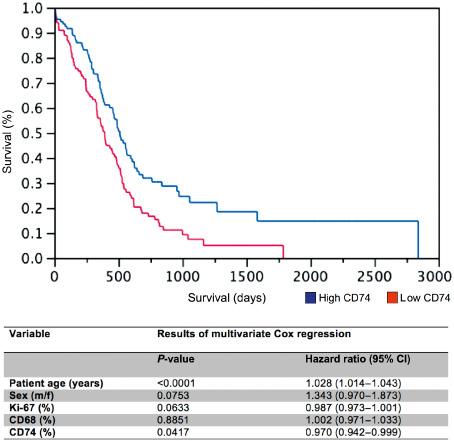
The amount of CD74‐positive glioma‐associated microglia/macrophages (GAMs) is an independent prognostic marker for patient survival in GBM. Kaplan–Meier survival curves of GBM patients were obtained by performing median split for CD74 (high expression > 15% CD74‐positive GAMs; low expression ≤ 15% CD74‐positive GAMs) levels. Curves were compared by both log–rank (P = 0.0018) and Wilcoxon (P = 0.0066) tests. Multivariate analysis was performed using the Cox proportional hazard model controlling for CD74‐positive GAMs (positive cells/all cells), Ki67 proliferation rate, CD68‐positive GAMs, sex and patient age.
Discussion
The pro‐inflammatory cytokine MIF and its receptor CD74 17 play a role in tumorigenesis exerting pro‐tumorigenic effects such as enhancing proliferation 30, tumor vascularization 8, 18, 21 and inhibition of apoptosis 12. Although mainly acting as a pro‐inflammatory cytokine, MIF also exerts immunosuppressive functions 3, 16, 27 and may thereby influence M1/M2 polarization of TAM 9. However, the function and prognostic relevance of the MIF‐CD74 axis in gliomas still remains to be determined. In gliomas MIF 22 and CD74 2 are strongly up‐regulated, therefore constituting possible promising targets for future therapeutic strategies. REMBRANDT database analyses confirmed a significant up‐regulation of CD74 mRNA expression in diffuse astrocytomas of WHO grades II–IV showing an increase with the level of malignancy (Figure 1). To further explore the MIF‐CD74 system in vivo and its clinicopathologic relevance in gliomas, we investigated the cellular source of CD74 expression. As CD74 protein expression was absent from glioma cells (Figure 2), but strongly present in glioma whole tissue (Figure 3), we hypothesized that CD74 expression derives from non‐neoplastic cells of the glioma microenvironment. TMA analyses of 303 patients with glioma revealed the highest relative amounts of CD74 protein‐expressing cells in pilocytic astrocytomas, WHO grade I, in comparison with diffuse astrocytomas, WHO grades II–IV. CD74 was likewise found in normal human CNS tissue, although in relatively smaller amounts (Figure 4). Co‐expression profiling using double‐IF stainings revealed a restriction of CD74 to microglia in normal brain and to GAMs in astrocytomas (Figure 5A–C), whereas its ligand MIF was mainly produced by glioma cells (Figure 5D,E), as previously described by our group 22. CD74 expression correlated positively with the amount of microglia/macrophage markers in gliomas (Figure 6). The surprisingly high amount of CD74 in pilocytic astrocytomas at protein level could also be corroborated at mRNA level assessing publicly available databases (http://hgserver1.amc.nl; pilocytic astrocytomas “Gutman cohort” vs. “Hegi cohort”; P‐value: 3.8e‐27; data not shown). Previous studies revealed that pilocytic astrocytomas display a high amount of macrophages/microglial cells reaching approximately 20% of the total cell count 31. These numbers are in line with our results showing a median percentage of slightly above 20% CD74‐positive GAMs in pilocytic astrocytomas. Of note, similar numbers of macrophages/microglial cells were found in pilocytic astrocytomas WHO grade I as compared with diffuse astrocytomas WHO grade II 31. In contrast, CD74‐positive GAMs were more than twice as high in pilocytic astrocytomas as compared with diffuse astrocytomas in our cohort. As it has been demonstrated that a high amount of GAMs is associated with prolonged recurrence‐free survival in pilocytic astrocytomas and that also the amount of CD74‐positive GAMs is beneficial for glioblastoma patients, the combination of high GAM levels expressing CD74 might especially serve as a signature for beneficial patient survival 10. Although restricted to microglia/macrophages, CD74 might not be expressed by every single microglia/macrophage to the same extent and is therefore possibly related to a distinct activation state/phenotype. Our findings suggest that the MIF‐CD74 system in gliomas most probably acts in a paracrine way between MIF‐producing glioma cells 22 and CD74‐expressing GAMs. An autocrine CD74‐independent MIF stimulation of tumor cells 19 is likewise a possible scenario of MIF signaling. CD74 could also, rather than acting in MIF signaling, be involved in intracellular mechanisms as for example the negative regulation of tumor antigen presentation 26 by GAMs. We could neither detect an impact of the MIF‐CD74 system on polarization nor on morphology in CD11b‐MACS® sorted GAMs (Figure 7). These findings are perfectly in line with previous studies showing that—other than IL‐10 for M1 or interferon (IFN)‐γ for M2 polarization—MIF did not change the immune polarization profile of bone marrow‐derived cells 32. In contrast, the established M2 stimulus M‐CSF quickly induced distinct changes of GAM morphology (Figure 7). Again, our findings concerning CD74 stimulation did not reveal an induction of the M2 phenotype in glioma‐TAM via the MIF‐CD74 axis. This is confirmed by the analysis of TCGA data, showing a correlation of CD74 and M1 polarization markers (Figure 7). Of note, the M1‐signature of GAMs in our study was not homogenous but intermingled with classical M2 molecules, which, however, are mainly responsible for phagocytic activity or cellular adhesion. Related to our findings, several other studies revealed distinct macrophage subtypes showing neither an unequivocal M1 nor M2 immune phenotype 29. Most of the M1/M2 data are derived from studies assessing macrophages in the setting of inflammatory diseases, but only poor data exist about M1/M2 polarization in the context of glioma 13. To date, one can only speculate about a more pronounced M2 phenotype in gliomas as there is (i) a deficiency in antitumor response and lack of pronounced M1‐type polarized GAM; (ii) a secretion of a multitude of immunosuppressive molecules by glioma cells; and (iii) a secretion of pro‐angiogenic and glioma‐stimulating molecules by GAMs 13. Our findings of an increased fraction of CD74‐positive GAMs in glioblastomas being an independent prognostic factor for longer survival of glioblastoma patients might be due to the association with a beneficial, tumor‐attacking M1 GAM phenotype related to a distinct activation state of CD74‐positive GAMs (Figure 8). Very recently, intratumoral CD74 levels have also been described as an independent prognostic marker in other tumor entities such as pleural mesothelioma 24. Still, considering its role in the transport of MHC class II antigen molecules, this role of CD74 could also be related to antigen presentation without being linked to MIF signaling.
In conclusion, our data provide evidence that CD74 expression is restricted to GAMs in gliomas contrasting findings of several other peripheral tumor entities. In addition, the finding that high CD74 levels were associated with significantly better patient survival in glioblastomas might be related to the fact that the glioma areas with high CD74 expression levels mainly showed a M1‐polarized signature.
Conflict of Interest
The authors declare that they have no conflict of interest.
Supporting information
Figure S1. CD74 is not expressed by lymphocytes or astrocytic cells in normal CNS and glioma tissue. Double‐IF staining of CD74 (Alexa 568, red) and the lymphocyte marker CD3 (Alexa 488, green) show no colocalization in (A) normal‐appearing white matter (NAWM) of remote areas in glioblastoma and (B) glioblastoma center. Likewise, the GFAP (Alexa 488, green) expression was not colocalized with CD74 (Alexa 568, red) in (C) NAWM in remote areas in glioblastoma or in (D) glioblastoma center.
Figure S2. Characterization of CD11b isolated cell suspension by FACS and IHC. (A, B) FACS analyses performed in collaboration with Miltenyi Biotec of CD11b‐MACS sorted GAMs showed a high purity of 96.6% determined by double staining of CD11b and CD45. The histopathologic characterization of the isolated cell suspension (D) include immunocytochemistry stainings for (C) the proliferation marker MIB/Ki67 and the particular microglia‐ and macrophage markers (E) Iba1, (F) MHCII, (G) CD45 and as a control (H) GFAP. The isolated cells also show a marked (I) CD74 expression.
References
- 1. Al Abed Y, Dabideen D, Aljabari B, Valster A, Messmer D, Ochani M et al (2005) ISO‐1 binding to the tautomerase active site of MIF inhibits its pro‐inflammatory activity and increases survival in severe sepsis. J Biol Chem 280:36541–36544. [DOI] [PubMed] [Google Scholar]
- 2. An JH, Lee SY, Jeon JY, Cho KG, Kim SU, Lee MA (2009) Identification of gliotropic factors that induce human stem cell migration to malignant tumor. J Proteome Res 8:2873–2881. [DOI] [PubMed] [Google Scholar]
- 3. Apte RS, Sinha D, Mayhew E, Wistow GJ, Niederkorn JY (1998) Cutting edge: role of macrophage migration inhibitory factor in inhibiting NK cell activity and preserving immune privilege. J Immunol 160:5693–5696. [PubMed] [Google Scholar]
- 4. Bacher M, Schrader J, Thompson N, Kuschela K, Gemsa D, Waeber G, Schlegel J (2003) Up‐regulation of macrophage migration inhibitory factor gene and protein expression in glial tumour cells during hypoxic and hypoglycemic stress indicates a critical role for angiogenesis in glioblastoma multiforme. Am J Pathol 162:11–17. [DOI] [PMC free article] [PubMed] [Google Scholar]
- 5. Baron N, Deuster O, Noelker C, Stüer C, Strik H, Schaller C et al (2011) Role of macrophage migration inhibitory factor in primary glioblastoma multiforme cells. J Neurosci Res 89:711–717. [DOI] [PubMed] [Google Scholar]
- 6. Berkova Z, Tao RH, Samaniego F (2010) Milatuzumab—a promising new immunotherapeutic agent. Expert Opin Investig Drugs 19:141–149. [DOI] [PubMed] [Google Scholar]
- 7. Bernhagen J, Krohn R, Lue H, Gregory JL, Zernecke A, Koenen RR et al (2007) MIF is a noncognate ligand of CXC chemokine receptors in inflammatory and atherogenic cell recruitment. Nat Med 13:587–596. [DOI] [PubMed] [Google Scholar]
- 8. Binsky I, Haran M, Starlets D, Gore Y, Lantner F, Harpaz N et al (2007) IL‐8 secreted in a macrophage migration‐inhibitory factor‐ and CD74‐dependent manner regulates B cell chronic lymphocytic leukemia survival. Proc Natl Acad Sci U S A 104:13408–13413. [DOI] [PMC free article] [PubMed] [Google Scholar]
- 9. Burnett GT, Weathersby DC, Taylor TE, Bremner TA (2008) Regulation of inflammation‐ and angiogenesis‐related gene expression in breast cancer cells and co‐cultured macrophages. Anticancer Res 28(4B):2093–2099. [PubMed] [Google Scholar]
- 10. Dorward IG, Luo J, Perry A, Gutmann DH, Mansur DB, Rubin JB, Leonard JR (2010) Postoperative imaging surveillance in pediatric pilocytic astrocytomas. J Neurosurg Pediatr 6:346–352. [DOI] [PubMed] [Google Scholar]
- 11. Du W, Wright BM, Li X, Finke J, Rini BI, Zhou M et al (2013) Tumor‐derived macrophage migration inhibitory factor promotes an autocrine loop that enhances renal cell carcinoma. Oncogene 32:1469–1474. [DOI] [PubMed] [Google Scholar]
- 12. Gore Y, Starlets D, Maharshak N, Becker‐Herman S, Kaneyuki U, Leng L et al (2008) Macrophage migration inhibitory factor induces B cell survival by activation of a CD74‐CD44 receptor complex. J Biol Chem 283:2784–2792. [DOI] [PubMed] [Google Scholar]
- 13. Kennedy BC, Showers CR, Anderson DE, Anderson L, Canoll P, Bruce JN, Anderson RC (2013) Tumor‐associated macrophages in glioma: friend or foe? J Oncol 2013:486912. [DOI] [PMC free article] [PubMed] [Google Scholar]
- 14. Kitange GJ, Carlson BL, Schroeder MA, Decker PA, Morlan BW, Wu W et al (2010) Expression of CD74 in high grade gliomas: a potential role in temozolomide resistance. J Neurooncol 100:177–186. [DOI] [PMC free article] [PubMed] [Google Scholar]
- 15. Komohara Y, Ohnishi K, Kuratsu J, Takeya M (2008) Possible involvement of the M2 anti‐inflammatory macrophage phenotype in growth of human gliomas. J Pathol 216:15–24. [DOI] [PubMed] [Google Scholar]
- 16. Krockenberger M, Dombrowski Y, Weidler C, Ossadnik M, Hönig A, Häusler S et al (2008) Macrophage migration inhibitory factor contributes to the immune escape of ovarian cancer by down‐regulating NKG2D. J Immunol 180:7338–7348. [DOI] [PMC free article] [PubMed] [Google Scholar]
- 17. Leng L, Metz CN, Fang Y, Xu J, Donnelly S, Baugh J et al (2003) MIF signal transduction initiated by binding to CD74. J Exp Med 197:1467–1476. [DOI] [PMC free article] [PubMed] [Google Scholar]
- 18. Liu YH, Lin CY, Lin WC, Tang SW, Lai MK, Lin JY (2008) Up‐regulation of vascular endothelial growth factor‐D expression in clear cell renal cell carcinoma by CD74: a critical role in cancer cell tumorigenesis. J Immunol 181:6584–6594. [DOI] [PubMed] [Google Scholar]
- 19. Lue H, Kapurniotu A, Fingerle‐Rowson G, Roger T, Leng L, Thiele M et al (2006) Rapid and transient activation of the ERK MAPK signalling pathway by macrophage migration inhibitory factor (MIF) and dependence on JAB1/CSN5 and Src kinase activity. Cell Signal 18:688–703. [DOI] [PubMed] [Google Scholar]
- 20. Lue H, Thiele M, Franz J, Dahl E, Speckgens S, Leng L et al (2007) Macrophage migration inhibitory factor (MIF) promotes cell survival by activation of the Akt pathway and role for CSN5/JAB1 in the control of autocrine MIF activity. Oncogene 26:5046–5059. [DOI] [PubMed] [Google Scholar]
- 21. McClelland M, Zhao L, Carskadon S, Arenberg D (2009) Expression of CD74, the receptor for macrophage migration inhibitory factor, in non‐small cell lung cancer. Am J Pathol 174:638–646. [DOI] [PMC free article] [PubMed] [Google Scholar]
- 22. Mittelbronn M, Platten M, Zeiner P, Dombrowski Y, Frank B, Zachskorn C et al (2011) Macrophage migration inhibitory factor (MIF) expression in human malignant gliomas contributes to immune escape and tumour progression. Acta Neuropathol 122:353–365. [DOI] [PubMed] [Google Scholar]
- 23. Ohgaki H, Kleihues P (2005) Population‐based studies on incidence, survival rates, and genetic alterations in astrocytic and oligodendroglial gliomas. J Neuropathol Exp Neurol 64:479–489. [DOI] [PubMed] [Google Scholar]
- 24. Otterstrom C, Soltermann A, Opitz I, Felley‐Bosco E, Weder W, Stahel RA et al (2014) CD74: a new prognostic factor for patients with malignant pleural mesothelioma. Br J Cancer 110:2040–2046. [DOI] [PMC free article] [PubMed] [Google Scholar]
- 25. Piette C, Deprez M, Roger T, Noël A, Foidart JM, Munaut C (2009) The dexamethasone‐induced inhibition of proliferation, migration, and invasion in glioma cell lines is antagonized by macrophage migration inhibitory factor (MIF) and can be enhanced by specific MIF inhibitors. J Biol Chem 284:32483–32492. [DOI] [PMC free article] [PubMed] [Google Scholar]
- 26. Qiu G, Goodchild J, Humphreys RE, Xu M (1999) Cancer immunotherapy by antisense suppression of Ii protein in MHC‐class‐II‐positive tumor cells. Cancer Immunol Immunother 48:499–506. [DOI] [PMC free article] [PubMed] [Google Scholar]
- 27. Repp AC, Mayhew ES, Apte S, Niederkorn JY (2000) Human uveal melanoma cells produce macrophage migration‐inhibitory factor to prevent lysis by NK cells. J Immunol 165:710–715. [DOI] [PubMed] [Google Scholar]
- 28. Shi X, Leng L, Wang T, Wang W, Du X, Li J et al (2006) CD44 is the signaling component of the macrophage migration inhibitory fac‐ tor‐CD74 receptor complex. Immunity 25:595–606. [DOI] [PMC free article] [PubMed] [Google Scholar]
- 29. Stables MJ, Shah S, Camon EB, Lovering RC, Newson J, Bystrom J et al (2011) Transcriptomic analyses of murine resolution‐phase macrophages. Blood 118:e192–e208. [DOI] [PMC free article] [PubMed] [Google Scholar]
- 30. Starlets D, Gore Y, Binsky I, Haran M, Harpaz N, Shvidel L et al (2006) Cell‐surface CD74 initiates a signaling cascade leading to cell proliferation and survival. Blood 107:4807–4816. [DOI] [PubMed] [Google Scholar]
- 31. Tanaka Y, Sasaki A, Ishiuchi S, Nakazato Y (2008) Diversity of glial cell components in pilocytic astrocytoma. Neuropathology 28:399–407. [DOI] [PubMed] [Google Scholar]
- 32. Tuchscheerer N, Molin D, Schulten H, Kanzler I, Liehn EA, Steffens G et al (2010) Macrophage inhibitory factor, a CXCR ligand with potential function in collateral artery growth. Eur Heart J 31(Abstract Suppl.):1020. [Google Scholar]
- 33. Wen PY, Kesari S (2008) Malignant gliomas in adults. N Engl J Med 359:492–507. [DOI] [PubMed] [Google Scholar]
Associated Data
This section collects any data citations, data availability statements, or supplementary materials included in this article.
Supplementary Materials
Figure S1. CD74 is not expressed by lymphocytes or astrocytic cells in normal CNS and glioma tissue. Double‐IF staining of CD74 (Alexa 568, red) and the lymphocyte marker CD3 (Alexa 488, green) show no colocalization in (A) normal‐appearing white matter (NAWM) of remote areas in glioblastoma and (B) glioblastoma center. Likewise, the GFAP (Alexa 488, green) expression was not colocalized with CD74 (Alexa 568, red) in (C) NAWM in remote areas in glioblastoma or in (D) glioblastoma center.
Figure S2. Characterization of CD11b isolated cell suspension by FACS and IHC. (A, B) FACS analyses performed in collaboration with Miltenyi Biotec of CD11b‐MACS sorted GAMs showed a high purity of 96.6% determined by double staining of CD11b and CD45. The histopathologic characterization of the isolated cell suspension (D) include immunocytochemistry stainings for (C) the proliferation marker MIB/Ki67 and the particular microglia‐ and macrophage markers (E) Iba1, (F) MHCII, (G) CD45 and as a control (H) GFAP. The isolated cells also show a marked (I) CD74 expression.


