This study uses data from Philadelphia, Chicago, and New York City and the Centers for Disease Control and Prevention Social Vulnerability Index to explore inequities in COVID-19 testing, positivity, confirmed cases, and mortality during the first 6 months of the COVID-19 pandemic.
Visual Abstract. Spatial Inequities in COVID-19 Variables in 3 U.S. Cities.
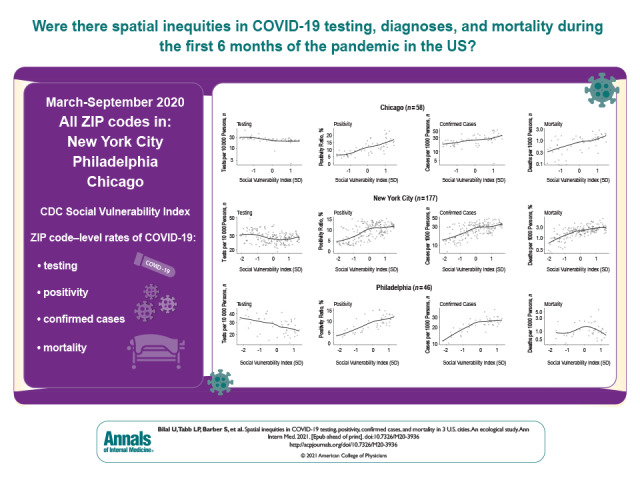
This study uses data from Philadelphia, Chicago, and New York City and the Centers for Disease Control and Prevention Social Vulnerability Index to explore inequities in COVID-19 testing, positivity, confirmed cases, and mortality during the first 6 months of the COVID-19 pandemic.
Abstract
Background:
Preliminary evidence has shown inequities in coronavirus disease 2019 (COVID-19)–related cases and deaths in the United States.
Objective:
To explore the emergence of spatial inequities in COVID-19 testing, positivity, confirmed cases, and mortality in New York, Philadelphia, and Chicago during the first 6 months of the pandemic.
Design:
Ecological, observational study at the ZIP code tabulation area (ZCTA) level from March to September 2020.
Setting:
Chicago, New York, and Philadelphia.
Participants:
All populated ZCTAs in the 3 cities.
Measurements:
Outcomes were ZCTA-level COVID-19 testing, positivity, confirmed cases, and mortality cumulatively through the end of September 2020. Predictors were the Centers for Disease Control and Prevention Social Vulnerability Index and its 4 domains, obtained from the 2014–2018 American Community Survey. The spatial autocorrelation of COVID-19 outcomes was examined by using global and local Moran I statistics, and estimated associations were examined by using spatial conditional autoregressive negative binomial models.
Results:
Spatial clusters of high and low positivity, confirmed cases, and mortality were found, co-located with clusters of low and high social vulnerability in the 3 cities. Evidence was also found for spatial inequities in testing, positivity, confirmed cases, and mortality. Specifically, neighborhoods with higher social vulnerability had lower testing rates and higher positivity ratios, confirmed case rates, and mortality rates.
Limitations:
The ZCTAs are imperfect and heterogeneous geographic units of analysis. Surveillance data were used, which may be incomplete.
Conclusion:
Spatial inequities exist in COVID-19 testing, positivity, confirmed cases, and mortality in 3 large U.S. cities.
Primary Funding Source:
National Institutes of Health.
As of the end of 2020, the coronavirus disease 2019 (COVID-19) pandemic had taken the lives of more than 1.5 million people worldwide and more than 350 000 in the United States (1). Cities worldwide have emerged as especially vulnerable to COVID-19. Cities are characterized by diverse populations and are home to pronounced differences in health by race and socioeconomic position; these differences are often called “health inequities” because they are avoidable and unjust (2). The presence of large racial and ethnic differences in COVID-19 within U.S. cities has been documented. For example, in New York, both Black persons and Hispanic persons have double the age-adjusted mortality rate of non-Hispanic White persons (3); in Chicago, 50% of deaths have occurred in Black persons, who make up only 30% of the population (4); and in Philadelphia, age-specific incidence, hospitalization, and mortality rates are 2 to 3 times higher for Black persons and Hispanic persons than for non-Hispanic White persons (5). These stark differences by race are consistent with racial health inequities in many health outcomes and probably reflect multiple interrelated processes linked to structural inequity, historical racist policies, and residential segregation (6–8).
Cities in the United States are characterized by strong residential segregation by both race/ethnicity and income, one of the most visible manifestations of structural racism (9). Residential segregation results in stark differences across neighborhoods in multiple factors that could be related to both the incidence and severity of COVID-19, including factors related to transmission (such as overcrowding and jobs that do not allow social distancing) and to severity of disease (such as a higher prevalence of chronic health conditions related to neighborhood environments, greater air pollution exposure, and limited access to quality health care) (6–8, 10, 11). Few studies have systematically characterized spatial inequities in COVID-19–related outcomes in cities over the course of the pandemic.
Characterizing social and spatial inequities in cities is critical to developing appropriate interventions and policies to prevent COVID-19 deaths in the future and mitigate economic and racial inequities. We used data from 3 large U.S. cities—Chicago, New York, and Philadelphia—to characterize spatial and social inequities in testing, positivity, confirmed cases, and mortality.
Methods
Setting
We used data on the total numbers of tests, confirmed cases, and deaths by ZIP code tabulation area (ZCTA) of residence from Chicago, New York, and Philadelphia. For Chicago, we downloaded data (including cumulative data) from the Chicago Department of Public Health (12) through 3 October 2020. For New York, we downloaded cumulative data made available by New York Department of Health and Mental Hygiene in their GitHub repository (13) through 1 October 2020. For Philadelphia, we downloaded data (including cumulative data) from the Philadelphia Department of Public Health made available in OpenDataPhilly (5) through 1 October 2020.
Outcomes
Study outcomes were 4 COVID-19 indicators: testing rates (total tests per 10 000 persons), positivity ratio (14) (positive tests per total tests), confirmed case rates (confirmed cases per 1000 persons), and mortality rates (deaths per 1000 persons). For all indicators, we computed rates cumulatively through the end of the study period.
Predictors
To obtain a summary of social conditions in each area of residence, we used the Centers for Disease Control and Prevention's Social Vulnerability Index (SVI) (15). Recent research has found the SVI is predictive of COVID-19 incidence and mortality at the county level (16). The SVI reflects a community's ability to prevent human suffering and financial loss in the event of disaster, including disease outbreaks (15). It includes 4 domains—socioeconomic status, household composition and disability, minority status and language, and housing type and transportation—along with a summary score including all 4 domains. The 4 domains and summary score were calculated by the Centers for Disease Control and Prevention at the census tract level by using data from 15 variables from the 2014–2018 American Community Survey. Census tracts were ranked according to the values of each of the 15 variables, and percentile ranks were computed for each census tract within each state (in this case, Illinois, New York, and Pennsylvania). The Supplement provides more details.
To aggregate the SVI to the ZCTA level, we used the Census Bureau's ZCTA to Census Tract Relationship File and computed a weighted mean of the SVI by ZCTA, using the population of the census tract in the ZCTA as the weight. A higher value of the SVI or of its component scores signifies higher vulnerability, either overall or in its 4 domains. For example, higher vulnerability in the socioeconomic status domain reflects a higher proportion of people living in poverty, unemployed, with lower income, or without a high school diploma. Higher vulnerability in the housing type and transportation domain reflects a higher number of people living in multiunit structures or mobile homes, in crowded situations, without a vehicle, or in group quarters.
Because the SVI represents the rank of each census tract or ZCTA within each state, we transformed the SVI to make coefficients comparable across cities. We first excluded all ZCTAs that were not part of each city and then standardized SVI and its domain scores by subtracting the mean and dividing by the SD for each city separately.
Statistical Analysis
We conducted our analysis in 3 steps. First, we explored the spatial distribution of each of the 5 predictors (the 4 SVI domains and summary score) and the 4 COVID-19 outcomes (testing, positivity, confirmed cases, and mortality) cumulatively through the end of September by using choropleth maps. To explore whether there was spatial autocorrelation, we computed the global Moran I statistic (17, 18). To show the location of spatial clusters, we computed the local indicator of spatial association or local Moran I statistic (17, 18) and displayed clusters with a P value less than 0.05.
The global Moran I statistic estimates the overall degree of spatial correlation— that is, the degree to which the ZTCA rates of interest, such as testing, tend to be geographically located close together, far apart, or distributed randomly across the larger area (in this case, each city). The Moran I statistic ranges from –1 to 1; positive values suggest positive spatial autocorrelation (that is, similar rates located next to each other), negative values suggest negative spatial autocorrelation or dispersion (that is, similar rates located far from each other), and values close to 0 indicate a random distribution. Significant P values indicate evidence of departures from complete randomness.
The local Moran I statistic for each individual ZTCA reflects the similarity of rates with those of nearby areas and can help identify outliers. These local indices are relative measures with dimensions interpretable only by Z scores and their associated P values. Hot spots are contiguous areas with consistently high testing rates; outliers would, for example, be areas with high testing rates surrounded primarily by areas with lower testing rates. Likewise, cold spots are contiguous areas with consistently low testing rates; in this instance, outliers would be areas with low testing rates surrounded primarily by areas with higher testing rates.
Second, we examined the relationship between SVI and each of the outcomes through the end of the study period by using scatter plots and smoothed loess lines. Third, to estimate the strength of the association between each predictor and outcome, we considered using a Poisson model. However, after exploring the distribution of the outcomes, and after using the approach of Gelman and Hill (19) to check for overdispersion in Poisson models, we opted for a negative binomial model. Negative binomial models relax the assumption of equality between the mean and variance, allowing for overdispersion. We fitted a separate model for each city and included the 5 predictors in separate models. To account for the role of age in determining testing practices and influencing the probability of transmission and its causal role in mortality, we adjusted all models by the percentage of people aged 65 years or older in the ZCTA.
To account for spatial autocorrelation of the outcomes, we fitted a Besag–York–Mollié conditional autoregressive model (20), including a structured and unstructured ZCTA random effect, both following an intrinsic Gaussian Markov random field (20). The structured spatial random effect takes into consideration that ZCTAs are more similar to other neighboring ZCTAs than to those further away. We defined neighboring ZCTAs on the basis of regions with contiguous boundaries, defined as sharing 1 or more boundary point. We fitted this model by using integrated nested Laplace approximations, a method approximating Bayesian inference (20, 21). Although this approach is an approximation-based method, it has previously shown accuracy and minimizes computational time (20–22). Details on model specification are provided in the Supplement. Results are shown as rate ratios associated with a 1-SD higher value of the SVI or its domains, separately for each city.
All analyses were conducted by using R, version 4.0.2 (23). Spatial analyses were conducted by using the R package spdep (24) and R-INLA (25). More details on data management, the SVI, and the models are available in the Supplement. The code for replication is available at https://github.com/usamabilal/COVID_Disparities.
Role of the Funding Source
This study was funded by the National Institutes of Health and the Robert Wood Johnson Foundation. The funders had no role in study design, data collection and analysis, decision to publish, or preparation of the manuscript.
Results
A total of 58, 177, and 46 ZIP codes in Chicago, New York, and Philadelphia, respectively, were included in the study. From the beginning of the outbreak up to the latest available date (3 October 2020 in Chicago and 1 October 2020 in New York and Philadelphia), a total of 674 929, 2 383 919, and 411 559 COVID-19 tests had been conducted in Chicago, New York, and Philadelphia, respectively. There were 81 657, 233 397, and 37 307 confirmed COVID-19 cases and 2974, 19 149, and 1803 COVID-19 deaths, respectively.
We found that testing, positivity, confirmed cases, and mortality were spatially autocorrelated in the 3 cities (global Moran I ranging from 0.198 to 0.803; P < 0.001 in all cases except confirmed cases in Philadelphia, with P = 0.011, for the null hypothesis of no spatial autocorrelation), with the exception of mortality in Philadelphia, for which we did not find evidence for significant spatial autocorrelation (global Moran I = 0.062; P = 0.140). These patterns held after the spatial distribution of the SVI was taken into account (global Moran I ranging from 0.127 to 0.705; P < 0.05 in all cases), with the exception of confirmed cases and mortality for Philadelphia, which did not show significant spatial autocorrelation after the SVI was controlled for (Moran I = –0.011 and –0.058; P = 0.440 and P = 0.630, respectively). The Supplement shows the global Moran I statistics and associated Moran scatter plots for the 3 cities and 4 outcomes.
Figures 1 to 3 show the spatial patterning of clusters of COVID-19 testing, positivity, confirmed cases, mortality, and SVI in Chicago, New York, and Philadelphia. In general, clusters of high positivity and confirmed cases were spatially co-located with clusters of high social vulnerability.
Figure 1. Spatial distribution and clusters of coronavirus disease 2019 testing, positivity, confirmed cases, and mortality and social vulnerability in ZIP code tabulation areas of Chicago.
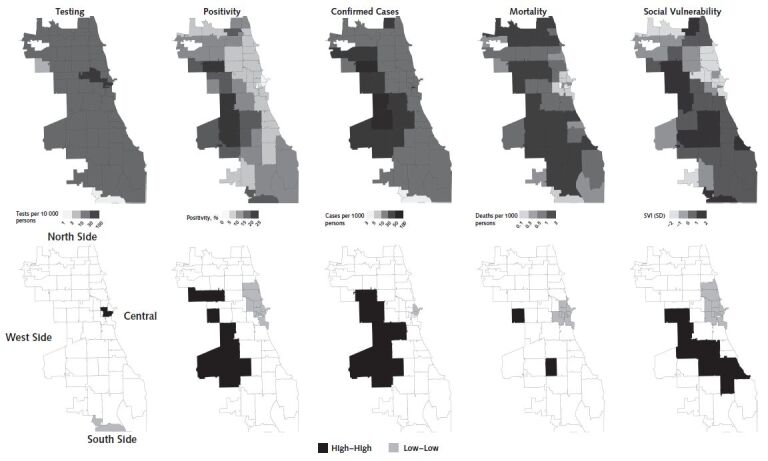
Clusters were calculated by using the local Moran I statistic; clusters have a P value < 0.05. “High–high” indicates hot spots and “low–low” indicates cold spots. SVI = Social Vulnerability Index.
Figure 2. Spatial distribution and clusters of coronavirus disease 2019 testing, positivity, confirmed cases, and mortality and social vulnerability in ZIP code tabulation areas of New York.
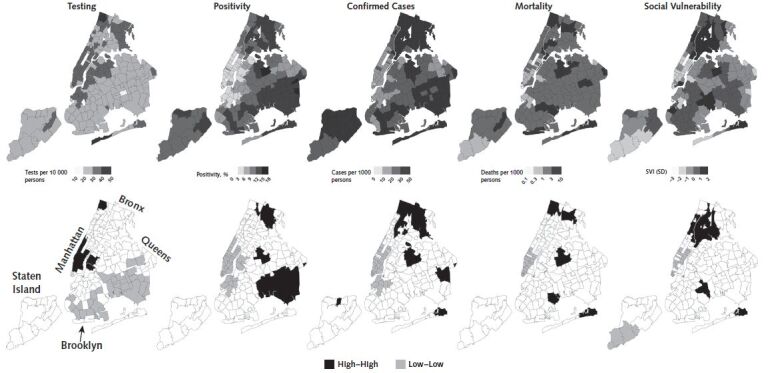
Clusters were calculated by using the local Moran I statistic; clusters have a P value < 0.05. “High–high” indicates hot spots and “low–low” indicates cold spots. SVI = Social Vulnerability Index.
Figure 3. Spatial distribution and clusters of coronavirus disease 2019 testing, positivity, confirmed cases, and mortality and social vulnerability in ZIP code tabulation areas of Philadelphia.
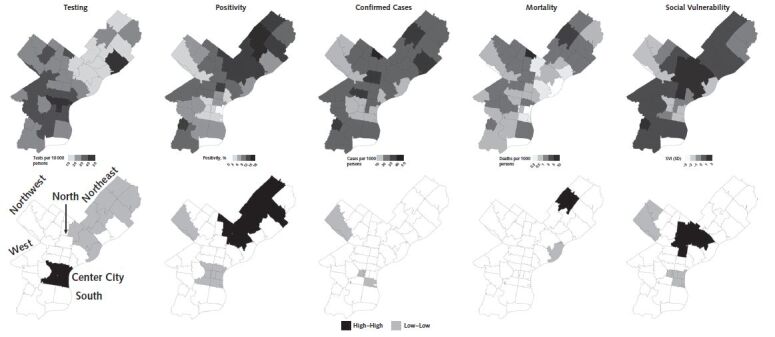
Clusters were calculated by using the local Moran I statistic; clusters have a P value < 0.05. “High–high” indicates hot spots and “low–low” indicates cold spots. SVI = Social Vulnerability Index.
Areas of the West and South sides of Chicago have clusters of high positivity, confirmed cases, and mortality (Figure 1). For example, ZCTAs 60636 and 60644 in the South Side and West Side, respectively, are significant clusters of high positivity (local Moran I = 5.32 and 2.81; P < 0.001 and P = 0.018), confirmed cases (local Moran I = 5.55 and 3.65; P = 0.007 and 0.013), and mortality (local Moran I = 4.61 and 3.26; P = 0.020 and 0.024). Conversely, the Central and North sides of Chicago had clusters of low positivity, confirmed cases, and mortality, along with high testing (Figure 1). For example, ZCTA 60601 in Central Chicago is a cluster of high testing and low positivity, confirmed cases, and mortality (local Moran I = 5.50, 9.53, 5.88, and 6.78; P = 0.003, P = 0.004, P < 0.001, and P = 0.001), whereas ZCTA 60661 in the North Side is a cluster of low positivity and mortality (local Moran I = 4.09 and 6.22, P = 0.015 and P < 0.001).
In New York, there were clusters of high positivity, confirmed cases, and mortality in the Bronx and Queens (Figure 2). For example, ZCTAs 10467 and 11368 in the Bronx and Queens are statistically significant clusters of high positivity (local Moran I = 6.02 and 6.36; P = 0.019 and 0.010), confirmed cases (local Moran I = 14.2 and 11.46; P < 0.001 for both), and mortality (local Moran I = 6.17 and 13.54; P = 0.016 and P < 0.001). There were also clusters of high testing and low positivity, confirmed cases, and mortality in Manhattan and the adjacent areas of Brooklyn (Figure 2). For example, ZCTA 10014 in Manhattan is a cluster of high testing, low positivity, confirmed cases, and mortality (local Moran I = 7.08, 7.15, 8.71, and 4.10; P < 0.001, P < 0.001, P < 0.001, and P = 0.008), whereas ZCTA 11238 in Brooklyn is a cluster of low positivity and confirmed cases (local Moran I = 6.97 and 5.17; P = 0.009 and P < 0.001).
In Philadelphia (Figure 3), we found clusters of high testing and low positivity and confirmed cases in Center City, including ZCTAs 19102 (local Moran I = 18.87, 3.90, and 11.04; P < 0.001, P < 0.001, and P = 0.037) and 19103 (local Moran I = 5.44, 5.35, and 7.341; P = 0.002, P = 0.002, and P < 0.001). Most of North and Northeast Philadelphia was contained in a cluster of low testing and high positivity. For example, ZCTAs 19124 and 19149 are significant clusters of low testing (local Moran I = 8.02 and 4.43; P < 0.001 and P = 0.009) and high positivity (local Moran I = 5.51 and 7.70; P = 0.010 and P < 0.001).
Figure 4 shows the relationship between the SVI and cumulative testing rates, positivity ratios, confirmed case rates, and mortality rates in the 3 cities. Testing rates were slightly lower in areas of higher vulnerability in Chicago, New York, and Philadelphia. Positivity, confirmed cases, and mortality all increased monotonically with increasing social vulnerability in Chicago. A similar pattern was observed in New York, but the increase was less marked in ZCTAs above mean vulnerability. Similar patterns were observed in Philadelphia for positivity and confirmed cases, but the SVI was not consistently associated with mortality.
Figure 4. Scatter plots showing the relationship between the Social Vulnerability Index and coronavirus disease 2019 testing, positivity, confirmed cases, and mortality in ZIP code tabulation areas of Chicago, New York, and Philadelphia.
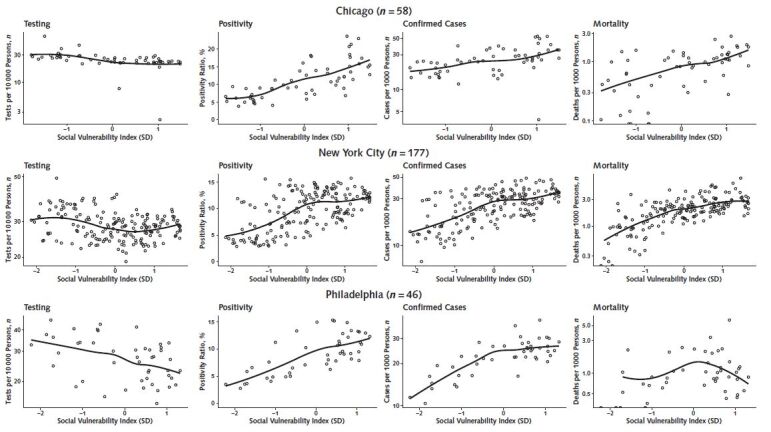
Solid lines in graph are loess smoothers. The Social Vulnerability Index has been standardized for each city, so that its units are the SD of the Social Vulnerability Index for each city separately.
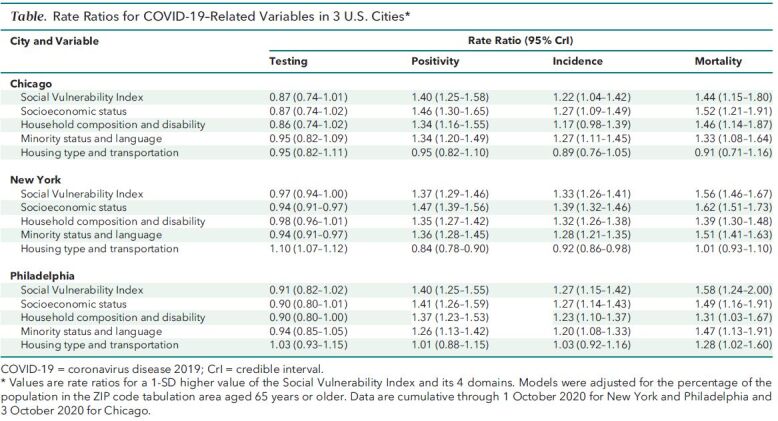
The Table shows rate ratios for each outcome (cumulatively across the full study period) associated with a 1-SD higher value of the SVI index and its 4 domains, after adjustment for the percentage of the population aged 65 years or older. Higher social vulnerability was associated with 13% lower testing rates in Chicago, 3% lower rates in New York, and 9% lower rates in Philadelphia, although credible intervals crossed the null. Associations of SVI with positivity, confirmed cases, and mortality were similar in the 3 cities. A 1-SD higher SVI was associated with 40%, 37%, and 40% higher positivity in Chicago, New York, and Philadelphia, respectively; 22%, 33%, and 27% higher confirmed cases; and 44%, 56%, and 58% higher mortality. For the 3 cities, we found that the 3 social vulnerability domains of socioeconomic status, household composition and disability, and minority status and language were associated with the study outcomes similarly to the overall index. However, weaker or even opposite associations were observed for the housing type and transportation domain.
Table. Rate Ratios for COVID-19–Related Variables in 3 U.S. Cities*.
Discussion
We documented large spatial inequities in COVID-19 through the end of September 2020 in 3 large U.S. cities: Chicago, New York, and Philadelphia. More vulnerable neighborhoods in these cities had higher rates of COVID-19 positivity, confirmed cases, and mortality and lower testing rates. We also found clusters of high and low positivity, confirmed cases, and mortality, co-located with areas of high and low vulnerability, respectively. Notably, we observed very strong inequities in mortality, with mortality rates increasing by about 50% for each 1-SD increase in the SVI.
Our findings are consistent with those of other studies that have examined inequities in COVID-19 incidence by ZCTA in other cities. For example, Chen and Krieger (10) reported a monotonic increase in confirmed cases in ZCTAs of Illinois and New York with decreasing area-level socioeconomic status. Analysis at the county level by these investigators showed similar gradients (10), consistent with other research (26, 27), including a study using the SVI as a predictor at the county level (16). We found that within these large cities, clusters of high and low positivity and confirmed cases were mostly co-located with clusters of high and low vulnerability, respectively. These include areas of concentrated poverty and with a history of extreme racial segregation (7), including West and North Philadelphia, the West Side of Chicago, and the Bronx in New York. Notably, Chicago, Philadelphia, and New York are among the top 10 most segregated cities in the United States (28).
As other researchers have noted (6–8), potential explanations for neighborhood inequities in incidence may include differential exposure to COVID-19 and as well as differential susceptibility to infection. Residents of higher SVI neighborhoods likely have higher exposure to COVID-19 because of the types of jobs they have (such as essential workers in the health care, personal care, production, or service industries [29] and personal care or service occupations [30]), lack of telecommuting options (31), dependence on mass transit (32), and overcrowding within households (33). Whether there are factors associated with differential susceptibility to infection is still unclear, but prior research on respiratory viruses has documented that stress linked to disadvantage may increase the likelihood of developing disease after exposure (34, 35).
We also found narrow inequities in testing, accompanied by wider inequities in positivity. The inequities in positivity suggest that despite apparently small inequities in testing, the rate of testing may actually be lower than it needs to be in neighborhoods with high SVI and possibly higher incidence. Barriers to testing can include unequal location of testing sites (36), lack of vehicle ownership (37), lack of health insurance (38), lack of a usual source of care for referrals (39), and potential mistrust of the medical system (40). It is possible that the social patterning of infection has been changing over time as the pandemic progressed, beginning in wealthier areas (possibly linked to business travel [41]) and subsequently shifting to more deprived areas. As more longitudinal data become available, understanding longitudinal patterns may help in the preparedness for future outbreaks. Our ability to adequately characterize inequities in incidence necessarily requires equal access to testing.
A major finding was the substantially higher mortality rate in neighborhoods with a higher SVI. Vulnerability to severe disease and death from COVID-19 are related to the presence of previous comorbidities, such as cardiovascular disease, diabetes, and hypertension (42). Because these comorbidities are more prevalent in people of lower socioeconomic status and racial/ethnic minorities (43, 44), it is expected that, at equal levels of exposure, these groups will experience more severe consequences from COVID-19. Other factors may also affect the severity of disease and the case-fatality rates, including access to and quality of health care, co-occurring social factors (for example, stressors), and environmental factors (for example, air pollution). A study with 17 million records in the United Kingdom showed that even after adjustment for several comorbid conditions, racial/ethnic minorities and people living in socioeconomically deprived areas had a higher risk for death after contracting COVID-19 (42). However, 2 recent studies using data from Michigan and the Veteran Affairs health system suggest that inequities in mortality are driven by differences in infection rates rather than differential vulnerability (45, 46). We found that the relative risks for mortality associated with higher SVI ZCTAs were slightly higher than those observed for confirmed cases, but underestimation of the underlying incidence in higher SVI neighborhoods (because of lower testing) could partly explain this difference.
We found that the housing type and transportation domain of the SVI showed different associations compared with the other domains or the overall summary SVI. The housing type and transportation domain includes variables detailing the proportion of the population living in multiunit structures, mobile homes, group quarters, or crowded situations or without a vehicle. It is possible that these variables do not relate to differences in COVID-19 outcomes within cities because either they are not heterogeneous enough or they simply do not capture true underlying determinants.
An important limitation of our study is the likely underestimation of inequities in confirmed case rates owing to the lack of systematic widespread testing. We also lack individual-level data and rely on aggregated surveillance data. In addition, ZCTAs are very imperfect proxies for neighborhoods (47). Heterogeneity in the sociodemographic composition within ZCTAs may have led to underestimation of inequities (48). However, ZIP codes represent easy-to-collect data sources during a public health emergency, when more detailed geocoding is less available.
In conclusion, we found large spatial inequities in COVID-19 testing, positivity, confirmed cases, and mortality in 3 large U.S. cities and strong associations of COVID-19 positivity, confirmed cases, and mortality with higher neighborhood social vulnerability. These within-city neighborhood differences in COVID-19 outcomes emerge from differences across neighborhoods generated and reinforced by residential segregation linked to income inequality and structural racism (49–51), coupled with decades of systematic disinvestment in segregated neighborhoods (7–10, 50, 52). Addressing these structural factors linked to income inequality, racism, and segregation will be fundamental to minimizing the toll of the pandemic and to promoting population health and health equity across many other health conditions.
Supplementary Material
Footnotes
This article was published at Annals.org on 30 March 2021.
References
- 1. Dong E , Du H , Gardner L . An interactive web-based dashboard to track COVID-19 in real time [Letter]. Lancet Infect Dis. 2020;20:533-534. [PMID: ] doi: 10.1016/S1473-3099(20)30120-1 [DOI] [PMC free article] [PubMed] [Google Scholar]
- 2. Braveman PA , Kumanyika S , Fielding J , et al. Health disparities and health equity: the issue is justice. Am J Public Health. 2011;101 Suppl 1:S149-55. [PMID: ] doi: 10.2105/AJPH.2010.300062 [DOI] [PMC free article] [PubMed] [Google Scholar]
- 3. New York City Department of Health and Mental Hygiene. COVID-19: data. Accessed at www1.nyc.gov/site/doh/covid/covid-19-data.page on 15 December 2020.
- 4. Eldeib D, Gallardo A, Johnson A, et al. The First 100. COVID-19 took black lives first. it didn't have to. ProPublica. 9 May 2020. Accessed at https://features.propublica.org/chicago-first-deaths/covid-coronavirus-took-black-lives-first on 18 May 2020.
- 5. Philadelphia Department of Public Health. COVID-19 testing and data. Accessed at www.phila.gov/programs/coronavirus-disease-2019-covid-19/testing-and-data on 8 December 2020.
- 6. Bailey ZD , Moon JR . Racism and the political economy of COVID-19: will we continue to resurrect the past. J Health Polit Policy Law. 2020;45:937-950. [PMID: ] doi: 10.1215/03616878-8641481 [DOI] [PubMed] [Google Scholar]
- 7. Barber S, Headen I, Branch B, et al. COVID-19 in Context: Racism, Segregation and Racial Inequities in Philadelphia. Drexel University Urban Health Collaborative; 2020.
- 8. Berkowitz RL, Gao X, Michaels EK, et al. Structurally vulnerable neighbourhood environments and racial/ethnic COVID-19 inequities. Cities Health. 2020:1-4. doi:10.1080/23748834.2020.1792069 [DOI] [PMC free article] [PubMed]
- 9. Williams DR , Collins C . Racial residential segregation: a fundamental cause of racial disparities in health. Public Health Rep. 2001;116:404-16. [PMID: ] [DOI] [PMC free article] [PubMed] [Google Scholar]
- 10. Chen JT , Krieger N . Revealing the unequal burden of COVID-19 by income, race/ethnicity, and household crowding: US county versus zip code analyses. J Public Health Manag Pract. 2021;27 Suppl 1:S43-S56. [PMID: ] doi: 10.1097/PHH.0000000000001263 [DOI] [PubMed] [Google Scholar]
- 11. McClure ES , Vasudevan P , Bailey Z , et al. Racial capitalism within public health-how occupational settings drive COVID-19 disparities. Am J Epidemiol. 2020;189:1244-1253. [PMID: ] doi: 10.1093/aje/kwaa126 [DOI] [PMC free article] [PubMed] [Google Scholar]
- 12. Chicago Department of Public Health. COVID-19 cases, tests, and deaths by ZIP code. Accessed at https://data.cityofchicago.org/Health-Human-Services/COVID-19-Cases-Tests-and-Deaths-by-ZIP-Code/yhhz-zm2v on 7 October 2020.
- 13. New York City Department of Health and Mental Hygiene. New York coronavirus (COVID-19) data. Accessed at https://github.com/nychealth/coronavirus-data on 1 October 2020.
- 14. Randhawa AK , Fisher LH , Greninger AL , et al. Changes in SARS-CoV-2 positivity rate in outpatients in Seattle and Washington state, March 1-April 16, 2020. JAMA. 2020;323:2334-2336. [PMID: ] doi: 10.1001/jama.2020.8097 [DOI] [PMC free article] [PubMed] [Google Scholar]
- 15. Flanagan BE , Hallisey EJ , Adams E , et al. Measuring community vulnerability to natural and anthropogenic hazards: the Centers for Disease Control and Prevention's Social Vulnerability Index. J Environ Health. 2018;80:34-36. [PMID: ] [PMC free article] [PubMed] [Google Scholar]
- 16. Khazanchi R , Beiter ER , Gondi S , et al. County-level association of social vulnerability with COVID-19 cases and deaths in the USA [Letter]. J Gen Intern Med. 2020;35:2784-2787. [PMID: ] doi: 10.1007/s11606-020-05882-3 [DOI] [PMC free article] [PubMed] [Google Scholar]
- 17. Getis A. Spatial autocorrelation. In: Fischer MM, Getis A, eds. Handbook of Applied Spatial Analysis: Software Tools, Methods and Applications: Springer; 2009:255-74.
- 18. Bivand RS, Pebesma E, Gómez-Rubio V. Testing for spatial autocorrelation. In: Applied Spatial Data Analysis With R. 2nd ed. Springer; 2013:275-87.
- 19. Gelman A, Hill J. Poisson regression, exposure, and overdispersion. In: Data Analysis Using Regression and Multilevel/Hierarchical Models. Cambridge Univ Pr; 2006:110-5.
- 20. Blangiardo M, Cameletti M. Spatial modeling. In: Spatial and Spatio-temporal Bayesian Models With R-INLA. J Wiley; 2015:173-234.
- 21. Blangiardo M , Cameletti M , Baio G , et al. Spatial and spatio-temporal models with R-INLA. Spat Spatiotemporal Epidemiol. 2013;7:39-55. [PMID: ] [DOI] [PubMed] [Google Scholar]
- 22. Tabb LP , Ballester L , Grubesic TH . The spatio-temporal relationship between alcohol outlets and violence before and after privatization: a natural experiment, Seattle, Wa 2010-2013. Spat Spatiotemporal Epidemiol. 2016;19:115-124. [PMID: ] doi: 10.1016/j.sste.2016.08.003 [DOI] [PubMed] [Google Scholar]
- 23. R Core Team. R: A Language and Environment for Statistical Computing. R Foundation for Statistical Computing; 2020.
- 24. Bivand R, Anselin L, Berke O, et al. spdep: Spatial dependence: weighting schemes, statistics. R package version 1.1-5. Accessed at http://CRAN.R-project.org/package=spdep on 30 August 2020.
- 25. R-INLA Development Team. The R-INLA project. Accessed at www.r-inla.org/home on 30 August 2020.
- 26. Millett GA , Jones AT , Benkeser D , et al. Assessing differential impacts of COVID-19 on black communities. Ann Epidemiol. 2020;47:37-44. [PMID: ] doi: 10.1016/j.annepidem.2020.05.003 [DOI] [PMC free article] [PubMed] [Google Scholar]
- 27. Rodriguez-Diaz CE , Guilamo-Ramos V , Mena L , et al. Risk for COVID-19 infection and death among Latinos in the United States: examining heterogeneity in transmission dynamics. Ann Epidemiol. 2020;52:46-53.e2. [PMID: ] doi: 10.1016/j.annepidem.2020.07.007 [DOI] [PMC free article] [PubMed] [Google Scholar]
- 28. Massey DS , Tannen J . A research note on trends in black hypersegregation. Demography. 2015;52:1025-34. [PMID: ] doi: 10.1007/s13524-015-0381-6 [DOI] [PMC free article] [PubMed] [Google Scholar]
- 29. Chou R , Dana T , Buckley DI , et al. Epidemiology of and risk factors for coronavirus infection in health care workers. A living rapid review. Ann Intern Med. 2020;173:120-136. [PMID: ]. doi: 10.7326/M20-1632 [DOI] [PMC free article] [PubMed] [Google Scholar]
- 30. Tomer A, Kane JW. How to Protect Essential Workers During COVID-19. Brookings Report. Brookings Institution; March 2020.
- 31. Valentino-DeVries J, Lu D, Dance GJ. Location data says it all: staying at home during coronavirus is a luxury. New York Times. 3 April 2020. Accessed at www.nytimes.com/interactive/2020/04/03/us/coronavirus-stay-home-rich-poor.html on 4 April 2020.
- 32. Anderson M. Who relies on public transit in the U.S. Pew Research Center. 7 April 2016. Accessed at www.pewresearch.org/fact-tank/2016/04/07/who-relies-on-public-transit-in-the-u-s on 7 April 2020.
- 33. Burr JA , Mutchler JE , Gerst K . Patterns of residential crowding among Hispanics in later life: immigration, assimilation, and housing market factors. J Gerontol B Psychol Sci Soc Sci. 2010;65:772-82. [PMID: ] doi: 10.1093/geronb/gbq069 [DOI] [PMC free article] [PubMed] [Google Scholar]
- 34. Cohen S , Tyrrell DA , Smith AP . Psychological stress and susceptibility to the common cold. N Engl J Med. 1991;325:606-12. [PMID: ] [DOI] [PubMed] [Google Scholar]
- 35. Kiecolt-Glaser JK , Glaser R , Gravenstein S , et al. Chronic stress alters the immune response to influenza virus vaccine in older adults. Proc Natl Acad Sci U S A. 1996;93:3043-7. [PMID: ] [DOI] [PMC free article] [PubMed] [Google Scholar]
- 36. Rader B , Astley CM , Sy KTL , et al. Geographic access to United States SARS-CoV-2 testing sites highlights healthcare disparities and may bias transmission estimates. J Travel Med. 2020;27. [PMID: ] doi: 10.1093/jtm/taaa076 [DOI] [PMC free article] [PubMed] [Google Scholar]
- 37. National Equity Atlas. Percent of households without a vehicle by race/ethnicity: United States, 2015. 2020. Accessed at https://nationalequityatlas.org/indicators/Car_access on 7 April 2020.
- 38. Sohn H . Racial and ethnic disparities in health insurance coverage: dynamics of gaining and losing coverage over the life-course. Popul Res Policy Rev. 2017;36:181-201. [PMID: ] doi: 10.1007/s11113-016-9416-y [DOI] [PMC free article] [PubMed] [Google Scholar]
- 39. Ganguli I , Shi Z , Orav EJ , et al. Declining use of primary care among commercially insured adults in the United States, 2008-2016. Ann Intern Med. 2020;172:240-247. [PMID: ]. doi: 10.7326/M19-1834 [DOI] [PubMed] [Google Scholar]
- 40. King WD . Examining African Americans' mistrust of the health care system: expanding the research question. Commentary on “Race and trust in the health care system”. Public Health Rep. 2003;118:366-7. [PMID: ] [DOI] [PMC free article] [PubMed] [Google Scholar]
- 41. Forster P , Forster L , Renfrew C , et al. Phylogenetic network analysis of SARS-CoV-2 genomes. Proc Natl Acad Sci U S A. 2020;117:9241-9243. [PMID: ] doi: 10.1073/pnas.2004999117 [DOI] [PMC free article] [PubMed] [Google Scholar]
- 42. The OpenSAFELY Collaborative; Williamson E, Walker AJ, Bhaskaran KJ, et al. OpenSAFELY: factors associated with COVID-19-related hospital death in the linked electronic health records of 17 million adult NHS patients. medRxiv. Preprint posted online 7 May 2020. doi:10.1101/2020.05.06.20092999
- 43. Kershaw KN , Albrecht SS . Racial/ethnic residential segregation and cardiovascular disease risk. Curr Cardiovasc Risk Rep. 2015;9. [PMID: ] [DOI] [PMC free article] [PubMed] [Google Scholar]
- 44. Raifman MA , Raifman JR . Disparities in the population at risk of severe illness from COVID-19 by race/ethnicity and income. Am J Prev Med. 2020;59:137-139. [PMID: ] doi: 10.1016/j.amepre.2020.04.003 [DOI] [PMC free article] [PubMed] [Google Scholar]
- 45. Zelner J, Trangucci R, Naraharisetti R, et al. Racial disparities in COVID-19 mortality are driven by unequal infection risks. medRxiv. Preprint posted online 11 September 2020. doi:10.1101/2020.09.10.20192369 [DOI] [PMC free article] [PubMed]
- 46. Rentsch CT , Kidwai-Khan F , Tate JP , et al. Patterns of COVID-19 testing and mortality by race and ethnicity among United States veterans: a nationwide cohort study. PLoS Med. 2020;17:e1003379. [PMID: ] doi: 10.1371/journal.pmed.1003379 [DOI] [PMC free article] [PubMed] [Google Scholar]
- 47. Grubesic TH , Matisziw TC . On the use of ZIP codes and ZIP code tabulation areas (ZCTAs) for the spatial analysis of epidemiological data. Int J Health Geogr. 2006;5:58. [PMID: ] [DOI] [PMC free article] [PubMed] [Google Scholar]
- 48. Krieger N , Chen JT , Waterman PD , et al. Geocoding and monitoring of US socioeconomic inequalities in mortality and cancer incidence: does the choice of area-based measure and geographic level matter? The Public Health Disparities Geocoding Project. Am J Epidemiol. 2002;156:471-82. [PMID: ] [DOI] [PubMed] [Google Scholar]
- 49. Bailey ZD , Krieger N , Agénor M , et al. Structural racism and health inequities in the USA: evidence and interventions. Lancet. 2017;389:1453-1463. [PMID: ] doi: 10.1016/S0140-6736(17)30569-X [DOI] [PubMed] [Google Scholar]
- 50. Rothstein R. The Color of Law: A Forgotten History of How Our Government Segregated America. Liveright Publishing; 2017.
- 51. Williams DR , Collins C . Racial residential segregation: a fundamental cause of racial disparities in health. Public Health Rep. 2001;116:404-16. [PMID: ] [DOI] [PMC free article] [PubMed] [Google Scholar]
- 52. Trounstine J. Segregation by Design: Local Politics and Inequality in American Cities. Cambridge Univ Pr; 2018.
Associated Data
This section collects any data citations, data availability statements, or supplementary materials included in this article.


