

Abstract
The impact of physical exercise, as preventative measure, to control the progression of cardiovascular disease in midlife remains under investigation. We aimed to investigate the effect of different levels of intensity of physical activity on metabolic and vascular profile in healthy postmenopausal women. A total of 625 healthy postmenopausal women (mean age 57.7 ± 7.6 years) were evaluated using the short IPAQ questionnaire for quantification of physical activity. The energy expenditure was estimated in metabolic equivalent of energy (MET) hours per week. Pulse wave velocity (PWV) was measured as an index of arterial stiffness. Intima‐media thickness of both right and left common carotid artery, carotid bulb and internal carotid artery, and combined carotid IMT were also assessed by non‐invasive and well‐validated methods. Mean values of PWV decreased linearly with increasing intensity of physical activity (classes of physical activity: sedentary vs walking vs moderate vs vigorous activity: 9.07 ± 1.22 m/s vs 9.12 ± 1.72 m/s vs 8.47 ± 1.31m/s vs 7.94 ± 0.40 m/s, ANOVA P for linear trend .003). In non‐obese postmenopausal women, PWV values associated with: (a) the total number of METs (b‐coefficient = −0.261, P = .002) as well as with SBP; (b) or with the number of moderate METs (b‐coefficient = −0.192, P = .025) as well as with age and SBP. No significant associations were observed between the intensity of physical exercise and arterial stiffness in the overweight‐obese group. Physical activity is negatively associated with arterial stiffness in postmenopausal women with normal weight. This association was not observed in overweight or obese women.
Keywords: arterial stiffness, menopause, obesity, physical exercise
1. INTRODUCTION
Cardiovascular disease (CVD) represents the leading cause of morbidity and mortality in the Western World. 1 The increasing prevalence of CVD and the related mortality are affected mainly by the aging of the population, which is strongly associated with impaired arterial hemodynamics, vascular aging, and inactivity. 1 , 2 Indeed, arterial stiffening and endothelial dysfunction, through degradation of elastin fibers, increased vascular oxidative stress and chronic low‐grade inflammation, are biological events that take place along with aging per se. 3 , 4 Moreover, obesity epidemics that is even more pronounced in older populations contribute in the development of various CVD risk factors, such as type 2 diabetes mellitus (T2DM), dyslipidemia, and hypertension that further increase the global burden of the CVD disease. 2 , 5
Menopause is characterized by abrupt and significant reduction in circulating estrogens, a phenomenon that is thought to interact with other cellular aging processes and to influence vascular dysfunction via mechanisms that involve oxidative stress and inflammation. 4 , 6 , 7 Effective population‐wide prevention is needed to prevent the anticipated upward trend of CVD. 8
Regular physical activity is the most widely adopted strategy for reducing CVD risk with aging, more likely due to its vascular health‐enhancing influence. 4 , 9 Evidence from recent meta‐analysis suggests that aerobic exercise is the most effective type of physical activity to improve arterial stiffness and to reduce blood pressure. 10 , 11 This type of exercise also enhances endothelial function by reducing oxidative stress in men, but not consistently in postmenopausal women. 4 Evidence on the effect of aerobic exercise interventions in postmenopausal women is based on studies with very small samples sizes with differences in the participants and outcomes studied. 4 , 12 , 13 , 14
Many older women have a difficulty in adhering to aerobic training programs and often quit exercising in groups due to perceived or actual barriers, such as musculoskeletal discomfort and increased levels of heat load and unpleasant feeling. 15 Alternative aerobic training modalities, such as swimming, have also been recently studied with promising results reductions in arterial stiffness, blood pressure, strength, and aerobic capacity in postmenopausal women. 16 However, data are still limited on cardiovascular adaptations after physical activity in women of post‐reproductive status, while there are gaps in the literature regarding other factors contributing to inter‐individual variability in these adaptations. Furthermore, more realistic exercise approaches for these women in daily routine, such as walking and other mild types of physical activity, need to be further studied. 4 , 16
The aim of this study was to investigate the association of low‐intensity, moderate‐intensity and vigorous‐intensity physical activity with cardiometabolic parameters, carotid intima‐media thickness, and arterial stiffness in 625 postmenopausal women with mean age 57.7 ± 7.6 years.
2. METHODS
2.1. Study design and population
This cross‐sectional study recruited healthy postmenopausal women who were reviewed in the Menopause Clinic of Aretaieion Hospital, 2nd Department of Obstetrics and Gynecology, National and Kapodistrian University of Athens. This Clinic is active since 1998, offering advice to all postmenopausal women seeking help on managing menopause‐related symptoms as well as primary prevention practices. All women who visited the clinic for the first time between September 2015 and July 2019 were invited to participate in this study.
Briefly, all women were subjected, before their recruitment, to a routine evaluation program which included breast mammography, gynecological examination, and Papanicolaou smear, as well as evaluation of renal/thyroid/liver function. Exclusion criteria were as follows: (a) familial hypercholesterolemia, (b) thromboembolism as well as peripheral artery disease, (c) clinically overt or treated coronary artery disease or cardiovascular disease, (d) premature ovarian failure, (e) inflammatory disease, and (f) gynecological malignancy. Absence of menses for a period of at least 12 consecutive months together with levels of estradiol <50 pg/mL and follicle‐stimulating hormone >25 mIU/mL was defined as post‐menopause. Women with adherence or retention concerns (eg, alcoholism) were not included in the study. After application of the exclusion criteria, a total of 625 healthy women were selected to participate in this study. All participants signed an informed consent for participation in the study. Institutional review board approval was obtained by the Ethics Committee of the “Aretaieion” Hospital.
2.2. Protocol study procedures
Data on demographic, anthropometric parameters as well as gynecological and personal history of participating women have been collected by the same trained staff, according to standardized procedures. All participants completed a questionnaire on lifestyle, physical activity, medical, and family history as well as smoking habits. The same standard questionnaire used routinely in our clinic was now enhanced with a second questionnaire, requesting information on physical activity. Every participant was asked to provide details on average amount of time per week spent in different groups of activity, such as walking (low‐intensity), moderate‐intensity, and vigorous‐intensity.
According to the short version of the International Physical Activity Questionnaire (IPAQ), the energy expenditure was estimated in metabolic equivalent of energy (MET) hours per week, as follows 17 :
Walking MET minutes per week were estimated as: Walking METs = 3.3 × (walking minutes) × (walking days in leisure)
Moderate MET minutes per week were estimated as: Moderate METs = 4.0 × (moderate‐intensity activity minutes) x (moderate‐intensity days in leisure)
Vigorous MET minutes per week leisure were estimated as: Vigorous METs = 8.0 × (vigorous‐intensity activity minutes) × (vigorous‐intensity days in leisure)
Total Leisure time MET minutes per week was estimated as: Total METs = (walking METs) + (moderate METs) + (vigorous METs)
Furthermore, the intensity of physical activity was classified into three levels, according to the following criteria:
Category 1 (low‐intensity physical activity). Participants meeting all three of the following criteria:
<3 days of vigorous‐intensity activity of <20 minutes/ day
<5 days of moderate activity or walking for <30 minutes/ day
<5 days of any combination of walking, moderate‐ or vigorous‐intensity activity achieving a maximum total of <600 MET minutes per week
Category 2 (moderate‐intensity physical activity): Participants meeting at least one of the following criteria:
≥3 days of vigorous‐intensity activity of ≥20 minutes/d
≥5 days of moderate activity and/or walking for ≥30 minutes/d
≥5 days of any combination of walking, moderate‐ or vigorous‐intensity activity achieving a minimum total of at least 600 MET minutes per week
Category 3 (vigorous‐intensity physical activity): Participants meeting at least one of the following criteria:
≥3 days of vigorous‐intensity activity achieving a minimum total of at least 1500 MET minutes per week
≥7 days of combined activity, consisting of walking, moderate‐ or vigorous‐intensity activities, achieving a minimum total of at least 3000 MET minutes per week
Following the completion of the questionnaires, height and weight were measured using an electronic scale with upright stadiometer, while participating women were dressed in light clothing. Fasting venous blood tests were obtained for the estimation of biochemical and hormonal parameters, and we estimated the body mass index (BMI) according to the equation BMI = weight (kg)/ height (m)2. Subsequently, we measured systolic (SBP) and diastolic blood pressure (DBP) on three different occasions, with time interval of 1 min between each measurement, while the participant was comfortable in the seated position. Moreover, fasting venous blood tests were obtained for the estimation of biochemical and hormonal parameters. The samples were centrifuged and stored appropriately in deep freezing −80 C, by the same trained staff. Finally, the vascular parameters have taken place immediately thereafter in the same morning.
2.3. Biochemical and hormonal assays
Total cholesterol in serum was measured by enzymatic assay (Abbot) with a total coefficient of variation (CV) ≤3% and sensitivity 5.0 mg/dL. Triglycerides were assessed using the enzymatic glycerol phosphate oxidase methodology (Abbott) with total CV ≤5% and limit of detection (LOD) 5.0 mg/dL. High‐density lipoprotein levels (HDL) were measured by chromogenic accelerator selective detergent methodology (ultra HDL assay, Abbott). The imprecision of the above assay (total CV) was ≤4% and the sensitivity 2.5 mg/dL. Low‐density lipoprotein (LDL) cholesterol was measured by elimination methodology (MULTIGENT direct LDL, Abbott). The sensitivity of the assay was ≤10 mg/dL and the total CV < 4%. Serum glucose was measured by the hexokinase/G‐6‐PDH methodology (Abbott). The total CV was ≤5% and the sensitivity 2.5 mg/dL. All the aforementioned assays were performed on the Architect c 8000 system (Abbott Diagnostics).
Levels of serum insulin, follicle‐stimulating hormone (FSH), and estradiol were measured as previously described. 18 Homeostasis model assessment of insulin resistance (HOMA‐IR) was calculated as follows: fasting insulin (μU/mL) × fasting glucose (mmol/L)/22.5.
2.3.1. Vascular measurements
Intima‐media thickness
IMT was assessed by B‐mode ultrasound imaging (14.0‐MHz multifrequency linear array probe, Vivid 7 Pro, GE) and measured in three paired segments of both right and left common carotid artery (CCA), carotid bulb (CB), and internal carotid artery (ICA) from a fixed lateral transducer angle, as previously described. 19 Three measurements of the maximal IMT in the far wall were averaged in each segment, and the average IMT was calculated for both carotid arteries. The right and the left carotid IMT average value was defined as combined IMT. Apart from well‐defined atherosclerotic plaques, any focal thickening greater than 1.5mm was defined as atherosclerotic plaque. All scans were digitally recorded for offline analysis (mean carotid IMT coefficient variation‐CV 10.6%) both performed by a single operator blinded to the cardiovascular risk profile of the subjects.
Pulse wave velocity
Pulse wave velocity was calculated using measurements of pulse transit time and the distance traveled between two recording sites with a validated non‐invasive device (Complior, Artech Medical) that allows online pulse wave recording and automatic calculation of PWV (PWV equals distance [meters] divided by transit time [seconds]). The PWV was measured between the common carotid artery and common femoral artery (CV 2.4% for two repeated measurements) as previously described. 18 , 19
2.4. Statistical analysis
The analysis has taken place using the Statistical Package of Social Science version 25.0 (SPSS version 25.0). Quantitative variables were expressed as mean ± standard deviation (SD). Normality was tested using the Shapiro‐Wilk test. Differences between quantitative variables were evaluated using t test for independent samples. Differences between qualitative parameters were evaluated using Chi‐square analysis (X2). Pearson’s r correlation coefficients were calculated to assess the association between total METs and cardiovascular risk factors as well as anthropometric/demographic parameters and indices of vascular function and structure. We fitted models of linear or logistic multivariable regression analysis, as indicated, aiming to explore the association between total METs or METs corresponding to physical activity of any intensity (ie, low vs moderate vs vigorous, as continuous variables; low vs moderate‐high intensity, as dichotomic variable) and indices of vascular structure (segmental carotid IMT) as well as PWV or atheromatous plaques presence. The models were adjusted for traditional cardiovascular risk factors. Subsequently, the sample was subdivided into lean women (BMI < 25 kg/m2) and overweight‐obese women (BMI ≥ 25 kg/m2), aiming to evaluate the potential impact of physical activity into indices of vascular function and structure. Statistical significance was set at the level of P < .05.
3. RESULTS
Table 1 presents the results of the descriptive analysis of anthropometric, biochemical, and hormonal parameters for the 625 women of our study, mean values of segmental carotid IMT and pulse wave velocity values.
Table 1.
Descriptive analysis of the biochemical, hormonal, and anthropometric parameters as well as indices of subclinical atherosclerosis for the 625 women of our study
| Mean ± SD or Frequency (%) | |
|---|---|
| Age (years) | 57.7 ± 7.6 |
| YSM (years) | 8.8 ± 7.0 |
| BMI (kg/m2) | 27.8 ± 5.1 |
| Waist (cm) | 90.5 ± 12.6 |
| Hip (cm) | 107.6 ± 10.9 |
| SBP (mm Hg) | 116.1 ± 23.2 |
| DBP (mm Hg) | 69.9 ± 13.7 |
| Glucose (mg/dL) | 93.6 ± 14.2 |
| Insulin (μIU/L) | 9.3 ± 8.3 |
| HOMA‐IR | 1.9 ± 1.2 |
| Cholesterol (mg/dL) | 212.6 ± 35.6 |
| Triglycerides (mg/dL) | 95.4 ± 41.9 |
| HDL‐cholesterol (mg/dL) | 64.7 ± 15.1 |
| LDL‐cholesterol (mg/dL) | 132.9 ± 32.8 |
| CCA‐IMT (mm) | 13.6 ± 1.3 |
| CB‐IMT (mm) | 12.9 ± 1.9 |
| ICA‐IMT (mm) | 12.3 ± 1.9 |
| Combined IMT (mm) | 12.8 ± 10.2 |
| PWV (m/s) | 8.9 ± 1.6 |
| Plaques CCA | 45.8% |
Abbreviations: BMI, body mass index; CB‐IMT, carotid bulb intima‐media thickness; CCA‐IMT, common carotid artery intima‐media thickness; DBP, diastolic blood pressure; HDL‐cholesterol, high‐density lipoprotein cholesterol; HOMA‐IR, homeostasis model assessment of insulin resistance; ICA‐IMT, internal carotid artery intima‐media thickness; LDL‐cholesterol, low‐density lipoprotein cholesterol; PWV, pulse wave velocity; SBP, systolic blood pressure; YSM, years since menopause.
Table 2 presents the results of the correlation analysis between MET categories and presence of cardiovascular risk factors using Pearson’s correlation coefficient. We observed that low physical activity correlated negatively with BMI (r‐coefficient = −0.084, P = .040). Moderate physical activity correlated with BMI (r‐coefficient = −0.104, P = .016); waist circumference (r‐coefficient = −0.104, P = .016), HDL‐cholesterol (r‐coefficient = 0.123, P = .006). Vigorous physical activity was inversely correlated with age (r‐coefficient = −0.089, P = .029). Total METs correlated inversely with BMI (r‐coefficient = −0.124, P = .002); waist circumference (r‐coefficient = −0.087, P = .044); hip circumference (r‐coefficient = −0.096, p = .026); HDL‐cholesterol (r‐coefficient = 0.097, P = 0.029); LDL‐cholesterol (r‐coefficient = −0.103, P = .021).
Table 2.
Correlation matrix between METs categories and presence of cardiovascular risk factors, using Pearson’s coefficient
| METs | Low | Moderate | Vigorous | Total |
|---|---|---|---|---|
| Age (y) | 0.039 | −0.051 | −0.089* | −0.053 |
| YSM (y) | 0.022 | −0.033 | −0.031 | −0.030 |
| BMI (kg/m2) | −0.084* | −0.115** | −0.020 | −0.124** |
| Waist (cm) | −0.051 | −0.104* | 0.001 | −0.087* |
| Hip (cm) | −0.063 | −0.083 | −0.026 | −0.096* |
| SBP (mm Hg) | −0.010 | −0.005 | 0.049 | 0.014 |
| DBP (mm Hg) | 0.040 | −0.007 | 0.002 | 0.018 |
| Glucose (mg/dL) | −0.060 | −0.067 | −0.004 | −0.071 |
| Insulin (μIU/L) | −0.073 | −0.118 | −0.014 | −0.105 |
| HOMA‐IR | −0.122 | −0.138 | 0.005 | −0.131 |
| Cholesterol (mg/dL) | −0.047 | 0.011 | −0.052 | −0.038 |
| Triglycerides (mg/dL) | −0.059 | −0.015 | 0.028 | −0.019 |
| HDL‐cholesterol (mg/dL) | −0.048 | 0.123** | −0.014 | 0.097* |
| LDL‐cholesterol (mg/dL) | −0.074 | −0.062 | −0.061 | −0.103* |
| CCA‐IMT (mm) | 0.131 | 0.021 | −0.067 | 0.040 |
| CB‐IMT (mm) | −0.270 | 0.109 | 0.327 | −0.157 |
| ICA‐IMT (mm) | −0.046 | 0.012 | −0.004 | −0.024 |
| Combined IMT (mm) | −0.025 | −0.035 | −0.178 | −0.039 |
| PWV (m/s) | 0.085 | −0.082 | −0.083 | −0.045 |
Statistical significance is indicated using bold, (*) corresponds to P‐value < .05; (**) corresponds to P‐value < .01.
Abbreviations: BMI, body mass index; CB‐IMT = carotid bulb intima‐media thickness; CCA‐IMT, common carotid artery intima‐media thickness; DBP, diastolic blood pressure; HDL‐cholesterol, high‐density lipoprotein cholesterol; HOMA‐IR, homeostasis model assessment of insulin resistance; ICA‐IMT, internal carotid artery intima‐media thickness; LDL‐cholesterol, low‐density lipoprotein cholesterol; PWV = pulse wave velocity; SBP, systolic blood pressure; YSM, years since menopause.
Models of linear regression analysis were fitted including pulse wave velocity in the total sample as dependent variable and physical activity of any intensity as well as cardiovascular risk factors as independent variables (eg, age, menopausal age, smoking, LDL‐cholesterol, BMI, HOMA‐IR, systolic and diastolic blood pressure) (Table 3). Moderate physical activity was inversely associated with values of PWV (b‐coefficient = −0.126, P = .001), adjusting for age and smoking. On the other hand, neither vigorous physical activity nor walking was associated with PWV. Moreover, there was no evidence of a quantitative by METS association between either walking or moderate or vigorous physical activity and arterial stiffness, estimated by PWV values (P> .05, all cases).
Table 3.
Linear regression analysis including mean values of pulse wave velocity (PWV) as dependent variable, while the evidence of physical activity as well as cardiovascular risk factors was added as independent variables (total sample: N = 625)
| PWV | Model R2 | b‐coefficient | 95% CI | P‐value |
|---|---|---|---|---|
| Evidence of walking activity | 12.0% | 0.026 | 0.011 to 0.383 | .484 |
| Age (years) | 0.263 | 0.158 to 0.483 | <.001 | |
| Smoking | −0.149 | −0.358 to 0.190 | <.001 | |
| LDL‐cholesterol (mg/dL) | 0.004 | −0.094 to 0.142 | .926 | |
| YSM (y) | −0.028 | −0159 to 0.023 | .599 | |
| BMI (kg/m2) | 0.104 | 0.047 to 0.241 | .009 | |
| HOMA‐IR | −0.002 | −0.172 to 0.039 | .967 | |
| SBP (mm Hg) | 0.071 | −0.052 to 0.214 | .223 | |
| DBP (mm Hg) | 0.001 | −0.037 to 0.241 | .986 | |
| Evidence of moderate physical activity | 11.4% | −0.126 | −0.427 to −0.098 | .001 |
| Age (y) | 0.255 | 0.024 to 0.512 | <.001 | |
| Smoking | −0.153 | −0.339 to −0.124 | <.001 | |
| LDL‐cholesterol (mg/dL) | 0.009 | 0.001 to 0.245 | .822 | |
| YSM (y) | −0.026 | −0.134 to 0.123 | .629 | |
| BMI (kg/m2) | −0.037 | −0.156 to −0.012 | .336 | |
| HOMA‐IR | 0.016 | 0.001 to 0.321 | .673 | |
| SBP (mm Hg) | 0.087 | 0.003 to 0.421 | .132 | |
| DBP (mm Hg) | 0.005 | −0.184 to 0.093 | .087 | |
| Evidence of vigorous physical activity | 12.1% | −0.044 | −0.184 to 0.211 | .250 |
| Age (y) | 0.260 | 0.037 to 0.423 | <.001 | |
| Smoking | −0.150 | −0.431 to −0.052 | <.001 | |
| LDL‐cholesterol (mg/dL) | 0.001 | −0.034 to 0.253 | .992 | |
| YSM (y) | −0.029 | −0.637 to 0.321 | .587 | |
| BMI (kg/m2) | 0.100 | −0.119 to 0.385 | .011 | |
| HOMA‐IR | −0.002 | −0.148 to 0.432 | .959 | |
| SBP (mm Hg) | 0.076 | −0.462 to 0.124 | .193 | |
| DBP (mm Hg) | −0.003 | −0.148 to 0.421 | .953 |
Bold indicates statistical significance which was set at the level of P‐value < .05
Abbreviations: BMI, body mass index; DBP, diastolic blood pressure; HOMA‐IR = homeostasis model assessment of insulin resistance; LDL‐cholesterol, low‐density lipoprotein cholesterol; PWV, pulse wave velocity; SBP, systolic blood pressure; YSM, years since menopause.
Aiming to further explore the association of METs with arterial stiffness and related cardiometabolic risk factors, we performed subgroup analyses, dividing our sample into normal‐weight and overweight‐obese women. Comparison of cardiovascular risk factors between these two groups, according to the intensity of physical activity, is presented in Supplemental Table S1. Overweight‐obese women had significantly higher values of PWV but similar levels of segmental carotid IMT (PWV, overweight‐obese vs normal weight: 9.1 ± 1.5 m/s vs 8.4 ± 1.5 m/s, P < .001) and higher rates of CCA plaques (overweight‐obese vs normal weight: 54.9% vs 30.6%, P < .001, Chi‐square test). Mean values of PWV decreased linearly with increasing intensity of physical activity (classes of physical activity: sedentary vs walking vs moderate vs vigorous activity: 9.07 ± 1.22 m/s vs 9.12 ± 1.72 m/s vs 8.47 ± 1.31 m/s vs 7.94 ± 0.40 m/s, ANOVA P for linear trend .003, Figure 1).
Figure 1.
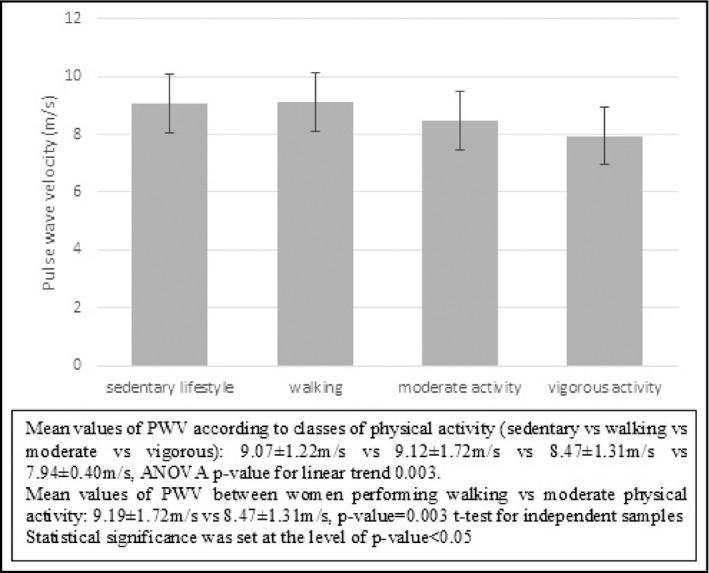
Mean values of pulse wave velocity according to category of physical exercise for women of the total sample
The same models of linear regression analysis as in Table 3 were fitted separately for normal‐weight and overweight‐obese women, (Table 4). In normal‐weight postmenopausal women, PWV values were negatively associated with the total number of METs and positively with SBP values (total number of METs: b‐coefficient = −0.261, P = .002). Similarly, PWV values were negatively associated with the number of moderate METs and positively with SBP (number of moderate METs: b‐coefficient = −0.192, P = .025). The number of walking METs showed only a borderline association with arterial stiffness values, while the number of vigorous METs did not predict arterial stiffness, in women with normal weight. On the other hand, no significant associations were observed between the intensity of physical exercise and arterial stiffness in the overweight‐obese group (Supplementary Table S2).
Table 4.
Linear regression analysis including mean values of pulse wave velocity as dependent variable, for the normal‐weight subsample of our participants (N = 194)
| PWV | Model R2 | b‐coefficient | 95% CI | P‐value |
|---|---|---|---|---|
| Total Mets | 38.9% | −0.261 | −0.419 to 0.002 | .002 |
| Age (y) | 0.497 | 0.237 to 0.527 | <.001 | |
| YSM (y) | −0.030 | −0.073 to 0.345 | .800 | |
| BMI (kg/m2) | −0.066 | −0.189 to −0.021 | .501 | |
| SBP (mm Hg) | 0.337 | 0.001 to 0.643 | .001 | |
| DBP (mm Hg) | −0.006 | −0.351 to 0.036 | .958 | |
| Smoking | −0.124 | −0.249 to −0.020 | .161 | |
| HOMA‐IR | 0.017 | −0.028 to 0.248 | .798 | |
| LDL‐cholesterol (mg/dL) | 0.074 | 0.016 to 0.378 | .374 | |
| Walking Mets | 33.8% | −0.146 | −0.384 to −0.034 | .093 |
| Age (y) | 0.475 | 0.028 to 0.689 | <.001 | |
| YSM (y) | −0.030 | −0.118 to 0.027 | .820 | |
| BMI (kg/m2) | 0.081 | 0.037 to 0.189 | .355 | |
| SBP (mm Hg) | 0.334 | 0.203 to 0.546 | <.001 | |
| DBP (mm Hg) | −0.038 | −0.267 to −0.005 | .740 | |
| Smoking | −0.168 | −0.299 to −0.065 | .063 | |
| HOMA‐IR | 0.019 | −0.047 to 0.189 | .781 | |
| LDL‐cholesterol (mg/dL) | 0.077 | 0.024 to 0.234 | .373 | |
| Moderate Mets | 35.8% | −0.192 | −0.501 to 0.124 | .025 |
| Age (years) | 0.471 | 0.351 to 0.578 | <.001 | |
| YSM (y) | −0.023 | −0.289 to −0.002 | .852 | |
| BMI (kg/m2) | 0.050 | 0.028 to 0.239 | .560 | |
| SBP (mm Hg) | 0.334 | 0.189 to 0.523 | <.001 | |
| DBP (mm Hg) | −0.033 | −0.198 to 0.038 | .772 | |
| Smoking | −0.152 | −0.351 to −0.099 | .088 | |
| HOMA‐IR | 0.015 | 0.002 to 0.188 | .826 | |
| LDL‐cholesterol (mg/dL) | 0.065 | 0.009 to 0.147 | .450 | |
| Vigorous Mets | 32.7% | −0.127 | −0.371 to −0.037 | .147 |
| Age (y) | 0.467 | 0.286 to 0.720 | <.001 | |
| YSM (y) | −0.093 | −0.236 to −0.034 | .446 | |
| BMI (kg/m2) | 0.080 | 0.037 to 0.178 | .360 | |
| SBP (mm Hg) | 0.325 | 0.218 to 0.538 | <.001 | |
| DBP (mm Hg) | −0.026 | −0.237 to −0.009 | .822 | |
| Smoking | −0.163 | −0.394 to −0.026 | .073 | |
| HOMA‐IR | 0.013 | −0.036 to 0.056 | .852 | |
| LDL‐cholesterol (mg/dL) | 0.091 | 0.035 to 0.178 | .293 | |
| Low vs moderate/vigorous exercise a | 60.3% | −0.461 | −1.058 to −0.051 | .001 |
| Age (years) | −0.352 | −0.890 to 0.217 | .216 | |
| YSM (years) | 0.542 | 0.267 to 0.714 | <.001 | |
| BMI (kg/m2) | 0.144 | 0.108 to 0.383 | .277 | |
| SBP (mm Hg) | 0.509 | 0.184 to 0.766 | .024 | |
| DBP (mm Hg) | 0.034 | −0.425 to 0.008 | .851 | |
| Smoking | −0.120 | −0.321 to −0.078 | .318 | |
| HOMA‐IR | −0.150 | −0.274 to 0.099 | .338 | |
| LDL‐cholesterol (mg/dL) | −0.045 | −0.134 to 0.327 | .739 |
The intensity/type of physical exercise was added one‐by‐one as independent variables. Models were adjusted for the presence of cardiovascular risk factors. Bold indicates statistical analysis which was set at the level of P‐value < .05.
Abbreviations: BMI, body mass index; DBP, diastolic blood pressure; HOMA‐IR, homeostasis model assessment of insulin resistance; LDL‐cholesterol, low‐density lipoprotein cholesterol; PWV, pulse wave velocity; SBP, systolic blood pressure; YSM, years since menopause.
Reference category: low physical exercise.
Linear regression analysis models were fitted aiming to evaluate the association between physical activity and segmental carotid IMT, adjusting for traditional cardiovascular risk factors. However, physical activity was not associated with carotid IMT in any segment (Supplementary Table S3). Finally, logistic regression analysis models were fitted to evaluate the association between physical activity and presence of atherosclerotic plaques in the common carotid artery, adjusting for traditional cardiovascular risk factors. Neither the type nor the intensity of physical activity was associated with the presence of CCA plaques, even after adjustment for cardiovascular risk factors (Supplementary Table S4).
4. DISCUSSION
We found that mean values of PWV decreased linearly with increasing intensity of physical activity. Furthermore, physical activity was negatively associated with BMI, LDL, and triglycerides levels, as well as insulin resistance. The favorable association of exercise with arterial stiffness was mainly evident only in normal‐weight postmenopausal women.
According to earlier studies, higher values of PWV were observed in sedentary post‐ compared to premenopausal, whereas similar PWV values were observed comparing endurance exercise‐trained post‐ vs premenopausal women. 20 On the other hand, carotid artery stiffness increases with aging in both sedentary and aerobic exercise‐trained healthy men and women. However, the magnitude of these changes with age in exercising men and women is smaller (around 50%) of that observed with age in sedentary adults. 14 , 21 , 22 , 23 It is well recognized that exercise training is an effective non‐pharmacological treatment for the improvement of cardiovascular health in both young and older individuals. 4 , 9 Evidence from a recent meta‐analysis suggests that aerobic training is the most effective type of exercise modality to improve blood pressure and arterial stiffness. 10 , 11 There are several significant gaps in our understanding of gender differences in the beneficial effects of regular physical activity on vascular aging, as well as the potential modulatory influence of menopause on arterial elasticity. 4 The limited information available on vascular adaptations to exercise interventions in postmenopausal women is based so far on studies with very small samples sizes and with differences in the participants and outcomes studied. 4 , 12 , 13 , 14
The mechanisms by which physical activity counteracts arterial stiffening with aging are not well known. This is because of the difficulty in accessing the aorta and carotid arteries and the influence of other confounding factors, such as obesity, insulin resistance, BP, and vascular tone‐modulating cardiovascular reflexes. 4 , 6 However, there is some evidence that exercise affects vascular status by modulation of oxidative stress and low‐grade inflammation. Physical activity is associated with lower plasma oxidized LDL levels and decreased expression of genes related to oxidant production in peripheral blood mononuclear cells. 12 , 24 , 25 , 26 Furthermore, several investigations have reported lower concentrations of C‐reactive protein (CRP) and inflammatory cytokines or higher concentrations of anti‐inflammatory cytokines in middle‐aged and older men and women who regularly perform aerobic exercise. 12 , 13 , 27 , 28
Obesity may represent another confounding factor that could affect the negative association of physical activity with vascular aging. Our study shows that physical activity associated with arterial stiffness only in normal‐weight postmenopausal women. During the menopausal transition, various phenotypical and metabolic changes occur including weight gain, central obesity, and an increase in waist circumference. 29 These phenomena are not only the result of chronological aging, but also of ovarian aging and the reduction of endogenous estrogen production. 7 , 29 A previous study performed by our group showed that 21% of women with normal blood pressure at baseline progressed to hypertension, within a median interval of 3.5 years after the menopausal transition. Central obesity and insulin resistance were the most pronounced risk factors, independently of the baseline cardiovascular risk profile. 30 Central adipose tissue secretes adipokines and cytokines that cause a post‐binding defect in insulin signaling due to increased serine and decreased tyrosine phosphorylation of insulin receptor, which leads to insulin resistance. 5 In turn, insulin resistance and hyperinsulinemia have been associated with vascular dysfunction and hypertension in a number of studies. 31 , 32 Interestingly, physical activity was negatively associated with insulin resistance, expressed by HOMA‐IR, in this study. Furthermore, overweight‐obese women presented a more adverse metabolic profile in comparison with lean women. Overweight‐obese postmenopausal women tend to have greater accumulation of one or more metabolic syndrome components, the presence of which is negatively associated with arterial stiffness even in non‐diabetic postmenopausal women as we have previously described. 33
The strengths of this study include the homogeneity of our cohort and the strict criteria of inclusion; only healthy, postmenopausal women were included, with normal renal function and without T2DM. Furthermore, the definition of physical activity was clear and various intensity categories were evaluated. Limitations of the study are the cross‐sectional design and the fact that women were retrieved from the Menopause Clinic of our Department. The latter implies that the results described may not reflect the general population of postmenopausal women.
In conclusion, this study provided evidence that physical activity is associated with a better cardiometabolic profile and lower arterial stiffness in postmenopausal women. This association was mainly evident in lean postmenopausal women. Larger studies are needed to corroborate our findings.
CONFLICT OF INTEREST
The Authors declare that there is no conflict of interest.
AUTHOR CONTRIBUTIONS
Kimon Stamatelopoulos involved in overall supervision and coordination of the study, and study design. Nikolaos Tsoltos involved in recruitment of participants and manuscript drafting. Eleni Armeni performed statistical analysis. Stavroula A. Paschou involved in manuscript drafting and literature review. Areti Augoulea involved in recruitment of participants and literature review. Georgios Kaparos and Demetrios Rizos involved in hormonal and biochemical assessment of participants. Iliana Karagouni, Michail Apostolakis, and Evangelos Makrakis involved in recruitment of participants. Dimitris Delialis and Sophia Ioannou performed in vascular measurements. Irene Lambrinoudaki involved in overall supervision and coordination of study, proof‐reading of manuscript, and supervision of statistical analysis.
Supporting information
Table S1
Table S2
Table S3
Table S4
Stamatelopoulos K, Tsoltos N, Armeni E, et al. Physical activity is associated with lower arterial stiffness in normal‐weight postmenopausal women. J Clin Hypertens. 2020;22:1682–1690. 10.1111/jch.13954
REFERENCES
- 1. World Health Organization_Cardiovascular Disease. https://www.who.int/health‐topics/cardiovascular‐diseases [last accessed on 2 January 2020].
- 2. Benjamin EJ, Virani SS, Callaway CW, et al. Heart Disease and Stroke Statistics—2018 Update: A report from the American Heart Association. Circulation. 2018;137:e67‐e492. [DOI] [PubMed] [Google Scholar]
- 3. Hildreth KL, Kohrt WM, Moreau KL. Oxidative stress contributes to large elastic arterial stiffening across the stages of the menopausal transition. Menopause. 2014;21:624‐32. [DOI] [PMC free article] [PubMed] [Google Scholar]
- 4. Seals DR, Nagy EE, Moreau KL. Aerobic exercise training and vascular function with ageing in healthy men and women. J Physiol. 2019;597:4901‐14. [DOI] [PMC free article] [PubMed] [Google Scholar]
- 5. Paschou SA, Anagnostis P, Goulis DG. Weight loss for the prevention and treatment of type 2 diabetes. Maturitas. 2018;108:A1‐A2. [DOI] [PubMed] [Google Scholar]
- 6. Seals DR, Brunt VE, Rossman MJ. Keynote lecture: Strategies for optimal cardiovascular aging. Am J Physiol Heart Circ Physiol. 2018;315:H183‐H188. [DOI] [PMC free article] [PubMed] [Google Scholar]
- 7. Paschou SA, Marina LV, Spartalis E, et al. Therapeutic strategies for type 2 diabetes mellitus in women after menopause. Maturitas. 2019;126:69‐72. [DOI] [PubMed] [Google Scholar]
- 8. Heidenreich PA, Trogdon JG, Khavjou OA, et al. Forecasting the future of cardiovascular disease in the United States. Circulation. 2011;123:933‐44. [DOI] [PubMed] [Google Scholar]
- 9. Che L, Li D. The effects of exercise on cardiovascular biomarkers: new insights recent data, and applications. Adv Exp Med Biol. 2017;999:43‐53. [DOI] [PubMed] [Google Scholar]
- 10. Carpio‐Rivera E, Moncada‐Jiménez J, Salazar‐Rojas W, Solera‐Herrera A. Acute effects of exercise on blood pressure: a meta‐analytic investigation. Arq Bras Cardiol. 2016;106:422‐33. [DOI] [PMC free article] [PubMed] [Google Scholar]
- 11. Ashor AW, Lara J, Siervo M, Celis‐Morales C, Mathers JC. Effects of exercise modalities on arterial stiffness and wave reflection: a systematic review and meta‐analysis of randomized controlled trials. PLoS ONE. 2014;9:e110034. [DOI] [PMC free article] [PubMed] [Google Scholar]
- 12. Santos‐Parker JR, Strahler TR, Vorwald VM, Pierce GL, Seals DR. Habitual aerobic exercise does not protect against micro‐ or macrovascular endothelial dysfunction in healthy estrogen‐deficient postmenopausal women. J Appl Physiol. 2017;122:11‐9. [DOI] [PMC free article] [PubMed] [Google Scholar]
- 13. Pierce GL, Eskurza I, Walker AE, Fay TN, Seals DR. Sex‐specific effects of habitual aerobic exercise on brachial artery flow‐mediated dilation in middle‐aged and older adults. Clin Sci (Lond). 2011;120:13‐23. [DOI] [PMC free article] [PubMed] [Google Scholar]
- 14. Moreau KL, Donato AJ, Seals DR, DeSouza CA, Tanaka H. Regular exercise, hormone replacement therapy and the age‐related decline in carotid arterial compliance in healthy women. Cardiovasc Res. 2003;57:861‐8. [DOI] [PubMed] [Google Scholar]
- 15. O’Neill K, Reid G. Perceived barriers to physical activity by older adults. Can J Public Health. 2016;82:392‐6. [PubMed] [Google Scholar]
- 16. Wong A, Kwak YS, Scott SD, et al. The effects of swimming training on arterial function, muscular strength, and cardiorespiratorycapacity in postmenopausal women with stage 2 hypertension. Menopause. 2018;26:653‐8. [DOI] [PubMed] [Google Scholar]
- 17. Papathanasiou G, Papandreou M, Galanos A, et al. Smoking and physical activity interrelations in health science students. Is smoking associated with physical inactivity in young adults? Hellenic J Cardiol. 2012;53:17‐25. [PubMed] [Google Scholar]
- 18. Creatsa M, Armeni E, Stamatelopoulos K, et al. Circulating androgen levels are associated with subclinical atherosclerosis and arterial stiffness in healthy recently menopausal women. Metabolism. 2012;61:193‐201. [DOI] [PubMed] [Google Scholar]
- 19. Stamatelopoulos K, Sibbing D, Rallidis LS, et al. Amyloid‐beta (1‐40) and the risk of death from cardiovascular causes in patients with coronary heart disease. J Am Coll Cardiol. 2015;65(9):904‐16. [DOI] [PubMed] [Google Scholar]
- 20. Tanaka H, DeSouza CA, Seals DR. Absence of age‐related increase in central arterial stiffness in physically active women. Arterioscler Thromb Vasc Biol. 1998;18:127‐32. [DOI] [PubMed] [Google Scholar]
- 21. Tanaka H, Dinenno FA, Monahan KD, Clevenger CM, DeSouza CA, Seals DR. Aging, habitual exercise, and dynamic arterial compliance. Circulation. 2000;102:1270‐5. [DOI] [PubMed] [Google Scholar]
- 22. Matsubara T, Miyaki A, Akazawa N, et al. Aerobic exercise training increases plasma Klotho levels and reduces arterial stiffness in postmenopausal women. Am J Physiol Heart Circ Physiol. 2014;306:H348‐H355. [DOI] [PubMed] [Google Scholar]
- 23. Tanahashi K, Akazawa N, Miyaki A, et al. Aerobic exercise training decreases plasma asymmetric dimethylarginine concentrations with increase in arterial compliance in postmenopausal women. Am J Hypertens. 2014;27:415‐21. [DOI] [PubMed] [Google Scholar]
- 24. Moreau KL, Gavin KM, Plum AE, Seals DR. Oxidative stress explains differences in large elastic artery compliance between sedentary and habitually exercising postmenopausal women. Menopause. 2006;13:951‐8. [DOI] [PubMed] [Google Scholar]
- 25. Gano LB, Donato AJ, Pierce GL, et al. Increased proinflammatory and oxidant gene expression in circulating mononuclear cells in older adults: amelioration by habitual exercise. Physiol Genomics. 2011;43:895‐902. [DOI] [PMC free article] [PubMed] [Google Scholar]
- 26. Pierce GL, Donato AJ, LaRocca TJ, Eskurza I, Silver AE, Seals DR. Habitually exercising older men do not demonstrate age‐associated vascular endothelial oxidative stress. Aging Cell. 2011;10:1032‐7. [DOI] [PMC free article] [PubMed] [Google Scholar]
- 27. Kasapis C, Thompson PD. The effects of physical activity on serum C‐reactive protein and inflammatory markers: a systematic review. J Am Coll Cardiol. 2005;45:1563‐9. [DOI] [PubMed] [Google Scholar]
- 28. Nicklas BJ, Hsu F‐C, Brinkley TJ, et al. Exercise training and plasma C‐reactive protein and interleukin‐6 in elderly people. J Am Geriatr Soc. 2008;56:2045‐52. [DOI] [PMC free article] [PubMed] [Google Scholar]
- 29. Paschou SA, Anagnostis P, Pavlou DI, Vryonidou A, Goulis DG, Lambrinoudaki I. Diabetes in Menopause: Risks and Management. Curr Vasc Pharmacol. 2019;17:556‐63. [DOI] [PubMed] [Google Scholar]
- 30. Stamatelopoulos K, Apostolakis M, Augoulea A, et al. Predictors of incident hypertension in healthy non‐diabetic postmenopausal women with normal renal function. Gynecol Endocrinol. 2019;35:1063‐6. [DOI] [PubMed] [Google Scholar]
- 31. Sung KC, Lim S, Rosenson RS. Hyperinsulinemia and homeostasis model assessment of insulin resistance as predictors of hypertension: a 5‐year follow‐up study of Korean sample. Am J Hypertens. 2011;24:1041‐5. [DOI] [PubMed] [Google Scholar]
- 32. Xun P, Wu Y, He Q, He K. Fasting insulin concentrations and incidence of hypertension, stroke, and coronary heart disease: a meta‐ analysis of prospective cohort studies. Am J Clin Nutr. 2013;98:1543‐54. [DOI] [PMC free article] [PubMed] [Google Scholar]
- 33. Lambrinoudaki I, Kazani A, Armeni E, et al. The metabolic syndrome is associated with carotid atherosclerosis and arterial stiffness in asymptomatic nondiabetic postmenopausal women. Gynecol Endocrinol. 2018;34:78‐82. [DOI] [PubMed] [Google Scholar]
Associated Data
This section collects any data citations, data availability statements, or supplementary materials included in this article.
Supplementary Materials
Table S1
Table S2
Table S3
Table S4