

Abstract
We aimed to evaluate the relation of the ankle–brachial index (ABI) with the prevalence of stroke and to examine any possible effect modifiers among hypertensive patients without atrial fibrillation. A total of 10 750 subjects with hypertension aged 27‐96 years were included in the current study. The outcome was a stroke. Odds ratios of stroke concerning ABI were calculated using multivariate logistic regression models. Among 10 750 hypertensive participants, 690 (6.42%) had a stroke. Multivariate logistic analyses showed that ABI was negatively correlated with the prevalence of stroke (per SD increment; adjusted OR, 0.88; 95% CI, 0.82‐0.94). Compared with participants in Q 1, the odds ratios (95% CI) for those in the Q2 (1.05 to 1.10), Q3 (1.10 to 1.15), and Q4 (≥1.15) were 0.71 (0.56, 0.90), 0.87 (0.70, 1.08), and 0.81 (0.65, 1.01), respectively. However, compared with higher ABI value, lower ABI value (<1.05) would significantly increase the odds of stroke (OR: 1.26, 95% CI [1.05‐1.50]), especially in the elderly over 65 years old. A generalized additive model and a smooth curve fitting showed that there existed an L‐shaped association between ABI and the prevalence of stroke. Our results suggest that an L‐shaped association between ABI and the prevalence of stroke was found in general hypertensive patients, with a turning point at about 1.05. Compared with higher ABI value, lower ABI value (<1.05) would significantly increase the prevalence of stroke (OR: 1.26, 95% CI [1.05‐1.50]), especially in the elderly over 65 years old.
Keywords: ankle–brachial index, hypertension, L‐shaped curve, stroke
1. INTRODUCTION
Stroke is a common cardiovascular and cerebrovascular disease with a high incidence rate, high mortality rate, and high disability rate. 1 Among all cardiovascular and cerebrovascular disease deaths, stroke ranks second and brings a substantial economic burden to the world. 2 According to a nationwide survey in China, stroke is the leading cause of death, and the incidence rate continues to rise. 3 Therefore, it is essential to identify the high‐risk population of a stroke at an early stage. As far as we know, hypertension and stroke are continuously and independently positively correlated. A prospective observational study showed that for every 20 mmHg increase in SBP or 10 mmHg increase in DBP, the risk of cerebrovascular disease doubles. 4 Asia Pacific Cohort Studies Collaboration (APCSC) showed that the relationship between blood pressure rise and stroke events in the Asian population is more robust than that in Australia and New Zealand. For every 10 mmHg increase in SBP, the stroke risk in the Asian population increases by 53%, while that in Australia and New Zealand increases by 24% and 21%, respectively. 5 At the same time, hypertension has many people in our country, about 245 million. 6 Thus, it was still necessary to find new detection methods to identify and prevent stroke in hypertensive patients.
Ankle–brachial index (ABI), the ratio of ankle arterial pressure and brachial arterial pressure, was obtained by measuring the posterior tibial artery's systolic pressures or anterior tibial artery and brachial artery at ankle. 7 ABI was a noninvasive method for diagnosis and detection of lower limb arterial diseases, and it was inexpensive and easy to use. 8 A study has shown that ABI could also be used as a screening method for recurrent stroke. 9 Moreover, some previous studies have shown that the decrease of ABI is related to the increase of stroke risk, 10 , 11 , 12 but other studies have not found such a relationship. 13 , 14 Simultaneously, the nonlinear relationship between ABI and stroke has not been discussed in the above studies.
Therefore, our current study aimed to evaluate the relation of ABI with the prevalence of stroke and any possible effect modifiers among hypertensive patients without atrial fibrillation (AF), considering that a small proportion of patients with AF can cause stroke, 15 through the use of data from the China H‐type Hypertension Registry Study to address this gap, as mentioned earlier in knowledge.
2. METHODS
2.1. Subject population and design
The present study was a subset of the China H‐type Hypertension Registry Study (Registration number: ChiCTR1800017274); the design and methods of the China H‐type Hypertension Registry Study have been reported elsewhere. 16 The study is a real‐world observational study, conducted from Wuyuan, Jiangxi province of China, beginning in July 2018. Eligible participants were men and women aged 18 years and older and were diagnosed with hypertensive. All participants gave written informed consent before data collection. The Ethics Committees of the Biomedical Institute of Anhui Medical University approved study protocols.
For this cross‐sectional analysis, we included 14 268 patients at their final visit. After excluding subjects without hypertension (n = 34), and those with missing information on ABI (n = 3328), as well as with participants with AF (n = 156), considering that a small proportion of patients with atrial fibrillation can cause stroke, 15 the final analysis included 10 750 subjects (Figure S1).
2.2. Data collection
According to a standard protocol, physical examination and medical history were conducted for all participants. Physical examination included weight, height, waist circumference (WC), and hip circumference (HC). BMI was calculated as the body weight in kilograms divided by the square of the height in meters (kg/m2). Hypertension was defined as seated resting systolic blood pressure (SBP) ≥ 140 mmHg or diastolic blood pressure (DBP) ≥90 mmHg at both the screening and recruitment visit, or who were on an antihypertensive medication. 17 Diabetes mellitus was defined as a self‐reported physician diagnosis of diabetes or FBG concentration of ≥7.0 mmol/L or the use of glucose‐lowering drugs.
2.3. Ankle–brachial index measurement
The ankle–brachial index (ABI) was automatically measured in the supine position after having rested for more than 10 minutes, using Omron Colin BP‐203RPE III device (Omron Health Care), 18 and ABI was calculated for each leg by dividing the SBP obtained at the ankle level in the respective leg by the SBP of the brachial artery. 8 We calculated the ABI of each leg, and the lower value of the ABI was used in the final analysis.
2.4. Laboratory tests
Blood samples, included total serum bilirubin (TBiL), plasma homocysteine (Hcy), fasting total cholesterol (TC), triglycerides (TG) and high‐density lipoprotein cholesterol (HDL‐C), fasting blood glucose (FBG), liver enzymes (aspartate aminotransferases [AST], alanine transaminase [ALT]), and serum creatinine, were collected from all participants. The Chronic Kidney Disease Epidemiology Collaboration (CKD‐EPI) equation 19 was performed to calculate the estimated glomerular filtration rate (eGFR). All laboratory measurements met a standardization and certification program. All of these parameters were measured using automatic clinical analyzers (Beckman Coulter) at the Biaojia Biotechnology Laboratory, Shenzhen, China.
2.5. Outcomes
The outcome was stroke (ischemic or hemorrhagic), excluding strokes caused by transient ischemic attacks (TIA), craniocerebral trauma, and intracranial tumors. 20 In this study, the medical history of stroke was a self‐reported stroke, which was mainly collected through a questionnaire. By asking each participant whether there was a stroke, if so, when the stroke occurred, the symptoms at that time, what kind of treatment, and whether there were relevant medical records included discharge summary and imaging data.
2.6. Covariates
These selected covariates are closely related to stroke. Categorical variables consisted of sex (males or females), smoking status (never, former, or current), drinking status (never, former, or current), and medication use (antihypertensive drugs [yes or no], glucose‐lowering drugs [yes or no], and lipid‐lowering drugs [yes or no]). Continuous variables included age, SBP, DBP, pulse, BMI, and laboratory results (FBG, TC, TG, low‐density lipoprotein cholesterol [LDL‐C], Hcy, AST, ALT, uric acid, TBiL, and eGFR).
2.7. Statistical analysis
Continuous variables were described using means with standard deviations (SDs) and median with interquartile range, and categorical variables were presented as count (percentage). Student's t‐test and chi‐square test were performed to compare groups for continuous variables and categorical variables. Participants were divided into four groups based on participants by quartiles of ABI levels. Multivariate logistic regression was used to assess the odds ratios (ORs) and 95% confidence intervals (CI) for stroke in ABI (as a continuous variable, quartiles, and a categorical variable), without and with adjustment for age, sex, SBP, DBP, pulse, smoking status, drinking status, BMI, FBG, TC, TG, LDL‐C, Hcy, AST, ALT, uric acid, TBiL, eGFR, antihypertensive drugs, glucose‐lowering drugs, and lipid‐lowering drugs. A generalized additive model and a smooth curve fitting (penalized spline method) were performed to characterize the shape of the relationship between ABI and stroke. If nonlinearity was detected, we first use a recursive algorithm to calculate the inflection points and then construct a two‐segment binary logistic model on both sides of the inflection points. Exploratory analyses were performed to ensure the robustness of the result. Possible modifications of the association between ABI (as a continuous variable) and the risk of stroke were assessed for variables including sex (males vs. females), age (<65 vs. ≥65 years), BMI (< 24 vs. ≥24 kg/m2), smoking status (never vs. former vs. current), and drinking status (never vs. former vs. current). A two‐tailed p less than .05 was considered to be statistically significant. All statistical analyses were performed using the Empower (R; www.empowerstats.com; X&Y Solutions, Inc, Boston, MA, USA) and the statistical package (R) (http://www.R-project.org, The R Foundation).
3. RESULTS
3.1. Study participants and baseline characteristics
The flow of the participants showed in Figure S1. The current study included 10 750 hypertensive participants with complete data on baseline ABI and stroke, who were no patients with AF.
As shown in Table 1, the average age of our study population is 63.81 ± 9.23 years, ranging from 27 to 96 years, 690 (6.42%) had a stroke, 532 (4.95%) had coronary heart disease (CHD), and 1938 (18.03%) had diabetes mellitus. Baseline characteristics of our study participants, stratified by quartiles of ABI, were comparable between the four groups. Participants with lowest levels of ABI (Q1) had lower value in age, uric acid, had lower rates of drinker and smoker, had higher rates of CHD and stroke, and higher value in SBP, DBP, pulse, TC, TG, HDL, LDL, and eGFR (all p < .01). There were no statistically significant between the four groups in terms of BMI, Hcy, FBG, diabetes mellitus, AST, ALT, TBiL, antihypertensive drugs, glucose‐lowering drugs, or lipid‐lowering drugs (all p > .05).
Table 1.
Baseline characteristics of study participants
| Characteristics | Total | ABI | p Value | |||
|---|---|---|---|---|---|---|
| Q1 (<1.05) | Q2 (1.05‐1.10) | Q3 (1.10‐1.15) | Q4 (≥1.15) | |||
| N | 10 750 | 2643 | 2452 | 2786 | 2869 | |
| Males, N | 5072 (47.18%) | 1076 (40.71%) | 1024 (41.76%) | 1351 (48.49%) | 1621 (56.50%) | <.001 |
| Age, year | 63.81 ± 9.23 | 64.46 ± 10.28 | 63.05 ± 9.24 | 63.14 ± 8.80 | 64.53 ± 8.48 | <.001 |
| BMI, kg/m2 | 23.60 ± 3.81 | 23.57 ± 3.89 | 23.62 ± 3.47 | 23.71 ± 4.32 | 23.49 ± 3.48 | .189 |
| Smoking status, N (%) | 2844 (26.46%) | 691 (26.15%) | 581 (23.69%) | 757 (27.17%) | 815 (28.41%) | <.001 |
| Drinking status, N (%) | 2458 (22.87%) | 496 (18.77%) | 513 (20.93%) | 681 (24.44%) | 768 (26.77%) | <.001 |
| SBP, mmHg | 148.50 ± 17.78 | 149.79 ± 19.36 | 148.51 ± 17.61 | 147.85 ± 17.07 | 147.91 ± 16.99 | <.001 |
| DBP, mmHg | 89.03 ± 10.73 | 88.59 ± 11.07 | 89.54 ± 10.41 | 89.49 ± 10.41 | 88.55 ± 10.97 | <.001 |
| Pulse, bpm | 76.19 ± 13.99 | 77.71 ± 15.45 | 76.35 ± 13.04 | 75.77 ± 13.47 | 75.08 ± 13.72 | <.001 |
| Laboratory data | ||||||
| Hcy, μmol/L | 18.00 ± 11.05 | 18.49 ± 11.89 | 17.77 ± 11.18 | 17.76 ± 10.93 | 17.97 ± 10.20 | .057 |
| FBG, mmol/L | 6.17 ± 1.60 | 6.19 ± 1.65 | 6.14 ± 1.54 | 6.15 ± 1.61 | 6.17 ± 1.60 | .663 |
| TC, mmol/L | 5.15 ± 1.11 | 5.23 ± 1.14 | 5.16 ± 1.10 | 5.15 ± 1.09 | 5.06 ± 1.12 | <.001 |
| TG, mmol/L | 1.78 ± 1.24 | 1.81 ± 1.18 | 1.84 ± 1.38 | 1.79 ± 1.26 | 1.69 ± 1.16 | <.001 |
| HDL‐C, mmol/L | 1.59 ± 0.44 | 1.61 ± 0.44 | 1.61 ± 0.43 | 1.60 ± 0.45 | 1.55 ± 0.42 | <.001 |
| LDL‐C, mmol/L | 2.99 ± 0.81 | 3.10 ± 0.84 | 3.02 ± 0.79 | 2.98 ± 0.80 | 2.89 ± 0.80 | <.001 |
| AST, U/L | 26.79 ± 16.78 | 26.81 ± 24.37 | 26.61 ± 14.52 | 26.88 ± 14.09 | 26.85 ± 11.66 | .941 |
| ALT, U/L | 20.47 ± 17.02 | 20.37 ± 23.31 | 20.35 ± 14.47 | 20.73 ± 15.74 | 20.39 ± 12.89 | .819 |
| TBiL, median (IQR), μmol/L | 13.30 (10.30‐17.40) | 13.30 (10.30‐17.40) | 13.10 (10.20‐17.40) | 13.40 (10.30‐17.30) | 13.40 (10.30‐17.70) | .370 |
| Uric acid, mmol/L | 414.93 ± 120.89 | 411.84 ± 121.05 | 404.88 ± 120.47 | 413.41 ± 120.82 | 427.84 ± 120.15 | <.001 |
| eGFR, ml/min/1.73 m2 | 88.77 ± 20.38 | 87.56 ± 22.78 | 90.65 ± 19.44 | 90.03 ± 18.88 | 87.04 ± 20.03 | <.001 |
| Comorbidities, N (%) | ||||||
| Stroke | 690 (6.42%) | 197 (7.45%) | 130 (5.30%) | 181 (6.50%) | 182 (6.34%) | .020 |
| CHD | 532 (4.95%) | 148 (5.60%) | 95 (3.87%) | 133 (4.77%) | 156 (5.44%) | .018 |
| Diabetes mellitus a | 1938 (18.03%) | 494 (18.69%) | 406 (16.56%) | 507 (18.20%) | 531 (18.51%) | .181 |
| PAD | 343 (3.19%) | 343 (12.98%) | 0 (0.00%) | 0 (0.00%) | 0 (0.00%) | <.001 |
| Medication use, N (%) | ||||||
| Antihypertensive drugs | 7044 (65.53%) | 1758 (66.54%) | 1619 (66.03%) | 1818 (65.25%) | 1849 (64.45%) | .385 |
| Glucose‐lowering drugs | 562 (5.23%) | 137 (5.18%) | 119 (4.85%) | 154 (5.53%) | 152 (5.30%) | .744 |
| Lipid‐lowering drugs | 370 (3.44%) | 100 (3.78%) | 79 (3.22%) | 100 (3.59%) | 91 (3.17%) | .552 |
Abbreviations: ABI, ankle‐brachial index; ALT, alanine aminotransferase; AST, aspartate aminotransferase; BMI, body mass index; CHD, coronary heart disease; DBP, diastolic blood pressure; eGFR, estimated glomerular filtration rate; FBG, fasting blood glucose; Hcy, homocysteine; HDL‐C, high‐density lipoprotein cholesterol; LDL‐C, low‐density lipoprotein cholesterol; SBP, systolic blood pressure; TBiL, total bilirubin; TC, total cholesterol; TG, Triglycerides.
Diabetes mellitus was defined as self‐reported physician diagnosis of diabetes or FBG concentration ≥ 7.0 mmol/L or use of glucose‐lowering drugs.
3.2. Associations between ABI and stroke
We constructed three models to evaluate the relationship between ABI and stroke. These three models were crude model (adjusted for none), model 1 (adjusted for age, sex, SBP, DBP, pulse, smoking status, drinking status), and model 2 (adjusted for all variables in model 1 plus adjusted for BMI, FBG, TC, TG, LDL‐C, Hcy, AST, ALT, uric acid, TBiL, eGFR, antihypertensive drugs, glucose‐lowering drugs, lipid‐lowering drugs), respectively. Continuous variables (ABI) were changed into quartiles and a categorical variable for sensitivity analysis. As illustrated in Table 2, ABI was negatively correlated with the prevalence of stroke (per SD increment; adjusted OR, 0.88; 95% CI, 0.82‐0.94). Compared with participants in Q1, a lower prevalence of stroke was found in participants in Q2 (OR, 0.71; 95% CI: 0.56‐0.90), Q3 (OR, 0.87; 95% CI: 0.70‐1.08), and Q4 (OR, 0.81; 95% CI: 0.65‐1.01), respectively. However, the decline of the latter two groups was not significant. To draw the real relationship between ABI and stroke, a generalized additive model and penalized spline method was performed, which showed that there is no nonlinear relationship between ABI and stroke; after adjusting age, sex, SBP, DBP, pulse, smoking status, drinking status, BMI, FBG, TC, TG, LDL‐C, Hcy, AST, ALT, uric acid, TBiL, eGFR, antihypertensive drugs, glucose‐lowering drugs, and lipid‐lowering drugs, as shown in Figure 1. Therefore, we combine Q2‐4 into a group, and a significantly lower odds of stroke (OR, 0.80; 95% CI: 0.66‐0.95) was found in participants in quartiles 2‐4(≥1.05) compared with participants in quartile 1 (<1.05).
Table 2.
The association between ABI and the prevalence of stroke
| ABI | N | Events (%) | Stroke OR (95% CI), p Value | ||
|---|---|---|---|---|---|
| Crude model | Model 1 | Model 2 | |||
| Per SD increment | 10 750 | 690 (6.42%) | 0.87 (0.81, 0.93) <.001 | 0.87 (0.81, 0.93) <.001 | 0.88 (0.82, 0.94) <.001 |
| Quartiles | |||||
| Q1 (<1.05) | 2643 | 197 (7.45%) | 1 | 1 | 1 |
| Q2 (1.05‐1.10) | 2452 | 130 (5.30%) | 0.70 (0.55, 0.87) .002 | 0.70 (0.55, 0.88) .003 | 0.71 (0.56, 0.90) .004 |
| Q3 (1.10‐1.15) | 2786 | 181 (6.50%) | 0.86 (0.70, 1.06) .167 | 0.86 (0.70, 1.07) .175 | 0.87 (0.70, 1.08) .208 |
| Q4 (≥1.15) | 2869 | 182 (6.34%) | 0.84 (0.68, 1.04) .104 | 0.78 (0.63, 0.97) .026 | 0.81 (0.65, 1.01) .058 |
| Categories | |||||
| Q1 (<1.05) | 2643 | 197 (7.45%) | 1 | 1 | 1 |
| Q2 ‐Q4 (≥1.05) | 8107 | 130 (5.30%) | 0.80 (0.68, 0.95) .013 | 0.79 (0.66, 0.94) .007 | 0.80 (0.66, 0.95) .014 |
| Categories | |||||
| Q2 ‐Q4 (≥1.05) | 8107 | 130 (5.30%) | 1 | 1 | 1 |
| Q1 (<1.05) | 2643 | 197 (7.45%) | 1.24 (1.05, 1.48) .013 | 1.27 (1.07, 1.52) .007 | 1.26 (1.05, 1.50) .014 |
Crude model was adjusted for none. Model 1 was adjusted for age, sex, SBP, DBP, pulse, smoking status, and drinking status. Model 2 was adjusted for all variables in Model 1 plus adjusted for BMI, FBG, TC, TG, LDL‐C, Hcy, AST, ALT, uric acid, TBiL, eGFR, antihypertensive drugs, glucose‐lowering drugs, and lipid‐lowering drugs.
Abbreviations: ABI, ankle‐brachial index; ALT, alanine aminotransferase; AST, aspartate aminotransferase; BMI, body mass index; DBP, diastolic blood pressure; eGFR, estimated glomerular filtration rate; FBG, fasting blood glucose; Hcy, homocysteine; LDL‐C, low‐density lipoprotein cholesterol; SBP, systolic blood pressure; TBiL, total bilirubin; TC, total cholesterol; TG, Triglycerides.
Figure 1.
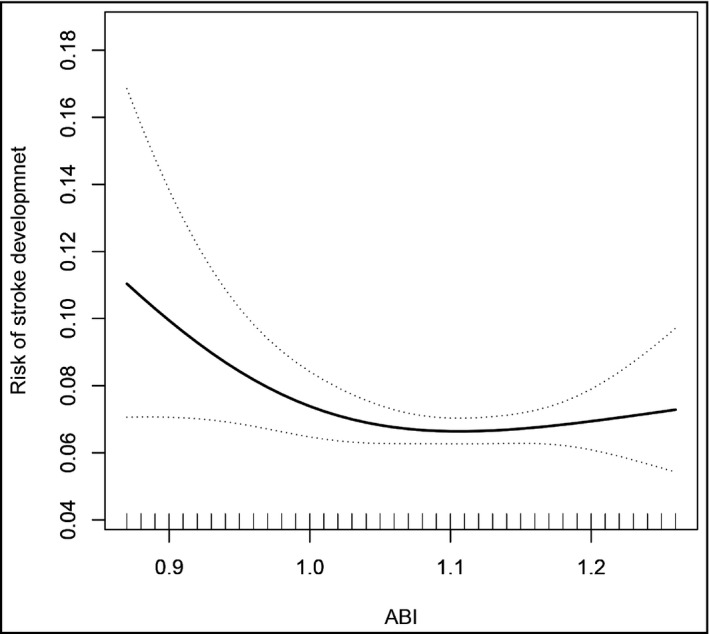
Association between ankle‐brachial index (ABI) and the prevalence of stroke. A nonlinear association between ABI and the prevalence of stroke was found (p < .05). The solid line and dashed line represent the estimated values and their corresponding 95% confidence interval. Adjustment factors included age, sex, SBP, DBP, pulse, smoking status, drinking status, BMI, FBG, TC, TG, LDL‐C, Hcy, AST, ALT, uric acid, TBiL, eGFR, antihypertensive drugs, glucose‐lowering drugs, and lipid‐lowering drugs
Conversely, a significantly higher prevalence of stroke (OR, 1.26; 95% CI: 1.05‐1.50) was found in participants in quartile 1 (<1.05) compared with participants in quartiles 2‐4 (≥1.05).
3.3. Subgroup analyses
To assess the relationship between ABI and stoke in various groups, we performed exploratory subgroup analyses (Figure 2). A significantly stronger inverse association between ABI (quartiles 2‐4, ≥1.05 vs. quartile 1,<1.05) and the risk of stroke was observed in the elderly over 65 years old (≥65 vs. <65 years, p for interaction = .012). However, the rest of the subgroup variables included sex (males vs. females), BMI (< 24 vs. ≥24 kg/m2), smoking status (never vs. former vs. current), and drinking status (never vs. former vs. current). After adjustment for age, sex, SBP, DBP, pulse, smoking status, drinking status, BMI, FBG, TC, TG, LDL‐C, Hcy, AST, ALT, uric acid, TBiL, eGFR, antihypertensive drugs, glucose‐lowering drugs, and lipid‐lowering drugs, except for the stratifying variables, there were no significant interactions in above variables (all p for interactions >.05).
Figure 2.
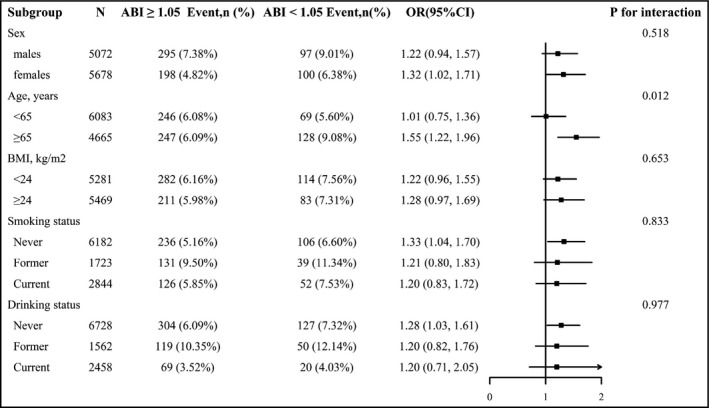
Stratified analysis for the stroke and ankle‐brachial index (ABI). *Each subgroup analysis adjusted for age, sex, SBP, DBP, pulse, smoking status, drinking status, BMI, FBG, TC, TG, LDL‐C, Hcy, AST, ALT, uric acid, TBiL, eGFR, antihypertensive drugs, glucose‐lowering drugs, and lipid‐lowering drugs, except for the stratifying variable
4. DISCUSSION
In a cross‐sectional study of a large sample population, the fully adjusted smooth curve fitting demonstrated an L‐shaped correlation between ABI and stroke among Chinese adults with hypertension without atrial fibrillation, and the inflection point of ABI was calculated to be 1.05. Moreover, a strong negative correlation between ABI and stroke can be observed in the elderly over 65 years old.
As far as we know, most previous studies had explored the relationship between ABI and stroke. Meves et al 10 conducted an open, prospective, noninterventional cohort study, including 6880 patients (age ≥ 65 years), and the result showed that low ABI (ABI < 0.9) independently raised risk of stroke (HR, 1.6; 95% CI, 1.1‐2.2), during the 5‐year follow‐up. A Honolulu Heart Program of 2767 males aged 71‐93 years showed that follow‐up for 3‐6 years, ABI is inversely related to stroke incidence. 11 A Framingham Study included 251 men and 423 women (mean age: 80 years) and followed up for four years, and evaluating the relationship between low ABI (ABI < 0.9) and stroke, coronary heart disease and death, reported that a statistically significant increase in the risk of stroke or transient ischemic attack in persons with a low ABI (hazards ratio, 2.0; 95% CI, 1.1‐3.7). 12 A recent meta‐analysis involving ten studies also showed that a lower ABI level is a risk predictor for increased stroke. 21 However, the ARIC study 13 showed that the lowest group (ABI < 0.80) had a hazard ratio of 1.93 (95% CI 0.78 to 4.78) in the risk of stroke. Newman et al 14 noted that low ABI (<0.9) was not associated with stroke, whether it is the population with CVD at baseline (RR 1.39 [95% CI: 0.85, 2.25]) or the population without CVD at baseline (RR1.12 [95% CI: 0.74, 1.70]). The above study's conclusions were not consistent. Moreover, none of the previous studies had assessed the nonlinear relationship between ABI and stroke.
In the current study, we have a new and more in‐depth understanding of the relationship between ABI and stroke. There is an L‐shaped correlation between ABI and stroke, not a simple linear correlation or irrelevance. The inflection point of ABI was calculated to be 1.05. The result showed that on the left side of the inflection point, the prevalence of the stroke gradually increased with the decreased ABI level; however, the stroke's prevalence no longer decreased with the increased ABI level in the right of an inflection point. At the same time, the subgroup analysis of this study suggests that there is a strong negative correlation between the ABI and stroke in the elderly aged 65 or older. Some researcher has confirmed that arterial stiffness is increasing with the aging process. 22 Not surprisingly, older adults are more likely at higher risk of stroke. 21 The reasons for these inconsistent findings might be research design. Specifically, previous studies only discussed the relationship between PAD and stroke, and only used ABI as an indicator to diagnose PAD, but did not evaluate the relationship between ABI and stroke. However, this study uses ABI as a continuous variable to evaluate its relationship with stroke.
However, the actual situation is that the prevalence rate of PAD is meager (<5%) in the general population. 23 The prevalence of PAD was only 3.19% in the hypertensive population in our study. In the current study, we use ABI as a continuous variable to analyze its relationship with stroke. We found an L‐shaped association between ABI and stroke, indicating that the low ABI cutoff point marking an increased stroke prevalence was about 1.05 in Chinese hypertensive population. As a possible reflection of the damage caused by the comprehensive action of risk factors, ABI can be used as a useful clinical tool for risk stratification of hypertensive patients, not just as a diagnostic criterion for PAD. Furthermore, Previous studies have shown that a lower ABI level is closely related to systemic atherosclerosis load. 24 , 25 This provides a shred of strong evidence for ABI to predict stroke.
Both lower (ABI ≤ 0.90) and higher (ABI > 1.40) ABI levels are independently related to all‐cause mortality and cardiovascular disease (CVD) in clinical practice. 26 , 27 , 28 However, in our study, there are only six patients with ABI > 1.4, and the sample size is too small to achieve statistical efficiency.
The potential limitations of our study should also be noted. First, this is an observational study, and we cannot wholly exclude uncontrolled confounding or reverse causality. Second, as a cross‐sectional study, we cannot obtain the causal relationship between ABI and stroke. Lastly, this study was conducted in Chinese adults with hypertension; whether the results can be extended to other populations remains discussed.
5. CONCLUSIONS
In summary, our results suggest that an L‐shaped association between ABI and the prevalence of stroke was found in general hypertensive patients, with a cutoff point at about 1.05. A significantly stronger inverse association between ABI ( ≥1.05 vs. <1.05) and the risk of stroke was observed in the elderly over 65 years old. The current study demonstrated that ABI measurement is rapid and straightforward, and can be carried out in the general practice of stroke screening, especially in hypertensive subjects, to reduce the risk of stroke.
CONFLICT OF INTEREST
The authors declare that they have no conflict of interest.
AUTHOR CONTRIBUTIONS
YMS participated in the literature search, data analysis, and data interpretation, and wrote the manuscript. LHH extracted and collected data. LHH, MHL, CCD, WZ, TW, and LJZ conceived the study and participated in its design and coordination. HHB and XSC participated in the study design and provided critical revision. All authors read and approved the final manuscript.
INFORMED CONSENT
Informed consent was obtained from all individual participants included in the study.
Supporting information
Figure S1
ACKNOWLEDGMENTS
We acknowledge the contribution of all staff who participated in this study as well as the study participants who shared their time with us.
Shi Y, Hu L, Li M, et al. The ankle–brachial index and risk of incident stroke in Chinese hypertensive population without atrial fibrillation: A cross‐sectional study. J Clin Hypertens.2021;23:114–121. 10.1111/jch.14102
Funding informationThis work was supported by the Science and Technology Innovation Platform Project of Jiangxi Province (Grant number: 20165BCD41005).
Contributor Information
Huihui Bao, Email: huihui_bao77@126.com.
Xiaoshu Cheng, Email: xiaoshumenfan126@163.com.
REFERENCES
- 1. Global, regional, and national burden of neurological disorders during 1990–2015: a systematic analysis for the Global Burden of Disease Study 2015. Lancet Neurol. 2017;16:877‐897. [DOI] [PMC free article] [PubMed] [Google Scholar]
- 2. Feigin VL, Lawes CM, Bennett DA, Barker‐Collo SL, Parag V. Worldwide stroke incidence and early case fatality reported in 56 population‐based studies: a systematic review. Lancet Neurol. 2009;8:355‐369. [DOI] [PubMed] [Google Scholar]
- 3. Guan T, Ma J, Li M, et al. Rapid transitions in the epidemiology of stroke and its risk factors in China from 2002 to 2013. Neurology. 2017;89:53‐61. [DOI] [PubMed] [Google Scholar]
- 4. Lewington S, Clarke R, Qizilbash N, Peto R, Collins R. Age‐specific relevance of usual blood pressure to vascular mortality: a meta‐analysis of individual data for one million adults in 61 prospective studies. Lancet. 2002;360:1903‐1913. [DOI] [PubMed] [Google Scholar]
- 5. Lawes CM, Rodgers A, Bennett DA, et al. Blood pressure and cardiovascular disease in the Asia Pacific region. J Hypertens. 2003;21:707‐716. [DOI] [PubMed] [Google Scholar]
- 6. Wang Z, Chen Z, Zhang L, et al. Status of hypertension in China: results from the China hypertension survey, 2012–2015. Circulation. 2018;137:2344‐2356. [DOI] [PubMed] [Google Scholar]
- 7. Hiatt WR. Medical treatment of peripheral arterial disease and claudication. N Engl J Med. 2001;344:1608‐1621. [DOI] [PubMed] [Google Scholar]
- 8. Halliday A, Bax JJ. The 2017 ESC Guidelines on the diagnosis and treatment of peripheral arterial diseases, in collaboration with the European Society for Vascular Surgery (ESVS). Eur J Vasc Endovasc Surg. 2018;55:301‐302. [DOI] [PubMed] [Google Scholar]
- 9. Hong JB, Leonards CO, Endres M, Siegerink B, Liman TG. Ankle‐Brachial Index and recurrent stroke risk: meta‐analysis. Stroke. 2016;47:317‐322. [DOI] [PubMed] [Google Scholar]
- 10. Meves SH, Diehm C, Berger K, et al. Peripheral arterial disease as an independent predictor for excess stroke morbidity and mortality in primary‐care patients: 5‐year results of the getABI study. Cerebrovasc Dis. 2010;29:546‐554. [DOI] [PubMed] [Google Scholar]
- 11. Abbott RD, Rodriguez BL, Petrovitch H, et al. Ankle‐brachial blood pressure in elderly men and the risk of stroke: the Honolulu Heart Program. J Clin Epidemiol. 2001;54:973‐978. [DOI] [PubMed] [Google Scholar]
- 12. Murabito JM, Evans JC, Larson MG, Nieto K, Levy D, Wilson PW. The ankle‐brachial index in the elderly and risk of stroke, coronary disease, and death: the Framingham Study. Arch Intern Med. 2003;163:1939‐1942. [DOI] [PubMed] [Google Scholar]
- 13. Tsai AW, Folsom AR, Rosamond WD, Jones DW. Ankle‐brachial index and 7‐year ischemic stroke incidence: the ARIC study. Stroke. 2001;32:1721‐1724. [DOI] [PubMed] [Google Scholar]
- 14. Newman AB, Shemanski L, Manolio TA, et al. Ankle‐arm index as a predictor of cardiovascular disease and mortality in the Cardiovascular Health Study. Arterioscler Thromb Vasc Biol. 1999;19:538‐545. [DOI] [PubMed] [Google Scholar]
- 15. Wu S, Wu B, Liu M, et al. Stroke in China: advances and challenges in epidemiology, prevention, and management. Lancet Neurol. 2019;18:394‐405. [DOI] [PubMed] [Google Scholar]
- 16. Yu Y, Hu L, Huang X, Zhou W, Bao H, Cheng X. BMI modifies the association between serum HDL cholesterol and stroke in a hypertensive population without atrial fibrillation. J Endocrinol Invest. 2020. [DOI] [PubMed] [Google Scholar]
- 17. Chinese Guidelines for prevention and treatment of hypertension‐a report of the revision Committee of Chinese Guidelines for prevention and treatment of hypertension. J Geriatr Cardiol. 2019;16:182‐241. [DOI] [PMC free article] [PubMed] [Google Scholar]
- 18. Momin M, Li JP, Zhang Y, et al. Body mass index is inversely associated with arterial stiffness in Chinese adults with primary hypertension: results from the China Stroke Primary Prevention Trial (CSPPT). Clin Exp Hypertens. 2017;39:394‐401. [DOI] [PubMed] [Google Scholar]
- 19. Levey AS, Stevens LA, Schmid CH, et al. A new equation to estimate glomerular filtration rate. Ann Intern Med. 2009;150:604‐612. [DOI] [PMC free article] [PubMed] [Google Scholar]
- 20. Hu L, Huang X, Zhou W, et al. Effect of hypertension status on the association between sleep duration and stroke among middle‐aged and elderly population. J Clin Hypertens (Greenwich). 2020;22:65‐73. [DOI] [PMC free article] [PubMed] [Google Scholar]
- 21. Fan H, Hu X, Yu W, et al. Low ankle‐brachial index and risk of stroke. Atherosclerosis. 2013;229:317‐323. [DOI] [PubMed] [Google Scholar]
- 22. McEniery CM, Yasmin F, Maki‐Petaja KM, et al. The impact of cardiovascular risk factors on aortic stiffness and wave reflections depends on age: the Anglo‐Cardiff Collaborative Trial (ACCT III). Hypertension. 2010;56:591‐597. [DOI] [PubMed] [Google Scholar]
- 23. McEvoy JW, Nasir K. ABI and stroke: action at a distance and a call to action. Atherosclerosis. 2014;234:73‐74. [DOI] [PubMed] [Google Scholar]
- 24. Aboyans V, Criqui MH, Abraham P, et al. Measurement and interpretation of the ankle‐brachial index: a scientific statement from the American Heart Association. Circulation. 2012;126:2890‐2909. [DOI] [PubMed] [Google Scholar]
- 25. McDermott MM, Liu K, Criqui MH, et al. Ankle‐brachial index and subclinical cardiac and carotid disease: the multi‐ethnic study of atherosclerosis. Am J Epidemiol. 2005;162:33‐41. [DOI] [PubMed] [Google Scholar]
- 26. Resnick HE, Lindsay RS, McDermott MM, et al. Relationship of high and low ankle brachial index to all‐cause and cardiovascular disease mortality: the Strong Heart Study. Circulation. 2004;109:733‐739. [DOI] [PubMed] [Google Scholar]
- 27. Pasqualini L, Schillaci G, Pirro M, et al. Prognostic value of low and high ankle‐brachial index in hospitalized medical patients. EUR J Intern Med. 2012;23:240‐244. [DOI] [PubMed] [Google Scholar]
- 28. Manzano L, Mostaza JM, Suarez C, et al. Prognostic value of the ankle‐brachial index in elderly patients with a stable chronic cardiovascular event. J Thromb Haemost. 2010;8:1176‐1184. [DOI] [PubMed] [Google Scholar]
Associated Data
This section collects any data citations, data availability statements, or supplementary materials included in this article.
Supplementary Materials
Figure S1