

Abstract
Echocardiographic alterations have been described in obesity, but their modifications after bariatric surgery (BS) and mechanisms are little known, mostly in normotensive patients. We aimed to analyze cardiac changes 1 year post‐BS and to explore possible mechanisms. A cohort of patients with severe obesity (58% normotensives) were prospectively recruited and examined before surgery and after 12 months. Clinical and echocardiographic data, 24 h BP, renin‐angiotensin‐aldosterone system (RAAS) components, cytokines, and inflammatory markers were analyzed at these two time points. Overall reduction in body weight was mean (IQR) = 30.0% (25.9–33.8). There were statistically significant decreases in left ventricle mass index2.7(LVMI)2.7, septum thickness (ST), posterior wall thickness (PWT), relative wall thickness (RWT), and E/e’, both in the whole cohort and in patients without RAAS blockers (p ≤ .04 for all). Plasma renin activity (PRA) decreased from (median, IQR) = 0.8 (0.3;1.35) to 0.4 (0.2;0.93) ng/ml/h, plasma aldosterone from 92 (58.6;126) to 68.1 (56.2;83.4) ng/dl, and angiotensin‐converting enzyme (ACE)‐2 activity from 7.7 (5.7;11.8) to 6.8 (5.3;11.2) RFU/µl/h, p < .05. The body weight loss correlated with a decrease in both 24 h SBP and 24 h DBP (Pearson's coefficient 0.353, p = .022 and 0.384, p = .012, respectively). Variation (Δ) of body weight correlated with ΔE/e’ (Pearson's coeff. 0.414, p = .008) and with Δ lateral e’ (Pearson's coeff. = −0.363, p = .018). Generalized linear models showed that ΔPRA was an independent variable for the final (12‐months post‐BS) LVMI2.7 (p = .028). No other changes in cardiac parameters correlated with ΔBP. In addition to the respective baseline value, final values of PWT and RWT were dependent on 12‐month Δ of PRA, ACE, and ACE/ACE2 (p < .03 for all). We conclude that there are cardiac changes post‐BS in patients with severe obesity, normotensives included. Structural changes appear to be related to modifications in the renin‐angiotensin axis.
Keywords: angiotensin‐converting enzyme 2, bariatric surgery, blood pressure, echocardiography, renin‐angiotensin axis, severe obesity
1. INTRODUCTION
Obesity has become a global epidemic, with an estimation of around 500 million obese people worldwide, 1 , 2 and in the last few decades has aroused much interest within the scientific community. Obesity is a recognized contributor to cardiac and all‐cause mortality, and this mortality increased risk is independent of other associated cardiovascular risk factors. 3 , 4 Not only mortality, but also cardiovascular morbidity, especially heart failure, increases with excess body weight. 5 , 6 It has been shown that this risk decreases after losing weight, mostly for those patients undergoing bariatric surgery (BS). Although some studies highlight the benefits of BS in reducing or eliminating risk factors for cardiovascular disease, 7 the mechanisms by which weight reduction decreases the cardiovascular risk of these patients are not well established. On the other hand, to date several works have reported echocardiographic alterations in morphology and function in obese patients. 8 , 9 , 10 The effects of BS on cardiac structure and function have been recorded in a systematic review and meta‐analysis. 11 Although cardiac remodeling in obesity is a multi‐factorial process, there is little evidence on the pathophysiological mechanisms underlying these changes, especially with regard to echocardiographic patterns of cardiac morphology and function and to their changes after BS in patients with severe obesity.
Thus, we explored in depth the structure and function of heart in patients with severe obesity using transthoracic echocardiography and analyzed the effect of weight reduction on these parameters one year after undergoing BS. Additionally, in this study, we assessed the role of the renin‐angiotensin aldosterone system (RAAS) and inflammation as potential mechanisms responsible for such changes.
2. METHODS
2.1. Study design and patients
The BARIHTA (Hemodynamic Changes And Vascular Tone Control After BARIatric Surgery. Prognostic Value Regarding HyperTension And Target Organ Damage) study is a prospective, observational, unicentre trial in a cohort of consecutively recruited patients with severe obesity scheduled to undergo BS (clinicaltrials.gov identifier: NCT03115502). Details about BARIHTA trial have been published elsewhere. 12 In brief, the BARIHTA study enrolled outpatients attending consults in the Endocrinology Department of a tertiary care centre, the Hospital del Mar in Barcelona, Catalonia, Spain, because of severe obesity and looking for surgical treatment. All participants of both sexes aged between 18 and 60 years at study entry with medical indication for treatment with BS because of severe obesity and who agreed to undergo the surgical intervention were invited to participate. According to the local protocol for the surgical treatment of obesity, patients were candidates if they had grade III obesity (body mass index [BMI] > 40 kg/m2) or grade II obesity (BMI > 35 kg/m2) plus associated comorbidities (type 2 diabetes mellitus, sleep apnea syndrome, obesity‐associated hypoventilation disease, hypertension, or dyslipidemia). Both normotensive and hypertensive patients were included. The exclusion criteria comprised the failure to meet the inclusion requirements, the exclusion of the BS program for any reason, or the refusal to give informed consent to participate. After agreeing to participate in the study, the patients received in detail information on the trial in the Hypertension and Vascular Risk Unit and the informed consent was obtained. The trial was approved by the local institutional Ethic Committee in accordance with the Declaration of Helsinki.
As reported, the primary point was to analyze mean changes in 24 h aortic (central) systolic blood pressure from baseline to the final examination (12 months). 12 Here, we report additional analysis focused on the effect of BS on cardiac structure and function as determined by complete echocardiographic examination and its relationship with several RAAS components, according to pre‐specified secondary end points.
Demographic and clinical data were recorded from all participants in the inclusion visit. Anthropometric characteristics as well as office and 24 h blood pressure (BP) recordings and laboratory tests, including RAAS components, cytokines, and inflammatory markers, were obtained at baseline and 12 months post‐BS. As per protocol, all patients underwent two complete cardiac ultrasounds studies, right before and 12 months post‐BS, respectively. Information regarding any pharmacological treatment was also collected at each visit. Hypertension was considered if patient received antihypertensive drugs and/or if the baseline peripheral 24‐h BP was equal or higher than 130/80 mmHg.
2.2. Procedures
2.2.1. Blood pressure measurements
All BP measurements were performed by means of a non‐invasive automated oscillometric device (Mobil‐O‐Graph PWV; IEM, Stolberg, Germany), validated for brachial BP measurement, according to the European Society of Hypertension International protocol 13 and using suitable sized cuffs. The monitor was placed on a working day, starting between 08:00 and 10:00 h AM Blood pressure was recorded automatically at 20‐min intervals throughout both the awake and asleep periods, as defined in the patients’ diary. All patients included in the study had recordings of good technical quality (at least 70% of valid readings). Otherwise, a new ambulatory BP monitoring (ABPM) was repeated within 1 week and used as the valid one.
2.2.2. Echocardiographic measurements
Two echocardiographic studies were performed in included patients, one at baseline right before BS and the second 12 months post‐BS. All echocardiography examinations were performed and read by one single experienced physician. Ultrasound examination was performed using 2.0–4.0‐MHz transducers on a Vivid E9 system (GE Healthcare). The examinations were carried out with the patients in the partial left decubitus position. Cardiac dimensions and functions were measured in accordance with current recommendations. 14 Thus, left ventricular (LV) internal dimension measured at end diastole, septum (ST), and posterior wall thickness (PWT) were determined, and LV mass was calculated (LVM). Left ventricular mass index (LVMI) was assessed by two different formulas: (1) by indexing LVM to body surface area and (2) by indexing LVM to [height2.7]. The latter method is proposed to be an optimal allometric correction factor that minimizes gender differences in cardiac size and geometry. 15 Accordingly, the diagnosis of LV hypertrophy (LVH) was considered if LVMI was >115 g/m2 for men and >95 g/m2 for women, or if >48 g/m2.7 and >44 g/m2.7 in men and women, respectively. 16 Relative wall thickness (RWT) was also calculated by the equation RWT = 2 × PWT / LV internal diameter at end diastole (RWT was abnormal if >0.42). Left atrium (LA) volume and area indexes were also measured. LA volume index was abnormal if ≥34 ml/m2. Alterations in systolic function were evaluated by measuring the ejection fraction (EF) by both the Teichholz and Simpson methods, and by the global longitudinal strain (GLS), this latter with a normal value being considered when less than −20%. 13 Alterations in diastolic function were assessed by both pulsed‐wave tissue Doppler recordings of peak early (E‐wave) and recordings of the lateral portion of the mitral annulus to obtain the early diastolic e′‐wave velocity. Septal e’ was measured and averaged with lateral e’ to obtain the final e’ value. The mitral inflow E velocity to tissue Doppler e′ (E/e′) ratio was used as an index of LV filling (being abnormal if >14). Right ventricle function was assessed by TAPSE (Tricuspid annular plane systolic excursion), abnormal threshold considered if <17 mm.
2.2.3. Renin‐angiotensin aldosterone system (RAAS) components
Plasma renin activity (PRA) and plasma aldosterone concentration, as well as angiotensin‐converting enzyme (ACE) and angiotensin‐converting enzyme 2 (ACE2) activities, were measured by validated laboratory methods after washout of interfering drugs (Data S1). 17 , 18 , 19 , 20
2.2.4. Surgical techniques
Either laparoscopic Roux‐en‐Y gastric bypass (LRYGB) or laparoscopic sleeve gastrectomy (LSG) were chosen for each patient based on clinical criteria and the consensus of the Bariatric Surgery Unit. In this respect, LSG was preferred in younger patients, in those with BMI in the 35–40 kg/m2 range, as a first‐step treatment in cases with a BMI > 50 kg/m2 and when drug malabsorption was to be avoided. 21 The LRYGB technique involved a 150‐cm antecolic Roux limb with 25‐mm circular pouch–jejunostomy and exclusion of 50 cm of the proximal jejunum. In LSG, the longitudinal resection of the stomach from the angle of His to approximately 5 cm proximal to the pylorus was performed using a 36‐French bougie inserted along the lesser curvature. All the interventions were carried out by the same team of surgeons.
2.3. Statistical analyses
Ordinary statistical methods were applied with statistical package SPSS for Windows version 25.0 (Cary, North Carolina, USA). Briefly, variables following normal distribution are summarized as mean ± SD and as median with interquartile range (IQR) in case of a non‐normal distribution according to the Kolmogorov‐Smirnov test. Categorical and dichotomous variables are presented as frequencies and percentages. Comparisons of analyzed variables between the two observed periods, at baseline and 12 months after undergoing BS, were carried out by paired t tests in continuous normally distributed data, by nonparametric Wilcoxon test in non‐normally distributed continuous data, or by chi‐square test in categorical data. Several multiple linear regression models were constructed for the resulting 12‐month value of each echocardiography parameter (dependent variable) adjusting by variation (Δ) of body weight, the baseline value of the same echocardiographic parameter and Δ of each assessed RAAS components (independent variables). Results are shown by the B coefficient and corresponding 95% confidence intervals (95%CI). A change was considered significant if the two‐side alpha level was ≤ 0.05. Pearson or Spearman correlation coefficients were used for testing bivariate correlations as appropriate. A sample size calculation was initially calculated, and 61 subjects were assumed as needed to answer the primary outcome. 12 A post hoc power calculation was performed regarding the paired t test for the variable Δ of LVMI2.7 between final and baseline cardiac ultrasound examinations. Since we have a mean difference of −6.0 and a standard deviation of 11.3 (effect size = −0.52), for an α = 0.05, a power of 93.4% was found for the 45 patients analyzed sample.
3. RESULTS
In total, 62 patients completed the BARIHTA study. Complete baseline and final cardiac ultrasound studies were available for forty‐five subjects, and these comprise the cohort reported here. The reason that seventeen patients were lost for this analysis was because they did not have a cardiac ultrasound before BS due to the short time between recruitment and surgery, or because some patients declined to undergo the last cardiac examination after BS. A flow chart of the study is supplied in Supplemental material (Figure S1). Baseline clinical characteristics are shown in Table 1. There was a higher prevalence of female patients, and 58% of subjects were normotensives. Mean ± SD body weight for the whole cohort was 118.6 ± 20.1 Kg, and body mass index was 42.5 ± 6 Kg/m2. None of the patients undergoing BS met the criteria for heart failure, and none of them died within 12 months follow‐up.
Table 1.
Baseline clinical and anthropometric characteristics
| Age, year (mean ± SD) | 44.2 ± 8.6 |
| Sex, women, n (%) | 34 (75.6) |
| Race, Caucasian, n (%) | 40 (88.9) |
| Current smokers, n (%) | 9 (20) |
| Body weight, Kg (mean ± SD) | 118.6 ± 20.1 |
| Body mass index, kg/m2 (mean ± SD) | 42.5 ± 6.0 |
| Waist circumference, cm (mean ± SD) | 132.1 ± 12.6 |
| Surgical procedure, n (%) | |
| Sleeve gastrectomy | 22 (48.9) |
| Roux‐en‐Y gastric bypass | 23 (51.1) |
| Hypertension, n (%) | 19 (42.2) |
| T2‐Diabetes Mellitus, n (%) | 5 (11.1) |
| Dyslipidemia, n (%) | 12 (26.7) |
| Previous major vascular event, n (%) | 3 (6.7) |
| Sleep apnea syndrome, n (%) | 11 (24.4) |
| CPAP, n (%) | 8 (72.7) |
Abbreviations: CPAP, continuous positive airway pressure; T2, type 2.
Twelve out of the 45 patients received treatment with a RAAS blocker. For this reason, the main analyses are performed separately in both the whole cohort and in those not treated with a RAAS blocker. Of note, none of the patients in this study were treated with a sodium‐glucose transport protein 2‐inhibitor or a glucagon‐like peptide‐1 receptor agonist.
3.1. Changes in body weight and blood pressure
Twelve months after undergoing BS, the overall reduction in body weight was mean (IQR) = 30.0% (25.9–33.8). As regards the primary outcome of the BARIHTA study, that is, changes in 24 h aortic systolic blood pressure (SBP), there was a statistically significant decrease at 12‐month (mean, 95%CI) = −3.1 mmHg; −5.5 to −0.7. As we previously reported, 12 there was also a decrease in 24 h peripheral SBP of −2.5 mmHg (−4.9 to −0.1). Even in the subgroup of patients with BP in normal range at baseline and not receiving any antihypertensive drug, there was a trend to a decrease in almost all BP estimates 12 months post‐BS, after adjusting by body weight variation (Table S1).
Table S2 also shows a statistically significant decrease in heart rate and in cardiac output as estimated by the Mobile‐O‐Graph® device 12 months post‐BS.
3.2. Changes in cardiac ultrasound parameters
Table 2 shows the baseline values of echocardiographic measurements and their variation at 12‐month post‐BS in the whole cohort. For all patients, there was a statistically significant improvement in most parameters of LV morphology and in LV diastolic function. As regards LV morphology, there were significant decreases in LV mass, LVMI (2.7), PWT, ST, and RWT. With respect to LV systolic function, there was no significant change in either the EF or the GLS. Finally, there was an improvement in LV diastolic function, as shown by a statistically significant increase in lateral e’ and a decrease in the E/e’ ratio. In addition, we conducted the same analysis in the subgroup of patients (n = 33) who did not receive an angiotensin‐converting enzyme inhibitor (ACEi) or an angiotensin receptor blocker (ARB), observing a similar improvement in the same echocardiographic parameters of LV structure and function (Table 2).
Table 2.
Changes in echocardiographic parameters after bariatric surgery in the whole cohort and in the subgroup of patients without RAAS blockers
| Parameter | All patients (n = 45) | Patients without RAAS blockers (n = 33) | |||||
|---|---|---|---|---|---|---|---|
| Baseline value, Mean ± SD | Change at 12 months, Mean (95% CI) | p | Baseline value, Mean ± SD | Change at 12 months, Mean (95% CI) | p | p‐adjusted * | |
| Left ventricular morphology | |||||||
| Left ventricular mass, g | 176.7 ± 51.0 | −24.4 (−37.9 to −10.9) | .001 | 170.4 ± 52.3 | −26.7 (−42.6 to −10.9) | .002 | .002 |
| Left ventricular mass index, g/m2 | 78.6 ± 19.0 | 1.0 (−5.3 to 7.3) | .754 | 75.8 ± 20.2 | −0.3 (−7.6 to 7.0) | .931 | .059 |
| Left ventricular mass index, g/height2.7 | 44.2 ± 11.1 | −6.0 (−9.4 to −2.6) | .001 | 43.0 ± 12.0 | −6.8 (−10.8 to −2.8) | .001 | .020 |
| Septum thickness, mm | 10.3 ± 1.6 | −1.0 (−1.4 to −0.5) | <.001 | 10.0 ± 1.5 | −1.0 (−1.5 to −0.5) | <.001 | .015 |
| Posterior wall thickness, mm | 10.1 ± 1.7 | −0.9 (−1.3 to −0.5) | <.001 | 9.8 ± 1.6 | −1.0 (−1.5 to −0.5) | .001 | .016 |
| Relative wall thickness, cm | 0.43 ± 0.08 | −0.03 (−0.05 to −0.01) | .004 | 0.41 ± 0.06 | −0.04 (−0.06 to −0.01) | .004 | .040 |
| Left ventricular internal systolic dimension, mm | 28.5 ± 3.9 | −0.9 (−0.3 to 2.1) | .148 | 28.3 ± 4.0 | −0.8 (−2.3 to 0.6) | .254 | .022 |
| Left ventricular internal diastolic dimension, mm | 47.7 ± 4.8 | −0.7 (−0.8 to 2.2) | .376 | 47.8 ± 4.5 | −0.7 (−2.3 to 0.9) | .377 | .008 |
| Left ventricular systolic function | |||||||
| Ejection fraction (Teichholz), % | 64.6 ± 5.5 | 1.6 (−0.4 to 3.6) | .117 | 65.0 ± 5.0 | 1.2 (−1.3 to 3.7) | .342 | .269 |
| Ejection fraction (Simpson), % | 64.3 ± 6.1 | −0.2 (−2.7 to 2.4) | .887 | 64.2 ± 6.1 | 0.2 (−2.5 to 2.8) | .909 | .873 |
| Global longitudinal strain, % | −19.1 ± 2.8 | −0.7 (−1.8 to 0.3) | .174 | −19.4 ± 3.0 | −0.6 (−1.9 to 0.7) | .337 | .191 |
| Left ventricular diastolic function | |||||||
| e’ lateral, cm/s | 12.3 ± 2.6 | 2.3 (1.7 to 2.9) | <.001 | 12.7 ± 2.7 | 2.1 (1.4 to 2.8) | <.001 | <.001 |
| e’ septal, cm/s | 10.6 ± 2.2 | 0.7 (−0.1 to 1.5) | .075 | 10.8 ± 2.3 | 0.9 (−0.1 to 1.8) | .065 | <.001 |
| E/e’ | 7.1 ± 1.7 | −0.8 (−0.4 to −1.3) | .001 | 7.0 ± 1.7 | −1.2 (−1.8 to −0.6) | <.001 | .003 |
| Left atrium volume index, ml/m2 | 21.7 ± 5.2 | 2.8 (0.7 to 4.9) | .010 | 20.9 ± 5.2 | 3.2 (0.6 to 5.6) | .016 | .631 |
| Right ventricular function | |||||||
| TAPSE, mm | 26.2 ± 3.0 | −0.5 (−1.8 to 0.8) | .426 | 25.6 ± 2.9 | 0.8 (−0.7 to 2.4) | .294 | .694 |
Abbreviations: RAAS, renin‐angiotensin aldosterone system; TAPSE, Tricuspid annular plane systolic excursion.
p‐adjusted by variation of body weight.
The bold values are those who have statistical significance (i.e., all with a p<0.05).
There was no statistically significant difference in most of these changes according to the surgical technique (Table S3), but we observed that changes in most parameters of LV diastolic function occurred in the LRYGB group but not in the LSG one. It is noteworthy that weight loss was significantly greater in the LRYGB vs. LSG: 32.2% ± 6.4% vs 27.2% ± 6.5, respectively, p = .015. The same results are confirmed in the subgroup of patients without RAAS blockers (Table S4). We then performed ANOVA for the variation of each of the echocardiographic parameters adjusting by the type of surgery. We did not find the type of surgery to be significant in any case (data not shown). On the other hand, we did the same analysis but adjusting by body weight variation. In this case, the only significant finding was that body weight variation was an independent variable for the variation at 12 months of septal e’ (p = .018) and E/e’ ratio (p = .035), suggesting that changes in diastolic dysfunction could be related to weight loss and thus, indirectly, to the type of surgery.
Overall, 12‐month post‐BS there was a statistically significant decrease in the frequency of patients either with LVH, abnormal RWT, and abnormal global longitudinal strain (Table 3).
Table 3.
Changes in the frequencies of patients with echocardiographic abnormal parameters
| Echocardiographic abnormal parameters (% of patients with) | Baseline | 12 months post‐BS | p |
|---|---|---|---|
| Left ventricular hypertrophy a , (%) | 10 | 15 | NS |
| Left ventricular hypertrophy b , (%) | 40 | 19 | .04 |
| Abnormal RWT, (%) | 49 | 30 | .02 |
| Abnormal EF, (%) | 0 | 0 | – |
| Abnormal GLS, (%) | 62 | 43 | .007 |
| Abnormal E/e’, (%) | 0 | 0 | – |
| Abnormal LAVI, (%) | 2 | 5 | NS |
| Abnormal TAPSE, (%) | 0 | 0 | – |
“Abnormality” for each of the parameters is described in the Methods section.
Abbreviations: BS, bariatric surgery; EF, ejection fraction; GLS, global longitudinal strain; LAVI, left atrium volume index; RWT, relative wall thickness; TAPSE, Tricuspid annular plane systolic excursion.
According to left ventricular mass index = mass (g)/BSA‐body surface area (m2)
According to left ventricular mass index = mass (g)/height2.7
The bold values are those who have statistical significance (i.e., all with a p<0.05).
In Figure 1, we show changes in the frequencies of LV geometry patterns from baseline to 12 months post‐BS. There was an increase in the percentage of patients with normal geometry, mostly due to a decrease in the concentric hypertrophy and the concentric remodeling patterns.
Figure 1.
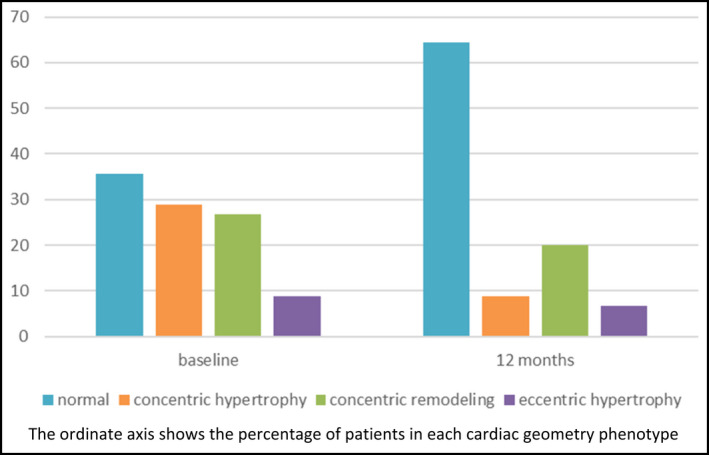
Baseline and at 12 months follow‐up changes in LV geometry patterns after BS
3.3. Changes in RAAS components, cytokines, and inflammatory markers
We also analyzed changes 12 months after BS in several components of the RAAS (Table 4). There was a statistically significant decrease in PRA, aldosterone, and ACE2 activity, and an increase in ACE/ACE2 ratio. As shown, similar results were obtained when exploring changes in the subgroup of patients not receiving RAAS blockers, even though 12‐month decreases in plasma aldosterone did not reach statistical significance (Table 4). Moreover, there was no difference in most of these changes according to the surgical technique in sensitivity analyses (Table S5), although the decrease in PRA appears to be more significant in LRYGB than in LSG patients. Changes in different cytokines and inflammatory markers were also analyzed (Table 5). There were significant decreases in high‐sensitivity C‐reactive protein and leptin levels.
Table 4.
Changes in the RAAS components after BS in the whole cohort and in the subgroup of patients without RAAS blockers
| All patients (n = 45) | Patients without RAAS blockers (n = 33) | |||||
|---|---|---|---|---|---|---|
| Baseline value, Mean ± SD | 12 months post‐BS, Mean ± SD | p | Baseline value, Mean ± SD | 12 months post‐BS, Mean ± SD | p | |
| PRA a , ng/ml/h | 0.8 [0.3; 1.35] | 0.4 [0.2; 0.93] | .033 | 0.8 [0.4; 1.3] | 0.4 [0.2; 1.0] | .042 |
| Aldosterone a , ng/dl | 92 [58.6; 126] | 68.1 [56.2; 83.4] | .004 | 86 [58.6; 108.5] | 66.7 [56.8; 82.6] | .072 |
| ACE Activity, RFU/µl | 1232.4 ± 355.0 | 1282.5 ± 378.9 | .363 | 1163.3 ± 301.4 | 1196.1 ± 353.8 | .655 |
| ACE2 activity a , RFU/µl/h | 7.7 [5.7; 11.8] | 6.8 [5.3; 11.2] | .037 | 7.9 [5.7; 12.3] | 6.0 [5.0; 9.0] | .013 |
| ACE act./ACE2 act. | 161.1 ± 81.6 | 187.9 ± 82.1 | .014 | 153.5 ± 83.2 | 188.2 ± 87.1 | .023 |
Abbreviations: ACE, angiotensin‐converting enzyme; ACE2, angiotensin‐converting enzyme 2; PRA, plasma renin activity; RAAS, renin‐angiotensin aldosterone system; RFU, relative fluorescence units.
Expressed as median [interquartile range].
The bold values are those who have statistical significance (i.e., all with a p<0.05).
Table 5.
Changes in cytokines and inflammatory markers after BS
| Parameter | Baseline, Mean ± SD | 12 months post‐BS, Mean ± SD | Change at 12 months, Mean (95% CI) | p |
|---|---|---|---|---|
| Leptin, ng/ml | 64.6 ± 45.6 | 20.4 ± 16.6 | −44.2 (−56.6 to −31.8) | <.001 |
| Adiponectine a , μg/ml | 20.0 [11.8; 34.8] | 27.5 [15.0; 46.4] | 9.1 (−5.2 to 23.4) | .140 |
| Resistin a , ng/ml | 37.6 [28.0; 47.4] | 31.1 [26.8; 42.3] | −4.9 (−10.1 to 0.4) | .111 |
| MCP‐1, pg/ml | 580.0 ± 206.0 | 562.3 ± 236.5 | −17.7 (−83.7 to 48.3) | .140 |
| hs‐CRP a , mg/dl | 0.68 [0.43; 0.99] | 0.10 [0.06; 0.30] | −0.62 (−0.93 to −0.31) | <.001 |
Abbreviations: hs‐CRP, high‐sensitivity C‐reactive protein; MCP‐1, monocyte chemoattractant protein‐1.
Expressed as median [interquartile range].
The bold values are those who have statistical significance (i.e., all with a p<0.05).
Generalized linear models were built for each of these statistically significant changes in echocardiographic parameters (Table 6). Again, because RAAS parameters were included in these analyses, they were performed only in patients not receiving RAAS blockers. The statistically significant independent variables for the final (12 months post‐BS) LVMI (2.7) were the baseline value of LVMI (2.7) and Δ PRA. In addition to the respective baseline value of each analyzed cardiac parameter, final values of ST, PWT, and RWT were dependent on several RAAS components, that is, 12‐month Δ PRA, Δ ACE and Δ ACE/ACE2. As shown, body weight decrease was also related to the change observed in RWT in one model. When similar models with diastolic function parameters were constructed, we found that final lateral e’, septal e’, and E/e’ depended on the respective baseline value, but in some of the models, the Δ body weight also was significant for the final values of lateral e’ and E/e’. The Δ of any component of the RAAS axis was not related to the final value of these parameters of diastolic function (data not shown). Equivalent results were obtained when either peripheral or central 24 h SBP was included in the model.
Table 6.
Role of several factors on changes in left ventricular morphology echocardiographic parameters in patients without RAAS blockers
| Dep. variable | B coeff. | 95% (CI) | p | Dep. variable | B coeff. | 95% (CI) | p | Dep. variable | B coeff. | 95% (CI) | p |
|---|---|---|---|---|---|---|---|---|---|---|---|
| 12‐month LVM | |||||||||||
| Δ body weight | ‐ | ||||||||||
| baseline LVM | 0.409 | 0.149 to 0.669 | .003 | ||||||||
| Δ PRA | −15.7 | −28.0 to −3.4 | .014 | ||||||||
| 12‐month LVMI (2.7) | |||||||||||
| Δ body weight | ‐ | ||||||||||
| baseline LVMI (2.7) | 0.311 | 0.057 to 0.565 | .018 | ||||||||
| Δ PRA | −3.627 | −6.841 to −0.413 | .028 | ||||||||
| 12‐month ST | ‐ | ||||||||||
| Δ body weight | ‐ | ||||||||||
| Baseline ST | 0.36 | 0.039 to 0.682 | .03 | ||||||||
| Δ PRA | −0.4 | −0.807 to 0.007 | .054 | ||||||||
| 12‐month PWT | |||||||||||
| Δ body weight | ‐ | Δ body weight | ‐ | Δ body weight | ‐ | ||||||
| baseline PWT | 0.327 | 0.148 to 0.506 | .001 | baseline PWT | 0.529 | 0.302 to 0.756 | <.001 | baseline PWT | 0.399 | 0.139 to 0.659 | .004 |
| Δ PRA | −0.595 | −0.921 to −0.269 | .001 | Δ ACE | −0.002 | −0.003 to −0.001 | .008 | Δ ACE/ACE2 | −0.010 | −0.018 to −0.003 | .007 |
| 12‐month RWT | |||||||||||
| Δ body weight | ‐ | Δ body weight | −0.002 | −0.004 to <0.001 | .026 | ||||||
| baseline RWT | 0.437 | 0.151 to 0.724 | .005 | baseline RWT | ‐ | ||||||
| Δ ACE | −0.001 | −0.014 to −0.000 | .002 | Δ ACE/ACE2 | −0.001 | −0.001 to 0.000 | <.001 |
Abbreviations: Δ, variation; ACE, angiotensin‐converting enzyme; CI, confidence intervals; Dep., dependent; LVM, left ventricular mass; LVMI (2.7), Left ventricular mass index, g/height2.7; PRA, plasma renin activity; PWT, posterior wall thickness; RAAS, renin‐angiotensin aldosterone system; RWT, relative wall thickness; SBP, systolic blood pressure; ST, septum thickness.
In addition, Spearman's and Pearson's correlation coefficients, as appropriate, were obtained to measure the association between the observed changes.
3.4. Correlations between changes in body weight, BP, and cardiac parameters in patients without RAAS blockers
The decrease in body weight significantly correlated with a decrease in both 24 h SBP (Figure 2A) and 24 h DBP (Pearson's coefficients = 0.424, p = .022 and 0.361, p = .046, respectively). The only correlation between changes in body weight and changes in cardiac structure and function was with LV diastolic function: Δ body weight correlated with Δ E/e’ (Pearson's coeff. 0.362, p = .045) and with Δ lateral e’ (Pearson's coeff. = −0.352, p = .048), respectively. With respect to changes in BP, there was no correlation between changes in the different BP estimators and cardiac changes, except between Δ 24 h SBP and Δ GLS (Rho = −0.470, p = .018) and between Δ 24 h DBP and Δ of GLS (Rho = −0.486, p = .014). As expected, there were statistically significant correlations of Δ cardiac output with both Δ 24 h SBP (Rho = 0.400, p = .029) and Δ of heart rate (Rho = 0.615, p < .001). However, there was no correlation between Δ cardiac output and Δ of any cardiac parameter (data not shown).
Figure 2.
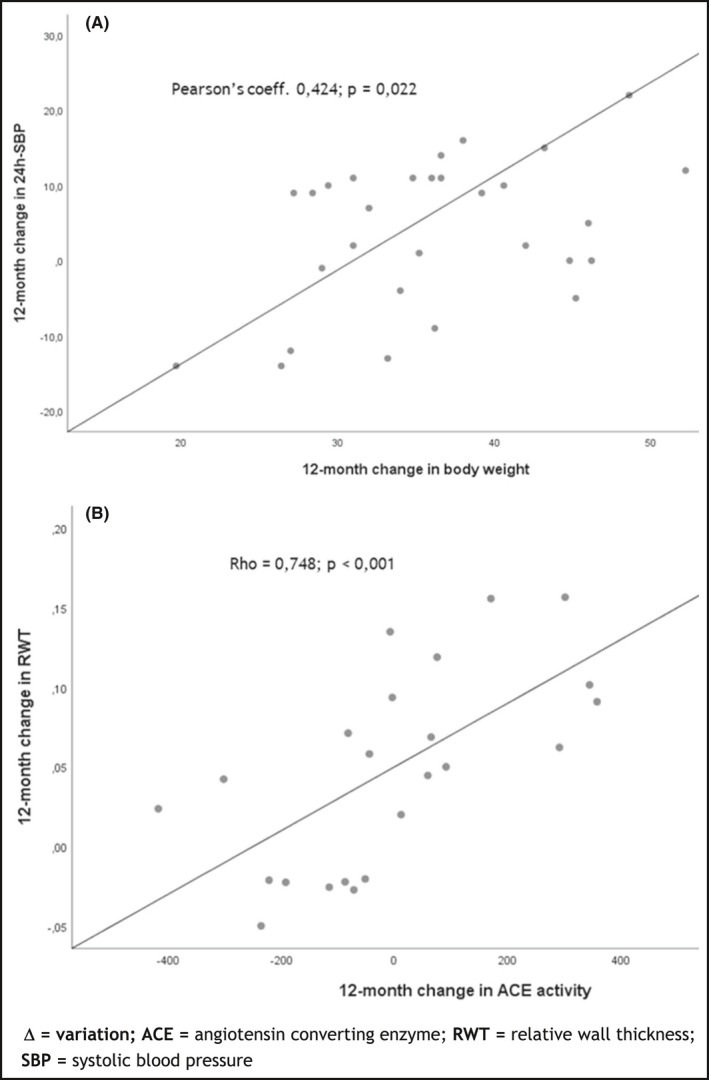
Correlations between variation of BP, body weight, cardiac parameters and renin‐angiotensin aldosterone system. (A) Δ 24 h SBP and Δ body weight; (B) Δ ACE activity and Δ RWT
3.5. Correlations between changes in cytokines and inflammatory markers and cardiac parameters
There was no statistically significant correlation of Δ in any cardiac parameter and changes in measured cytokines and inflammatory markers.
3.6. Correlations between changes in RAAS components and cardiac parameters
Again, because treatment with RAAS blockers influences in RAAS components, we analyzed these correlations only in the subgroup of patients not taking these antihypertensive drugs.
There were some significant correlations between cardiac changes and changes in the RAAS axis. Concretely, Δ ACE activity directly correlated with Δ PWT (Rho = 0.512, p = .009) and with Δ RWT (Rho = 0.748, p < .001) (Figure 2B). In parallel, the Δ ACE/ACE2 ratio also significantly correlated with Δ PWT (Rho = 0.519, p = .008) and with Δ RWT (Rho = 0.635, p = .001). Moreover, Δ PRA correlated with Δ left atrium volume (Rho = 0.454; p = .013). Otherwise, there was no statistically significant correlation between 12‐month Δ PRA or Δ aldosterone and the modification of any other cardiac parameter.
Furthermore, we analyzed if there were differences in these correlations according to the surgical technique, and for all of them, we found statistically significant correlations only in the LRYGB group: Δ ACE activity directly correlated with Δ PWT (Pearson's coeff. = 0.708, p = .007) and with Δ RWT (Pearson's coeff. = 0.761, p < .003). In parallel, Δ ACE/ACE2 correlated with Δ PWT (Pearson's coeff. = 0.824, p = .001) and with Δ RWT (Pearson's coeff. = 0.738, p = .004). Finally, Δ PRA directly correlated with Δ of left atrium volume index in LRYGB group (Rho = 0.700; p = .001). None of these correlations were statistically significant in the LSG group.
When all these correlations were analyzed separately on the basis of having or not sleep apnea syndrome, no difference was observed (data not shown).
4. DISCUSSION
The main finding of this study is that in patients with severe obesity there is a significant improvement in structural and functional cardiac parameters 12 months post‐BS. Importantly, most of these cardiac modifications are also significantly relevant in people who are strictly normotensive at baseline, as confirmed by 24 h ABPM. Our results suggest that changes in several RAAS components are at least partly responsible for the improvement on LV morphology. These changes in RAAS components probably depend on the variation in body weight, so body weight loss is probably responsible of the changes observed in LV structure through modifications in the RAA axis. As for the improvement of the diastolic function of the LV, it seems to be directly related to the variation of body weight per se.
A BMI > 30 kg/m2 is associated with premature atherosclerosis, increased risk of myocardial infarction, heart failure, and decreased survival. 22 Morphologic LV alterations have been previously described in patients with morbid obesity, with a 56% of LVH being reported from a meta‐analysis of 22 studies including 5486 obese individuals. 9 As regards LV systolic function, there are contradictory reports on EF in obese patients, with authors reporting depressed, normal or even supernormal EF values. 23 In our cohort, we have found that 40% of patients had LVH at baseline, almost half of the whole cohort had abnormal RWT, and as regards systolic function 62% had abnormal GLS. Those alterations significantly improved after bariatric surgery as shown in the 12 months follow‐up echocardiographic evaluation. As for LVH and RWT, similar results have been reported by Owan and colleagues 24 at 2 years, while here we show that significant changes occur earlier, at 1 year post‐BS. These authors found that the decreases in LVMI and RWT correlated with BMI reduction, but not with changes in BP. Indeed, one of the most relevant observations of the present BARIHTA study is the finding that even patients with severe obesity with strictly normal BP experience an improvement in morphological and functional LV parameters after BS. Accordingly, changes in PRA and ACE activity are those which better correlate with structural cardiac changes, supporting a more important role than BP per se. Moreover, we have also shown an improvement in cardiac geometry patterns. In addition, there are some parameters as E/e’ ratio, apparently “normal” at baseline, which improve after BS, and these changes correlate with body weight loss. Overall, it appears that the change in body weight is directly responsible for the improvement in diastolic function, while its action on the reduction in morphologic cardiac parameters is mediated by changes in RAAS, whose components have fibrotic actions.
Obesity is an established risk factor for hypertension, 23 and in our cohort, 42% of patients were hypertensives. It had previously been reported that LVH accounts for around 13% of normotensive obese subjects, 25 , 26 and Alpert and colleagues 27 also referred to normotensive obese patients as susceptible to changes in LV function and structure; however, in none of these reports, BP was assessed by 24 h ABPM, a more reliable BP measurement, so the possibility of including patients with masked hypertension, that is, normal office BP but elevated ambulatory BP, cannot be ruled out in them.
As for sleep‐breathing disorders, in the present BARIHTA study 24% of subjects had sleep apnea syndrome and, as others, 28 we found no difference regarding changes in echocardiographic parameters according to this condition.
We found a statistically significant correlation between main changes in cardiac structure and PRA, ACE, and ACE/ACE2 ratio, but not with plasma aldosterone levels, although they showed an overall tendency to decrease. As regards ACE2, its enhanced expression may be protective in diabetes, cardiovascular disease, and cancer and has also been found to be associated with higher risk for silent atherosclerosis. 29 Thus, its decrease after BS may be linked to a decrease in cardiovascular risk. Despite volume expansion and sodium retention, activity of the systemic RAAS appears to be inadvertently increased in obese individuals, taking into account that adipose tissue contains all the components of the RAAS. 30 It is well known that weight loss is associated with reduction of BP and of both PRA and aldosterone levels in obese hypertensive subjects 31 but so far the relationship with changes in cardiac remodeling after BS has not been thoroughly explored, and even less in normotensive patients. Our results suggest that RAAS may link cardiac hypertrophy in obese patients with its improvement after weight loss, although this relationship should be utterly analyzed in depth.
Another observation in the BARIHTA study is that especially those changes related to LV diastolic function are more evident in the group who underwent LRYGP group, probably related to a higher weight loss than in the LSG one.
Finally, we examined the role of several cytokines and inflammatory markers on cardiac changes. Although there was a significant decrease in both leptin and hs‐CRP levels, none of the explored biomarkers appear to be associated with heart improvement.
Our study has some limitations, mainly the sample size. Even though our results suggest a mechanistic relationship, we cannot demonstrate causality. However, it is relevant that when repeating the analyses in the subset of patients not taking RAAS blockers we consistently reproduced the same results. Another weakness is that we have not explored other mechanisms, such as sympathetic nervous system. In this way, Zhang and colleagues 32 showed in an elegant study that with no doubt gastrointestinal surgery inhibited overdrive of the sympathetic nervous system in both hypertensive patients and spontaneously hypertensive rats, although in this study, the RAAS axis was not explored, nor the relationship between both mechanisms, that probably have co‐responsibility in obesity‐associated hypertension. And it would have been desirable to explore the influence of gender on the relationships between RAAS components and cardiac morphology in this setting, but the small, otherwise common representation of male patients in our cohort does not make it possible. On the contrary, there are several relevant strengths. To our knowledge, this is the first report on this issue that evaluates BP with 24 h ABPM, ensuring that patients are really hypertensive or normotensive. This fact has important consequences allowing the establishment of relationships between BP, body weight and cardiac structure and function in a much reliable setting. Also, remarkably, the relative youth of this cohort should be highlighted, which makes the structural changes of the heart have even more value. Another relevant point is that the study of the RAAS includes ACE and ACE2, which adds value to the exploration of pathophysiological pathways on the topic we are addressing here.
We show that 12 months after undergoing BS, patients with severe morbid obesity experience a significant reduction of the structural parameters of the LV, as well as an improvement in LV diastolic function. This improvement in echocardiographic parameters is also highly significant in normotensive patients. Our results suggest that perhaps due to the effect of losing weight on the BP decrease and the consequent changes in RAAS, or due to the direct effect of decreased body weight on RAAS components, the latter may be at least partly responsible for structural heart changes after BS.
In conclusion, we show that body weight loss modifies the RAAS and its complex interactions, which may have a role in cardiac changes after BS, although it deserves further investigations. Reasonably, even in normotensive obese patients, a cardiac ultrasound examination should be performed in order to early detect subtle alterations. Necessarily, research should be done to explore whether normotensive severely obese patients would benefit from receiving RAAS blockers if tolerated.
CONFLICT OF INTEREST
The authors report no conflict.
AUTHOR CONTRIBUTIONS
AO, LS, Ll.M., and AG involved in conceptualization. SV, DB, Ll.M., JM.R., MR, and JP involved in validation. MR, Ll.M., and AO involved in formal analysis. AO, AG, and LS involved in investigation. SV AM.G., Ll.M., JM.R., MR, and AG involved in resources. AG, D.B, and AM.G. involved in data curation. AO involved in writing‐original draft preparation and project administration. AO, Ll.M., MR, AG, DB, and JP involved in writing‐review and editing. DB and JP involved in supervision. AO and JP involved in funding acquisition. All authors have read and agreed to the published version of the manuscript.
Funding information
Research reported in this publication was supported by the Spanish Society of Nephrology and by the Spanish Ministry of Health ISCIII RedinRen RD16/0009/0013. The funders of the study had no role in study design, data collection, data analysis, data interpretation, or writing of the report.
Supporting information
Supplementary Material
ACKNOWLEDGMENTS
We are indebted to Sara Alvarez, Maria Vera, Berta Xargay, Anna Faura, and Tai Mooi Ho (Nephrology Dpt. Hospital del Mar and Hospital del Mar Medical Research Institute, Barcelona, Spain), for their effort and implication in the study. We are also indebted to Xavier Duran (MStat, PhD, Hospital del Mar Medical Research Institute) for his aid in performing the statistical analyses.
Oliveras A, Molina L, Goday A, et al. Effect of bariatric surgery on cardiac structure and function in obese patients: Role of the renin‐angiotensin system. J Clin Hypertens.2021;23:181–192. 10.1111/jch.14129
Clinical Trial Registration—URL:http://www.clinicaltrials.gov.
Unique identifier: NCT03115502
REFERENCES
- 1. Obesity and overweight . Fact Sheet No 311. Geneva, Switzerland: World Health Organization; 2011. www.who.int/mediacentre/factsheets/fs311/en/print.html [Google Scholar]
- 2. Kaila B, Raman M. Obesity: a review of pathogenesis and management strategies. Can J Gastroenterol. 2008;22(1):61‐68. [DOI] [PMC free article] [PubMed] [Google Scholar]
- 3. Murphy NF, MacIntyre K, Stewart S, Hart CL, Hole D, McMurray JJ. Long‐term cardiovascular consequences of obesity: 20‐year follow‐up of more than 15 000 middle‐aged men and women (the Renfrew‐Paisley study). Eur Heart J. 2006;27(1):96‐106. [DOI] [PubMed] [Google Scholar]
- 4. Khan SS, Ning H, Wilkins JT, et al. Association of body mass index with lifetime risk of cardiovascular disease and compression of morbidity. JAMA Cardiol. 2018;3(4):280‐287. [DOI] [PMC free article] [PubMed] [Google Scholar]
- 5. Kenchaiah S, Evans JC, Levy D, et al. Obesity and the risk of heart failure. N Engl J Med. 2002;347(5):305‐313. [DOI] [PubMed] [Google Scholar]
- 6. Ndumele CE, Matsushita K, Lazo M, et al. Obesity and Subtypes of Incident Cardiovascular Disease. J Am Heart Asso. 2016;5:e003921. 10.1161/JAHA.116.003921 [DOI] [PMC free article] [PubMed] [Google Scholar]
- 7. Heneghan HM, Meron‐Eldar S, Brethauer SA, Schauer PR, Young JB. Effect of bariatric surgery on cardiovascular risk profile. Am J Cardiol. 2011;108(10):1499‐1507. [DOI] [PubMed] [Google Scholar]
- 8. Wong CY, O'Moore‐Sullivan T, Leano R, Byrne N, Beller E, Marwick TH. Alterations of left ventricular myocardial characteristics associated with obesity. Circulation. 2004;110(19):3081‐3087. [DOI] [PubMed] [Google Scholar]
- 9. Cuspidi C, Rescaldani M, Sala C, Grassi G. Left‐ventricular hypertrophy and obesity: a systematic review and meta‐analysis of echocardiographic studies. J Hypertens. 2014;32(1):16‐25. [DOI] [PubMed] [Google Scholar]
- 10. Aggarwal R, Harling L, Efthimiou E, Darzi A, Athanasiou T, Ashrafian H. The effects of bariatric surgery on cardiac structure and function: a systematic review of cardiac imaging outcomes. Obes Surg. 2016;26(5):1030‐1040. [DOI] [PubMed] [Google Scholar]
- 11. Cuspidi C, Rescaldani M, Tadic M, Sala C, Grassi G. Effects of bariatric surgery on cardiac structure and function: a systematic review and meta‐analysis. Am J Hypertens. 2014;27(2):146‐156. [DOI] [PubMed] [Google Scholar]
- 12. Oliveras A, Goday A, Sans L, et al. Changes in central 24‐h ambulatory blood pressure and hemodynamics 12 months after bariatric surgery: the BARIHTA Study. Obes Surg. 2020;30(1):195‐205. [DOI] [PubMed] [Google Scholar]
- 13. Franssen PM, Imholz BP. Evaluation of the Mobil‐O‐Graph new generation ABPM device using the ESH criteria. Blood Press Monit. 2010;15(4):229‐231. [DOI] [PubMed] [Google Scholar]
- 14. Lang RM, Badano LP, Mor‐Avi V, et al. Recommendations for cardiac chamber quantification by echocardiography in adults: an update from the American Society of Echocardiography and the European Association of Cardiovascular Imaging. Eur Heart J Cardiovasc Imaging. 2015;16(3):233‐270. [DOI] [PubMed] [Google Scholar]
- 15. Dini FL, Fabiani I, Miccoli M, et al. Prevalence and determinants of left ventricular diastolic dysfunction in obese subjects and the role of left ventricular global longitudinal strain and mass normalized to height. Echocardiography. 2018;35(8):1124‐1131. [DOI] [PubMed] [Google Scholar]
- 16. Marwick TH, Gillebert TC, Aurigemma G, et al. Recommendations on the use of echocardiography in adult hypertension: a report from the European Association of Cardiovascular Imaging (EACVI) and the American Society of Echocardiography (ASE). J Am Soc Echocardiogr. 2015;28(7):727‐754. [DOI] [PubMed] [Google Scholar]
- 17. Vickers C, Hales P, Kaushik V, et al. Hydrolysis of biological peptides by human angiotensin‐converting enzyme‐related carboxypeptidase. J Biol Chem. 2002;277(17):14838‐14843. [DOI] [PubMed] [Google Scholar]
- 18. Riera M, Anguiano L, Clotet S, et al. Paricalcitol modulates ACE2 shedding and renal ADAM17 in NOD mice beyond proteinuria. Am J Physiol Renal Physiol. 2016;310(6):F534‐F546. [DOI] [PubMed] [Google Scholar]
- 19. Schwager SL, Carmona AK, Sturrock ED. A high‐throughput fluorimetric assay for angiotensin I‐converting enzyme. Nat Protoc. 2006;1(4):1961‐1964. [DOI] [PubMed] [Google Scholar]
- 20. Soler MJ, Riera M, Crespo M, et al. Circulating angiotensin‐converting enzyme 2 activity in kidney transplantation: a longitudinal pilot study. Nephron Clin Pract. 2012;121(3–4):c144‐c150. [DOI] [PubMed] [Google Scholar]
- 21. Tucker ON, Szomstein S, Rosenthal RJ. Indications for sleeve gastrectomy as a primary procedure for weight loss in the morbidly obese. J Gastrointest Surg. 2008;12:662‐667. [DOI] [PubMed] [Google Scholar]
- 22. Karimian S, Stein J, Bauer B, Teupe C. Improvement of impaired diastolic left ventricular function after diet‐induced weight reduction in severe obesity. Diabetes Metab Syndr Obes. 2017;10:19‐25. [DOI] [PMC free article] [PubMed] [Google Scholar]
- 23. Abel ED, Litwin SE, Sweeney G. Cardiac remodeling in obesity. Physiol Rev. 2008;88(2):389‐419. [DOI] [PMC free article] [PubMed] [Google Scholar]
- 24. Owan T, Avelar E, Morley K, et al. Favorable changes in cardiac geometry and function following gastric bypass surgery: 2‐year follow‐up in the Utah obesity study. J Am Coll Cardiol. 2011;57(6):732‐739. [DOI] [PMC free article] [PubMed] [Google Scholar]
- 25. Kotsis V, Jordan J, Micic D, et al. Obesity and cardiovascular risk: a call for action from the European Society of Hypertension Working Group of Obesity, Diabetes and the High‐risk Patient and European Association for the Study of Obesity: part A: mechanisms of obesity induced hypertension, diabetes and dyslipidemia and practice guidelines for treatment. J Hypertens. 2018;36(7):1427‐1440. [DOI] [PubMed] [Google Scholar]
- 26. Aurigemma GP, de Simone G, Fitzgibbons TP. Cardiac remodeling in obesity. Circ Cardiovasc Imaging. 2013;6(1):142‐152. [DOI] [PubMed] [Google Scholar]
- 27. Alpert MA, Omran J, Bostick BP. Effects of obesity on cardiovascular hemodynamics, cardiac morphology, and ventricular function. Curr Obes Rep. 2016;5(4):424‐434. [DOI] [PubMed] [Google Scholar]
- 28. Garza CA, Pellikka PA, Somers VK, et al. Structural and functional changes in left and right ventricles after major weight loss following bariatric surgery for morbid obesity. Am J Cardiol. 2010;105(4):550‐556. [DOI] [PubMed] [Google Scholar]
- 29. Anguiano L, Riera M, Pascual J, et al. Circulating angiotensin converting enzyme 2 activity as a biomarker of silent atherosclerosis in patients with chronic kidney disease. Atherosclerosis. 2016;253:135‐143. [DOI] [PubMed] [Google Scholar]
- 30. Lavie CJ, Alpert MA, Arena R, Mehra MR, Milani RV, Ventura HO. Impact of obesity and the obesity paradox on prevalence and prognosis in heart failure. JACC Heart Fail. 2013;1(2):93‐102. [DOI] [PubMed] [Google Scholar]
- 31. Dall'Asta C, Vedani P, Manunta P, et al. Effect of weight loss through laparoscopic gastric banding on blood pressure, plasma renin activity and aldosterone levels in morbid obesity. Nutr Metab Cardiovasc Dis. 2009;19(2):110‐114. [DOI] [PubMed] [Google Scholar]
- 32. Zhang H, Pu Y, Chen J, et al. Gastrointestinal intervention ameliorates high blood pressure through antagonizing overdrive of the sympathetic nerve in hypertensive patients and rats. J Am Heart Assoc. 2014;3(5):e000929. 10.1161/JAHA.114.000929 [DOI] [PMC free article] [PubMed] [Google Scholar]
Associated Data
This section collects any data citations, data availability statements, or supplementary materials included in this article.
Supplementary Materials
Supplementary Material