To the Editor,
We thank Visarial et al 1 for raising several valid points. The primary objective of our article titled “Relationship between dietary sodium and sugar intake: A cross‐sectional analysis of the NHANES 2001‐2016” was to characterize diets in subjects from a large database relative to sodium intake in order to address the controversy surrounding the J‐shaped relationship between sodium intake and cardiovascular outcomes. 2 Several trends were noted in this study but the most meaningful and capable of explaining the reported J‐shaped association was the negative association between dietary sodium and sugar intake. Although a similar trend was found between sodium and carbohydrate intake, a similar conclusion could not be drawn. A meaningful classification of carbohydrates that might have more physiologic relevance in dietary studies includes dietary fiber content, processing, and whole grain content, as well as fructose and other sugars, which have a different impact on digestion and glycemic response as well as cardiometabolic risk. 3 , 4 Therefore, and unlike sugar, the significant trend found between carbohydrate and sodium intake in our study could not explain this J‐shaped association. Moreover, it is important to note that finding a statistically significant association between dietary constituents in this study does not imply causation and is at best, hypothesis generating.
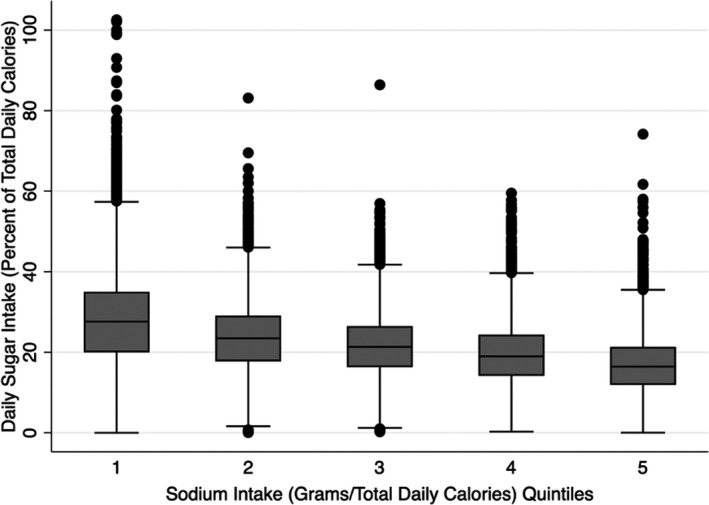
In this report, we standardized calorie intake to 2000 Kcal in order to avoid potential biases related to reverse causation and effect of physical activity and frailty on total daily calorie intake that are likely to be present when studying a large database. Furthermore, multiple linear regression was used to simultaneously adjust for age, sex, body mass index (BMI), race/ethnicity, physical activity, smoking, hypertension, diabetes, coronary artery disease, congestive heart failure, glycosylated hemoglobin, and season in an effort to further attenuate reverse causation bias that can potentially affect both sodium and sugar intakes. We agree that the relationship between macronutrients when standardizing diets to calorie intake of 2000 Kcal would better be served by comparing percentages of calorie from each macronutrient rather than the amount in grams; however, in our analysis we examined the macronutrients relative to quintiles of sodium which has no contribution to total caloric intake. Therefore, we would expect the same trend regardless of the unit of measurement used for each nutrient. Both, Figure 1 and Table 1, essentially show the same trend when percentages of calorie from nutrients are used instead of the gram amounts.
Figure 1.

Boxplot showing the association between quintiles of sodium intake as a percent of total daily calories and reported 24‐h sugar intake as percent of total daily calories. Percent sugar calorie intake was significantly higher in SQ1 and SQ2 and significantly lower in SQ4 and SQ5 compared to the average sodium intake of SQ3 all p < .01). SQ, sodium quintile
Table 1.
Unadjusted and adjusted mean daily sugar intake (percent of total calories) by sodium intake (gm/day/total calories)
| Sodium Group |
Unadjusted Coefficient (95% CI) |
p value |
Adjusted Coefficient a (95% CI) |
p value |
|---|---|---|---|---|
| Quintile 1 | 6.5 (6.0 to 7.0) | <.001 | 6.2 (5.7 to 6.7) | <.001 |
| Quintile 2 | 2.0 (1.6 to 2.4) | <.001 | 1.8 (1.4 to 2.2) | <.001 |
| Quintile 3 | 0 (Ref) | N/A | 0 (Ref) | N/A |
| Quintile 4 | −2.1 (−1.8 to −2.5) | <.001 | −2.1 (−1.8 to −2.5) | <.001 |
| Quintile 5 | −4.6 (−4.3 to −4.9) | <.001 | −4.4 (−4.1 to −4.8) | <.001 |
Adjusted for age, gender, race/ethnicity, body mass index, physical activity, smoking, diabetes mellitus, hypertension, congestive heart failure, coronary artery disease, glycosylated hemoglobin, and season.
Finally, this work calls for comprehensive dietary assessment in future dietary studies to examine relationships between the overall diet, including its constituent foods, beverages, nutrients and micronutrients, and cardiovascular and general health outcomes rather than focusing on one nutrient each time.
CONFLICT OF INTEREST
The authors declare they have no competing interest with the current work.
Khitan ZJ, Tzamaloukas AH, Shapiro JI, Gress TW. Response to: Visaria et al. Everything in moderation: Understanding the interplay between salt and sugar intake.. J Clin Hypertens. 2020;22:2387–2388. 10.1111/jch.14085
REFERENCES
- 1. Visaria A, Shahani J, Shah M, Modak A, Chilakapati R. Everything in moderation: understanding the interplay between salt and sugar intake. JCH‐20‐0534. [DOI] [PMC free article] [PubMed]
- 2. Gress TW, Mansoor K, Rayyan YM, et al. Relationship between dietary sodium and sugar intake: a cross‐sectional study of the National Health and Nutrition Examination Survey 2001–2016. J Clin Hypertens (Greenwich). 2020;22(9):1694‐1702. [DOI] [PMC free article] [PubMed] [Google Scholar]
- 3. Mozaffarian D. Dietary and policy priorities for cardiovascular disease, diabetes, and obesity: a comprehensive review. Circulation. 2016;133(2):187‐225. [DOI] [PMC free article] [PubMed] [Google Scholar]
- 4. Khitan Z, Kim DH. Fructose: a key factor in the development of metabolic syndrome and hypertension. J Nutr Metab. 2013;2013:682673. [DOI] [PMC free article] [PubMed] [Google Scholar]


