Abstract
We evaluated the diagnostic value of atrial fibrillation (AF) measured by a wrist‐type pulse wave monitor in this case‐control study. Six serial pulse wave values (three in the left and three in the right wrist) were measured using a wrist‐type monitor in 29 AF patients and 30 subjects with sinus rhythm. We defined “monitor AF in irregular pulse peak (IPP) 15/20/25” as follows: (a) IPP: |interval of pulse peak − the average of the interval of the pulse peak| ≥ the average of the interval of the pulse peak × 15/20/25%; (b) irregular heartbeat (IHB): beats of IPP ≥ total pulse × 20%; and (c) monitor AF: ≥4 IHBs of the six pulse wave measurements. In IPP 15, the sensitivity and specificity were 0.97 and 1.00, respectively. Pulse wave analysis by a wrist‐type monitor was shown to have high sensitivity and specificity for the diagnosis of AF.
Keywords: atrial fibrillation, hypertension, pulse wave
1. INTRODUCTION
Atrial fibrillation (AF) is a common disease whose incidence increases with age1, 2, 3 and is a major risk factor for stroke and thrombosis.4, 5, 6 Hypertension increases the risk of thrombosis,7, 8 and the prevalence of hypertension is high.9, 10, 11, 12
Paroxysmal AF is often asymptomatic, and the prognosis of asymptomatic AF is worse than that of symptomatic AF.13 AF can be detected by self‐examination of pulse,14 but the accuracy of this approach is dependent on the skill of the patient.
Recent studies have reported the usefulness of a wrist‐type monitor that uses a fingertip or thumb‐on method to detect AF.15, 16, 17 As an alternative approach, we recently developed a wrist‐type pulse wave monitor to detect AF.18, 19 In this study, we evaluate the usefulness of our wrist‐type pulse wave monitor for diagnosing AF.
2. METHODS
We enrolled 29 outpatients with AF and 30 outpatients with sinus rhythm. Electrocardiography (ECG) showed AF during all six pulse wave measurements in the AF subjects and sinus rhythm during all six measurements in the 30 subjects with sinus rhythm.
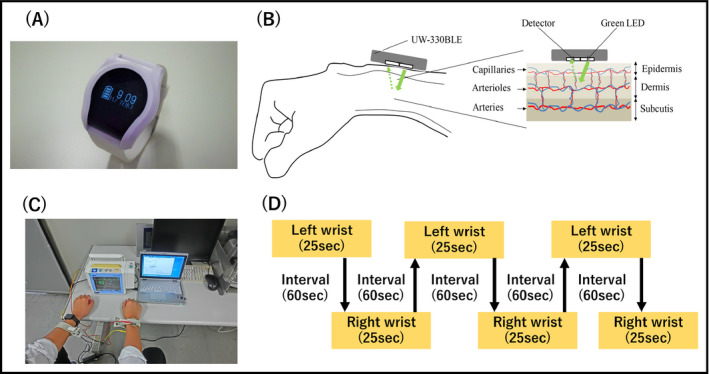
For each subject, six pulse wave measurements (25 seconds) were taken at 60‐second intervals in the sitting position (alternating the left and right wrists, for a total of 3 left and 3 right wrist measurements), using a wrist‐type pulse wave monitor (UW‐330BLE; A&D; Figure 1A,B). We confirmed the concordance between the interval of the pulse wave and QRS wave in the ECG in all patients (total 1180 beats; Figure 1C). We evaluated the accuracy of the AF detection algorithm separately for the left and right wrist (Figure 1D).
Figure 1.

The measurement of pulse wave. A, A wrist‐type pulse wave monitor (UW‐330BLE; A&D), B, photoplethysmography, C, real measurement of pulse wave and electrocardiogram, D, protocol of this study
2.1. Photoplethysmography
Photoplethysmography (PPG) is an optical measurement technique that can be used to detect blood volume changes in the microvascular bed of the tissue.20 It is a noninvasive method that makes measurements at the surface of the skin.
The PPG sensor system consists of green light‐emitting diodes and photodetectors. Light traveling though biological tissue can be absorbed by different substances, including pigments in the skin, bone, arteries, and veins. Changes in blood flow occur mainly in the arteries.21 For example, the arteries contain more blood volume during the systolic phase of the cardiac cycle than during the diastolic phase. Photoplethysmography sensors optically detect changes in the blood flow volume in the microvascular bed of tissue via reflection from or transmission through the tissue. The PPG waveform features of the peripheral pulse were synchronized to each heartbeat. Undersensing and oversensing of the pulse waves were observed in 2.6% and 1.4% of the total beats in patients with sinus rhythm (11 800 beats), and 11.6% and 1.5% of the total beats in AF patients (13 440 beats).
2.2. AF detection algorithm
The interval of pulse waves was analyzed, and the average pulse wave interval was calculated in 6 measurements (3 measurements each for the left and right wrist). We defined “monitor AF in irregular pulse peak (IPP) 15/20/25” as follows: (a) IPP: |interval of pulse wave – the average of the interval of the pulse wave| ≥ the average of the interval of the pulse wave × 15/20/25%; (b) irregular heartbeat (IHB): beats of IPP ≥ total pulse × 20%; and (c) the “monitor AF (IPP 15/20/25)”: ≥ 4 IHBs of the six pulse wave measurements according to a past report.22
Simultaneously during the deflation phase of each pulse wave measurement (when the AF detector of the device was operating), the ECG was recorded continuously in the I lead (Figure 1C). We confirmed the concordance between the interval of the pulse wave and QRS wave in the ECG in all patients (total 1180 beats).
2.3. Ethical issues
The internal review board of the Jichi Medical University School of Medicine approved this study. Written informed consent for the study was obtained individually from all of the subjects.
2.4. Statistical analysis
Data are shown as the mean ± SD or a percentage. Student's t test was used to analyze the continuous data of the sinus rhythm and AF patients. Comparisons of parameters among the groups were made using the chi‐square test. The association between the RR interval in ECG and the pulse wave interval in the wrist‐type monitor was assessed using Pearson's correlation coefficient and a Bland‐Altman graph. The sensitivity, specificity, and kappa statistic for the AF diagnosis were assessed for each of the individual measurements made by the monitor. SPSS version 20.0 software (IBM Inc) was used for the statistical analysis. A probability value <0.05 was considered statistically significant.
3. RESULTS
The clinical characteristics of the AF patients and sinus rhythm subjects are summarized in Table 1. The ages, gender distributions, CHADS2 score, and CHA2DS2‐VASc score of the two groups were similar.
Table 1.
Patient characteristics
| Sinus rhythm (N = 30) | Atrial fibrillation (N = 29) | P | |
|---|---|---|---|
| Age (y) | 67.7 ± 8.0 | 66.5 ± 12.2 | .67 |
| Men (%) | 70.0 | 72.4 | .84 |
| Hypertension (%) | 50.0 | 37.9 | .19 |
| Diabetes (%) | 6.7 | 6.9 | .95 |
| Stroke (%) | 3.3 | 3.5 | .96 |
| Vascular disease | 6.7 | 10.3 | .32 |
| CHADS2 score | 0.9 ± 0.8 | 1.1 ± 0.9 | .37 |
| CHA2DS2‐VASc score | 2.0 ± 1.4 | 2.1 ± 1.3 | .78 |
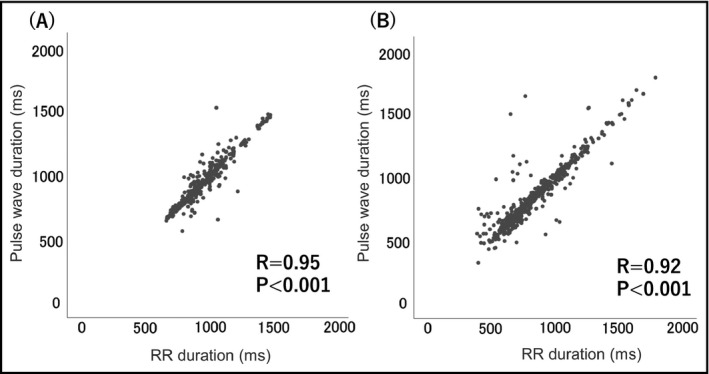
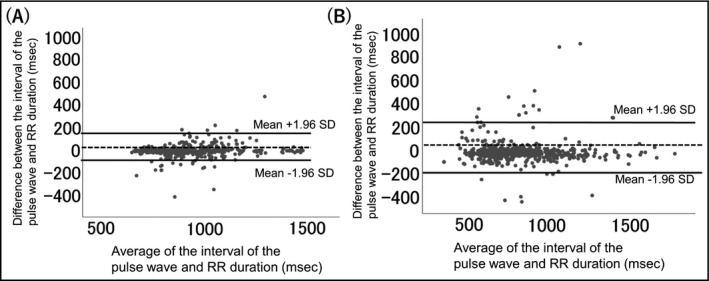
The association between the pulse wave interval in the wrist‐type monitor and the RR interval in ECG is demonstrated in Figure 2. The pulse wave interval was strongly associated with the RR interval in patients with sinus rhythm (R = 0.95, P < .001). Figure 3 is the Bland‐Altman plot of the pulse wave interval and the RR interval in ECG. Even in AF patients, more than 95% of the values were within average ± 1.96SD.
Figure 2.

The association between the interval of the pulse wave and heart rate. A, Patients with sinus rhythm, B, patients with atrial fibrillation
Figure 3.

Bland‐Altman plot of the interval of the pulse wave and heart rate values. SD: standard deviation. A, Patients with sinus rhythm, B, patients with atrial fibrillation
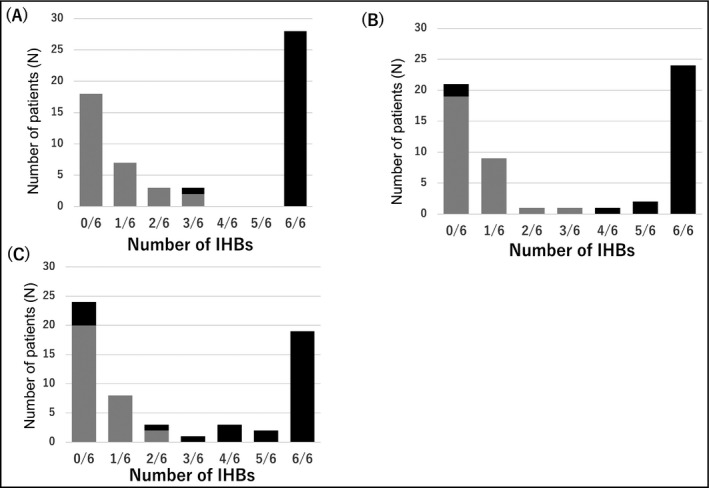
The distribution of IHBs in the 6 measurements is shown in Figure 4. We defined monitor AF as more than 4 IHBs of 6 measurements (ie, 4/6, 5/6, or 6/6).
Figure 4.

The distribution of sinus rhythm and atrial fibrillation according to the number of IHBs of three measurements. A, IPP 15%, B, IPP 20%, C, IPP 25%. Black bars = patients with atrial fibrillation; gray bars = sinus rhythm patients. IHB, irregular heartbeat; IPP, irregular pulse peak
The accuracy for detecting AF was as follows (Table 2). The sensitivity and specificity were 0.97 and 1.00 in IPP 15, and the sensitivity and specificity were 0.93 and 1.00 in IPP 20. In IPP 25, the specificity was also 1.00, but the sensitivity was relatively low (0.79). The positive predictive value was 1.00 in IPP 15, 20, and 25. The negative predictive value was 0.97 in IPP 15, 0.94 in IPP 20, and 0.83 in IPP 25 (Table 2).
Table 2.
Accuracy of the monitor for diagnosing AF
| Threshold | Monitor AF + / Monitor AF – | Sensitivity | Specificity | Positive predictive value | Negative predictive value | Kappa |
|---|---|---|---|---|---|---|
| (A) Patients (N = 59) | ||||||
| IPP 15% | 28/31 | 0.97 | 1.00 | 1.00 | 0.97 | 0.97 |
| IPP 20% | 27/32 | 0.93 | 1.00 | 1.00 | 0.94 | 0.93 |
| IPP 25% | 23/36 | 0.79 | 1.00 | 1.00 | 0.83 | 0.80 |
| Threshold | IHB + / IHB – | Sensitivity | Specificity | Positive predictive value | Negative predictive value | Kappa |
|---|---|---|---|---|---|---|
| (B) Measurements (N = 354) | ||||||
| IPP 15% | 190/164 | 0.92 | 0.83 | 0.84 | 0.91 | 0.75 |
| IPP 20% | 172/182 | 0.91 | 0.92 | 0.92 | 0.91 | 0.83 |
| IPP 25% | 147/207 | 0.78 | 0.93 | 0.92 | 0.81 | 0.71 |
Abbreviations: AF, atrial fibrillation; IHB, irregular heart beat; IPP, irregular pulse peak.
We also evaluated the diagnostic accuracy of the IHB value for AF (354 measurements; AF: 174 measurements, sinus rhythm: 180 measurements). In IPP 15, the sensitivity and specificity were 0.92 and 0.83, and in IPP 20, the sensitivity and specificity were 0.91 and 0.92. In IPP 25, the specificity was 0.93, but the sensitivity was relatively low (0.78, Table 2).
4. DISCUSSION
Pulse wave analysis of wrist‐type monitor was preciously reflected RR duration of ECG. The IPP 15 and IPP 20 algorithms exhibited more than 90% sensitivity and more than 90% specificity for the diagnosis of AF.
We evaluated the accuracy of pulse wave measurement with the wrist‐type monitor for the diagnosis of AF. The association between the pulse wave of the wrist‐type monitor and the RR duration of ECG was good. We previously confirmed the diagnostic value of the AF algorithm using a home blood pressure monitor,22 and here we found that pulse wave analysis using the wrist‐type monitor also had good diagnostic value for AF. The wrist‐type monitor is mobile and easy to carry. The frequency of onset of paroxysmal AF has diurnal variation.23 In the elderly, AF onset occurs predominantly in the daytime in response to autonomic functions.24, 25 The wrist‐type monitor is useful to detect AF during daytime and might be especially useful for elderly patients. Many patients with AF symptoms will be able to activate the wrist‐type monitor themselves. In addition, it might be possible to diagnose paroxysmal AF by activating the wrist‐type monitor at the appearance of symptoms.
In our experiments, the IPP 15 and IPP 20 algorithms achieved more than 90% sensitivity and more than 90% specificity for the diagnosis of AF. In past reports using a mobile AF monitor, the sensitivity was 93% and the specificity was 84% using an Apple watch with a Kardia band,15 the sensitivity was 93.1% and the specificity was 90.9% using an iPhone with finger pulse,16 and the sensitivity was 94.7% and the specificity was 93% using fingertip PPG.17 We achieved a high rate of detection of AF using an algorithm that considers 2 of the 3 available measurements in order to increase the specificity according to the method described in our previous report.22 The pulse wave may be disturbed by body motion, and AF may cause pulse deficits; thus, the RR interval and the pulse wave interval are not completely coincident. However, in our sinus rhythm patients, pulse wave analysis using a wrist‐type monitor was well reflected the RR duration of ECG. For patients with a low fluctuation of pulse wave by the wrist‐type monitor, our algorithm can still calculate a sinus rhythm with high accuracy.
Several methods are available for the detection of asymptomatic AF: pulse palpitation, standalone ECG recording devices, smartphone‐based ECG recording devices, smartphone‐based PPG, and BP monitors with an AF detection algorithm.26 Our device is similar to the smartphone‐based PPG and BP monitor with an AF detection algorithm. The PPG method usually requires that the patient places a finger in contact with the smartphone camera.27 In this study, we did not equip our device with a screen for displaying the data, but we currently developing a screen that will be incorporated into the wrist band. By changing the wave form and position, we will be able to measure blood pressure by using the wrist band. In the future, further improvements to the wrist‐type blood pressure monitor may lead to dramatically better detection of blood pressure variability than by an ambulatory blood pressure monitor, and it can be applied to information technology.18, 19 If this algorithm could be incorporated into the wrist‐type blood pressure monitor, it would be able to detect AF earlier and could help to improve the prognosis of hypertensive patients. This device in this study was wearable and hence may be useful in a mass screening.
The main limitation of this study was that arrhythmias other than AF were not included. Healthy subjects with an irregular heart rhythm (ie, sinus arrhythmia), and frequent premature cardiac beats might be misdiagnosed with AF. The characteristics of AF are pulse irregularity and pulse loss. We have previously considered that irregularity of pulse, but not heartbeat, is a useful diagnostic tool for AF. However, to reduce the false‐positive rate and evaluate the diagnostic value and accuracy of these parameters for AF, further studies including arrhythmias other than AF will be needed to further evaluate the AF detection algorithm of the wrist‐type monitor. In the AF group, when the RR duration was short (ie, when tachycardia was present), the discrepancy between the RR duration and pulse wave seemed to be larger. Tachycardia might thus result in undersensing of pulse. Also, although we did not measure the wrist circumference, larger wrist circumference could have resulted in less accurate measurement. Body motion artifacts could have affected the oversensing and undersensing of pulse waves. Finally, this study was a case‐control study with a very small number of cases. Further prospective studies with a larger number of enrolled subjects will be needed to evaluate the diagnostic value of this device.
5. CONCLUSIONS
Pulse wave analysis by a wrist‐type monitor was in good agreement with the RR duration by electrocardiography, and the IPP 15 and IPP 20 algorithms had high sensitivity and high specificity for the diagnosis of AF.
CONFLICT OF INTEREST
K Kario received research grants from A&D Company Limited; N Yasui, S Takahashi, and K Uemoto are employees of A&D Company Limited; and all other authors report no potential conflict of interest in relation to this article.
DISCLOSURES
This study was conducted as a joint research between Jichi Medical University School of Medicine and A&D Company, Limited.
AUTHOR CONTRIBUTION
T. Kabutoya and K. Kario conceived and designed the study; analyzed and interpreted the data. T. Kabutoya, S. Takahashi, T. Watanabe, Y. Imai, K. Uemoto, N. Yasui, K. Kario drafted the manuscript or critically revised for important intellectual content; approved the final version of the submitted manuscript.
ACKNOWLEDGMENT
We gratefully acknowledge Ms Kimiyo Saito and Ms Naoko Tomitani for their coordination and data management of this study.
Kabutoya T, Takahashi S, Watanabe T, et al. Diagnostic accuracy of an algorithm for detecting atrial fibrillation in a wrist‐type pulse‐wave monitor. J Clin Hypertens. 2019;21:1393–1398. 10.1111/jch.13648
Funding information
This study was partly supported by the IMpulsing PAradigm Change through disruptive Technologies (IMPACT) program of the Cabinet Office, Government of Japan.
REFERENCES
- 1. Majeed A, Moser K, Carroll K. Trends in the prevalence and management of atrial fibrillation in general practice in England and Wales, 1994–1998: analysis of data from the general practice research database. Heart. 2001;86:284‐288. [DOI] [PMC free article] [PubMed] [Google Scholar]
- 2. Go AS, Hylek EM, Phillips KA, et al. Prevalence of diagnosed atrial fibrillation in adults: national implications for rhythm management and stroke prevention: the AnTicoagulation and Risk Factors in Atrial Fibrillation (ATRIA) Study. JAMA. 2001;285:2370‐2375. [DOI] [PubMed] [Google Scholar]
- 3. Heeringa J, van der Kuip D, Hofman A, et al. Prevalence, incidence and lifetime risk of atrial fibrillation: the Rotterdam study. Eur Heart J. 2006;27:949‐953. [DOI] [PubMed] [Google Scholar]
- 4. Wolf PA, Abbott RD, Kannel WB. Atrial fibrillation as an independent risk factor for stroke: the Framingham Study. Stroke. 1991;22:983‐988. [DOI] [PubMed] [Google Scholar]
- 5. Benjamin EJ, Wolf PA, D'Agostino RB, Silbershatz H, Kannel WB, Levy D. Impact of atrial fibrillation on the risk of death: the Framingham Heart Study. Circulation. 1998;98:946‐952. [DOI] [PubMed] [Google Scholar]
- 6. Healey JS, Oldgren J, Ezekowitz M, et al. Occurrence of death and stroke in patients in 47 countries 1 year after presenting with atrial fibrillation: a cohort study. Lancet. 2016;388:1161‐1169. [DOI] [PubMed] [Google Scholar]
- 7. Benjamin EJ, Levy D, Vaziri SM, D'Agostino RB, Belanger AJ, Wolf PA. Independent risk factors for atrial fibrillation in a population‐based cohort. The Framingham Heart Study. JAMA. 1994;271:840‐844. [PubMed] [Google Scholar]
- 8. Gage BF, Waterman AD, Shannon W, Boechler M, Rich MW, Radford MJ. Validation of clinical classification schemes for predicting stroke: results from the National Registry of Atrial Fibrillation. JAMA. 2001;285:2864‐2870. [DOI] [PubMed] [Google Scholar]
- 9. Kannel WB, Abbott RD, Savage DD, McNamara PM. Epidemiologic features of chronic atrial fibrillation: the Framingham study. N Engl J Med. 1982;306:1018‐1022. [DOI] [PubMed] [Google Scholar]
- 10. AFFIRM investigators . Baseline characteristics of patients with atrial fibrillation: the AFFIRM Study. Am Heart J. 2002;143:991‐1001. [DOI] [PubMed] [Google Scholar]
- 11. Atarashi H, Inoue H, Okumura K, et al. Present status of anticoagulation treatment in Japanese patients with atrial fibrillation: a report from the J‐RHYTHM Registry. Circ J. 2011;75:1328‐1333. [DOI] [PubMed] [Google Scholar]
- 12. Suzuki S, Yamashita T, Otsuka T, et al. Recent mortality of Japanese patients with atrial fibrillation in an urban city of Tokyo. J Cardiol. 2011;58:116‐123. [DOI] [PubMed] [Google Scholar]
- 13. Esato M, Chun Y‐H, An Y, et al. Clinical impact of asymptomatic presentation status in patients with paroxysmal and sustained atrial fibrillation: the Fushimi AF Registry. Chest. 2017;152:1266‐1275. [DOI] [PubMed] [Google Scholar]
- 14. Munschauer FE 3rd, Sohocki D, Smith Carrow S, Priore RL. A community education program on atrial fibrillation: implications of pulse self‐examination on awareness and behavior. J Stroke Cerebrovasc Dis. 2004;13:208‐213. [DOI] [PubMed] [Google Scholar]
- 15. Bumgarner JM, Lambert CT, Hussein AA, et al. Smartwatch algorithm for automated detection of atrial fibrillation. J Am Coll Cardiol. 2018;71:2381‐2388. [DOI] [PubMed] [Google Scholar]
- 16. Rozen G, Vaid J, Hosseini SM, et al. Diagnostic accuracy of a novel mobile phone application for the detection and monitoring of atrial fibrillation. Am J Cardiol. 2018;121:1187‐1191. [DOI] [PubMed] [Google Scholar]
- 17. Yan BP, Lai W, Chan C, et al. Contact‐free screening of atrial fibrillation by a smartphone using facial pulsatile photoplethysmographic signals. J Am Heart Assoc. 2018;7(8):e008585. [DOI] [PMC free article] [PubMed] [Google Scholar]
- 18. Kario K, Tomitani N, Kanegae H, et al. Development of a new ICT‐based multisensor blood pressure monitoring system for use in hemodynamic biomarker‐initiated anticipation medicine for cardiovascular disease: the National IMPACT Program Project. Prog Cardiovasc Dis. 2017;60:435‐449. [DOI] [PubMed] [Google Scholar]
- 19. Kario K, Tomitani N, Kanegae H, Yasui N, Nagai R, Harada H. The further development of out‐of‐office BP monitoring: Japan's ImPACT Program Project's achievements, impact, and direction. J Clin Hypertens (Greenwich). 2019;21(3):344‐349. [DOI] [PMC free article] [PubMed] [Google Scholar]
- 20. Allen J. Photoplethysmography and its application in clinical physiological measurement. Physiol Meas. 2007;28:R1‐R39. [DOI] [PubMed] [Google Scholar]
- 21. Tamura T, Maeda Y, Sekine M, Yoshida M. Wearable photoplethysmographic sensors‐past and present. Electronics. 2014;3:282‐302. [Google Scholar]
- 22. Kabutoya T, Imai Y, Hoshide S, Kario K. Diagnostic accuracy of a new algorithm to detect atrial fibrillation in a home blood pressure monitor. J Clin Hypertens (Greenwich). 2017;19:1143‐1147. [DOI] [PMC free article] [PubMed] [Google Scholar]
- 23. Yamashita T, Murakawa Y, Sezaki K, et al. Circadian variation of paroxysmal atrial fibrillation. Circulation. 1997;96:1537‐1541. [DOI] [PubMed] [Google Scholar]
- 24. Yamashita T, Murakawa Y, Hayami N, et al. Relation between aging and circadian variation of paroxysmal atrial fibrillation. Am J Cardiol. 1998;82:1364‐1367. [DOI] [PubMed] [Google Scholar]
- 25. Bettoni M, Zimmermann M. Autonomic tone variations before the onset of paroxysmal atrial fibrillation. Circulation. 2002;105:2753‐2759. [DOI] [PubMed] [Google Scholar]
- 26. Zungsontiporn N, Link MS. Newer technologies for detection of atrial fibrillation. BMJ. 2018;363:k3946. [DOI] [PubMed] [Google Scholar]
- 27. Chan P‐H, Wong C‐K, Poh YC, et al. Diagnostic performance of a smartphone‐based photoplethysmographic application for atrial fibrillation screening in a primary care setting. J Am Heart Assoc. 2016;5(7):e003428. [DOI] [PMC free article] [PubMed] [Google Scholar]


