

Abstract
This systematic literature review and meta‐analysis examined whether 24‐hour diet recall is a valid way to measure mean population sodium intake compared with the gold standard 24‐hour urinary assessment. The authors searched electronic databases MEDLINE, Embase, and Scopus using pre‐defined terms. Studies were eligible for inclusion if they assessed adult humans in free‐living settings, and if they included group means for 24‐hour diet recall and 24‐hour urinary collection of sodium intake in the same participants. Studies that included populations with an active disease state that might interfere with normal sodium metabolism were excluded. Results of 28 studies are included in the meta‐analysis. Overall, 24‐hour diet recall underestimated population mean sodium intake by an average of 607 mg per day compared to the 24‐hour urine collection. The difference between measures from 24‐hour urine and 24‐hour diet recall was smaller in studies conducted in high‐income countries, in studies where multiple‐pass methods of 24‐hour diet recall were reported and where urine was validated for completeness. Higher quality studies also reported smaller differences between measures than lower quality studies. Monitoring of population sodium intake with 24‐hour urinary excretion remains the most accurate method of assessment. Twenty‐four‐hour diet recall tends to underestimate intake, although high‐quality 24‐hour diet recall improves accuracy, and may be used if 24‐hour urine is not feasible.
Keywords: diet surveys, dietary sodium, urine specimen collection
1. BACKGROUND
Non‐communicable diseases (NCDs) are responsible for over 70% of global deaths.1 The World Health Organization (WHO) Global Action Plan for the reduction of non‐communicable disease 2013‐2020 has identified reducing mean population salt intake by 30% by 2025 as one of nine priority voluntary global targets for NCD reduction.2 This is due to the well‐documented positive association between sodium intake and blood pressure,3 as well as the evidence that links high salt intakes directly with cardiovascular outcomes including stroke and myocardial infarction.3, 4, 5, 6
WHO recommends a mean population sodium intake for adults of <2000 mg/d (equivalent to 5 g salt per day), with lower intakes for children proportional to energy intake.3 Recent estimates of intakes around the world are substantially higher. For example, in 2010 global mean sodium intake was estimated to be 3950 mg/d (95% uncertainty interval: 3890‐4010 mg/d).7
Essential to the WHO recommendation is the measurement and monitoring of population sodium intake over time. Countries must assess population sodium intake in representative samples of adults, with sufficient numbers to ensure precision of estimates across the population and in population subgroups. Sodium intakes may vary by age and sex,8, 9 and other population groups may have different levels due to different dietary patterns.10 Once a baseline has been established, monitoring to assess progress against the WHO target is also essential to assess the effectiveness of public health sodium reduction interventions. While some countries have measured intakes in representative samples using 24‐hour urine collections,9, 11, 12, 13 many countries conduct regular health and nutrition surveys using 24‐hour diet recall to assess dietary intakes. To enhance recall in 24‐hour diet recall, many researchers use multiple‐pass methods that involve several stages of review of recall data, often involving specific cues to help participants remember intakes. The US Department of Agriculture Multiple‐Pass Method is a 5‐step interview that includes reference to frequently forgotten foods as one of the stages of review.14
To assess average sodium intake in a population, it is recommended to use single 24‐hour urine collections in randomly selected individuals over a series of days that reflect the usual population dietary pattern.15 Many surveys also use repeat assessments in a subsample to assess day‐to‐day variability in individuals. On average, around 90% of ingested sodium is excreted in a 24‐hour urine.16 Our previous systematic review indicates that 24‐hour diet recall is not an accurate measure of usual sodium intake for individuals, compared to 24‐hour urine collection.17 Here, we aim to describe the degree to which 24‐hour diet recall is suitable for estimating population mean sodium intakes compared to 24‐hour urinary assessment for population evaluation and monitoring purposes.
This paper was commissioned by the TRUE (International Consortium for Quality Research on Dietary Sodium/Salt) consortium. The mandate of the TRUE consortium is to develop minimum standards for clinical and epidemiological research on dietary salt. Member organizations of the TRUE consortium include the American Heart Association, the British and Irish Hypertension Society, the Chinese Regional Office of the World Hypertension League, Hypertension Canada, the International Association of National Public Health Institutes, the International Council of Cardiovascular Prevention and Rehabilitation, the International Society of Hypertension, the International Society of Nephrology, the Journal of Clinical Hypertension, the World Health Organization Collaborating Centre for Population Salt Reduction, and the Technical Advisory Group to mobilize cardiovascular disease prevention through dietary salt control policies and interventions of the Pan American Health Organization/World Health Organization, the World Hypertension League, and the World Stroke Organization.
2. METHODS
2.1. Search strategy
The electronic databases MEDLINE (1946 to present), Embase (1947 to present), and Scopus were searched in July 2018, using pre‐defined terms: 384 duplicates were removed. Two authors (RM and EB) independently reviewed the titles and abstracts of all 3187 articles identified and matched these with pre‐defined eligibility criteria (see below). Any discrepancies were discussed, and either consensus was achieved or articles were included in the full‐text review. Both reviewers then independently reviewed the full text of potentially eligible articles. Titles, abstracts and full‐text articles published in languages other than English were translated. Discrepancies were discussed with a third author (CC) and consensus achieved for final eligible studies. Reference lists of included studies were hand‐searched for additional articles not identified in the database search, and enquiries were made with co‐authors and academic colleagues to identify further potentially eligible studies.
2.2. Eligibility criteria
Studies were eligible for inclusion if they were available in full text and assessed dietary sodium intake in adult humans in free‐living settings. Eligible studies included both 24‐hour urine collection and 24‐hour diet recall in the same participants in the same time period. Studies that collected urine samples for less than 24 hours were excluded. Also, the studies needed to report mean (and standard deviation) sodium for 24‐hour urine and 24‐hour diet recall or measures that could be converted to a mean and standard deviation.
Feeding studies and studies where diet was controlled by investigators were excluded. There were no restrictions on language or study sample size. Studies that included children or participants who were pregnant (without separate analysis) were excluded, as were studies including participants with an active disease state likely to interfere with normal sodium metabolism (eg, renal failure, heart failure).
2.3. Data extraction
A data extraction form was developed and piloted by RM and CC. The data extracted were author name, country, publication year, study design (cross‐sectional or intervention), age of participants, sex of participants, health status of participants, whether the urine was validated for completeness, number of days urine was collected, mean urine sodium (mg), number of people measured for urine, whether a conversion factor was used to convert measured 24‐hour urine excretion into estimate of intake,16 number of days diet was collected, mean dietary sodium (mg), number of people measured for diet, and whether discretionary salt was measured during the diet recall. Measures of variability of data (such as standard deviation, standard error, and 95% confidence intervals) for urine and diet were also extracted. Where data from more than one study were included in a single manuscript, data from individual studies were extracted separately where possible. Supporting articles outlining methods of data collection in more detail were also reviewed. If data originated from an intervention study, only baseline data were extracted. If discretionary salt estimates were reported separately from those in food, measures were combined. If multiple days of urine collection or dietary assessment were made, they were recorded as concurrent (assessed over the same 24‐hour period) if there was 1 concurrent day.
CC and RM extracted the data independently and discussed any discrepancies. Data were entered into two separate Excel spreadsheets, which were then merged to identify discrepancies or data entry errors. Any discrepancies were checked by two researchers (RM and NO) and consensus achieved by referring back to the original papers.
For the meta‐analysis, we required a single mean (and standard deviation) sodium level (in mg) for each of the dietary measure and the 24‐hour urine measure. In order to achieve this, we made the following decisions:
Where the means and standard deviations were reported for separate categories (eg, by sex or ethnicity), the results were combined. We used the formula presented by Cochrane (section 7.7.3.8) for combining the categories (table 7.7a in the handbook).18 When there were more than two categories, the calculations were done sequentially as recommended by Cochrane.
Where only the confidence intervals were reported, the standard deviations were calculated from the known formula for a confidence interval, assuming a normal distribution.
Seven of the studies reported geometric means and their confidence intervals. We used the approach of Higgins et al19 to transform this information into means and standard deviations consistent with the raw means presented in the other studies. In the present study, this avoids discarding 25% of the studies available in the pooled analysis.
Quality was scored on a scale of 0‐7, using a scoring system developed for evaluating quality in validation studies of dietary intake methods20 (see Appendix S2). Studies are rated as very good to excellent if the score was ≥5.0; good if 3.5 ≤ score < 5; acceptable/reasonable if 2.5 ≤ score < 3.5; or poor if the score was <2.5.
This study was registered with PROSPERO (registration number: CRD42019118618).
2.4. Statistical analysis
Random‐effect meta‐analyses were used to pool the individual results because of the observational nature of the studies. We conducted subgroup analyses for whether the authors stated the urine samples were validated, whether they stated the use of a multiple‐pass method to collect the dietary measure, whether they stated that they allowed for discretionary salt, and whether the studies took place in an upper‐middle‐ or high‐income country according to the World Bank country grouping for 2018/2019 tables.21 To examine potential sources of heterogeneity, sensitivity analyses were performed by (a) comparing studies where we transformed the geometric means and confidence intervals with others, (b) comparing small studies (with fewer than 100 patients) with larger studies, and (c) comparing studies by quality. Meta‐regression was used to determine differences between groups. All analyses were performed using Stata Release 15 (StataCorp. Stata Statistical Software: Release 15: StataCorp LLC, 2017). In cases where the mean and standard deviation were presented as mmol, we use the conversion 1 mmol Na = 1 mEq Na = 23 mg Na. Where salt was reported, and not sodium, we used the conversion 1 g Na = 2.54 g NaCl = 2.54 g salt.
3. RESULTS
The initial search of three databases identified 3570 potentially eligible articles, and 1 article was identified through other sources. After 384 duplicates were removed, 3187 titles and abstracts were screened and 116 articles were assessed for eligibility (see Figure 1). Twenty‐eight eligible studies are included in this review (see Table 1). Five of the 28 papers had the means and standard deviations (in mg) as required.
Figure 1.
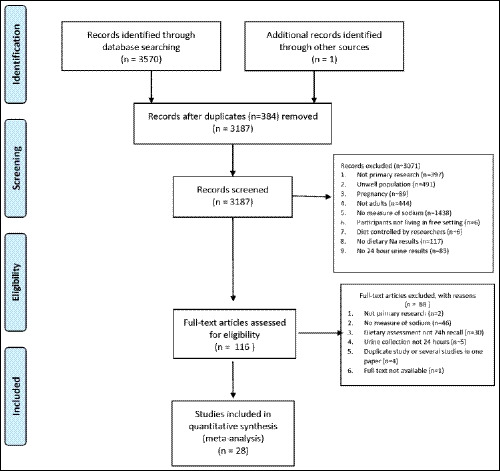
Prisma flow diagram for systematic literature review
Table 1.
Description of studies included in qualitative synthesis
| First author, publication year | Name of study | Country | Study design | Sample size | Age of participants (years), mean and/or (range) | % Female | Urine validated for completeness | Maximum number of days urine was collected | Maximum number of days diet was collected | Multiple‐pass methods used in 24‐h diet recall | Discretionary salt measured in 24‐h diet recall | Concurrent (urine and diet) |
|---|---|---|---|---|---|---|---|---|---|---|---|---|
| Campino 201628 | Chile | Cross‐sectional | 135 | 41.2 | 51.9 | Creatinine | 1 | 1 | Not stated | Yes | Yes | |
| Charlton 200525 | South Africa | Cross‐sectional | 325 | (20‐65) | 50 | PABA, creatinine, urine volume | 3 | 3 | No | No | Yes | |
| Cornejo 201429 | Chile | Cross‐sectional | 70 | 35 | 51.4 | No | 1 | 3 | Not stated | Not stated | Yes | |
| De Keyzer 20153 | European Food Consumption Validation (EFCOVAL) | Belgium, Norway, Czech Republic | Cross‐sectional | 365 | (45‐65) | 50 | PABA | 2 | 2 | Not stated | Yes | Yes |
| Dennis 200330, 31 | International Population Study on Macronutrients and Blood Pressure (INTERMAP) | China, Japan, UK, USA | Cross‐sectional | 4680 | (40‐59) | 49.6 | Urine volume, other method, and self‐report | 2 | 4 | Yes | Yes | Yes |
| Dhemla 201626 | India | Cross‐sectional | 60 | (25‐45) | 50 | Not stated | 1 | 4 | Not stated | Yes | Not stated | |
| Erdem 201722 | SALTURK II | Turkey | Cross‐sectional | 464 | 47.6 | 53.1 | Creatinine | 1 | 1 | Yes | Yes | Yes |
| Espeland 200132 | Trial of Nonpharmacologic Interventions in the Elderly (TONE) | USA | Cross‐sectional | 800 | (60‐79) | 54 | Urine volume and self‐report | 1 | 1 | Not stated | Yes | No |
| Ferreira‐Sae 200923 | Brazil | Cross‐sectional | 132 | 55.5 (18‐85) | 62.9 | Not stated | 1 | 1 | Not stated | Yes | No | |
| Freedman 201533, 34 | Observing Protein and Energy Nutrition (OPEN) | USA | Cross‐sectional | 484 | 53.4 (40‐69) | 46 | PABA | 2 | 2 | Yes | Not stated | No |
| Freedman 201533, 35 | Energetics | USA | Cross‐sectional | 263 | 37.8 (21‐69) | 64 | Not stated | 2 | 3 | Yes | Not stated | Not stated |
| Freedman 201533, 36 | Nutrition and Physical Activity Assessment Study (NPAAS) | USA | Cross‐sectional | 450 | 70.5 (50‐79) | 100 | PABA | 1 | 3 | Yes | No | Yes |
| Freedman 201533, 37 | Nutrient Biomarker Study of Women's Health Initiative Strategy | USA | Cross‐sectional | 544 | 70.9 (50‐79) | 100 | PABA and self‐report | 1 | 2 | Yes | No | Yes |
| Johansson 199227, 38 | Sweden | Intervention | 20 | 44 (27‐61) | 80 | Other method | 1 | 4 | Not stated | Not stated | Yes | |
| Kelly 201538 | Ireland | Cross‐sectional | 50 | (18‐64) | 36 | PABA | 1 | 2 | Yes | Yes | Yes | |
| Kong 201839 | South Korea | Cross‐sectional | 640 | (19‐69) | 50 | Creatinine and urine volume | 2 | 2 | Not stated | Not stated | Not stated | |
| Lassale 201540 | NutriNet‐Santé | France | Cross‐sectional | 193 | (23‐83) | 48 | PABA, creatinine, and self‐report | 2 | 3 | Yes | Yes | Yes |
| Mann 198741 | Canada | Intervention | 56 | 48.5 (20‐78) | 62.5 | Creatinine | 2 | 1 | Not stated | Not stated | No | |
| Mercado 201542 | USA | Cross‐sectional | 402 | (18‐39) | 54 | Creatinine, urine volume, and self‐report | 2 | 2 | Yes | No | Yes | |
| Nam 201743 | South Korea | Cross‐sectional | 640 | (19‐69) | 50 | Creatinine, urine volume | 2 | 2 | Not stated | Not stated | No | |
| Perin 201324 | Brazil | Cross‐sectional | 108 | 56.7 | 51.9 | Not stated | 1 | 1 | Not stated | Yes | No | |
| Reinivuo 200644 | Finland | Cross‐sectional | 879 | 53.4 | Creatinine and urine volume | 1 | 2 | Not stated | Yes | No | ||
| Rhodes 2013 14, 33, 45 | USA | Cross‐sectional | 465 | 50 | Creatinine, urine volume, and self‐report | 2 | 2 | Yes | No | Yes | ||
| Santos 201746 | Australia | Cross‐sectional | 412 | 58 | 55.6 | Creatinine and urine volume | 1 | 1 | Yes | Yes | No | |
| Satoh 201447 | Japan | Cross‐sectional | 203 | 67.8 | 46.3 | Creatinine | 1 | 1 | Not stated | Yes | Yes | |
| Trijsburg 201548 | DuPLO Study (Measurement errors in dietary assessment) | Netherlands | Cross‐sectional | 197 | 55.7 | 53.5 | PABA and self‐report | 2 | 9 | Yes | Not stated | Not stated |
| Yuan 201849, 50 | Women's Lifestyle Validation Study | USA | Cross‐sectional | 624 | 61 | 100 | Not stated | 4 | 4 | Yes | No | Yes |
| Zhang 200051 | Belgium Interuniversity Research on Nutrition | Belgium | Cross‐sectional | 4122 | 48.5 | Not stated | 1 | 1 | Not stated | No | No |
3.1. Qualitative synthesis
Studies were published between 1992 and 2018, and included two intervention and 26 cross‐sectional studies (Table 1). Most studies were conducted in high‐income countries, with 5 studies conducted in middle‐income countries (Turkey,22 Brazil,23, 24 South Africa,25 and India26). No studies were from low‐income countries. Only one study27 included fewer than 50 participants, the number recommended as a minimum for validation studies which include biomarkers.20 Twenty‐one studies reported that they used measures to validate 24‐hour urine collections for completeness, including use of self‐report, para‐amino benzoic acid (PABA), creatinine concentration, and/or urine volume. Thirteen studies reported the use of multiple‐pass methods of 24‐hour dietary recall assessment, and 13 studies reported methods that assessed discretionary salt: salt added in cooking and at the table. Fifteen studies included at least one day when 24‐hour urine collection and 24‐hour diet recall were concurrent. Conversion factors were 0.86 (n = 8), 0.9 (n = 2), or 0.95 (n = 1) and are used to account for incomplete excretion of ingested sodium in urine (see Table 1).
3.2. Meta‐analysis
For the 28 studies included in the metaanalysis, the pooled weighted mean difference between mean sodium from 24‐hour diet recall and 24‐hour urine collection was 607 (95% CI 366, 847) mg/d (Figure 2). This indicates that, on average, the sodium measure from 24‐hour urine is 607 mg/d higher than that measured in 24‐hour diet recall. Overall, there was considerable heterogeneity between the studies (I 2 98.3%, P < .001).
Figure 2.
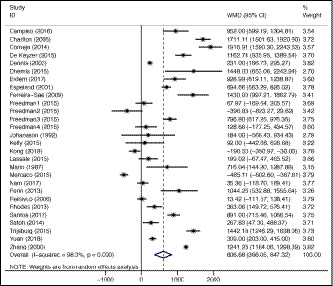
Forest plot of differences in estimated sodium intake from observational studies reporting mean sodium intakes from 24‐h diet recall and 24‐h urine collection in the same patients
We found that there was no evidence of a difference in those studies reporting data using geometric means compared to those who did not. Quality of the study showed some evidence of an effect (P = .023). The studies rated as “excellent quality” showed the smallest mean difference (59 [95% CI −520, 639] mg/d), and the studies rated as “acceptable quality” had the largest (1249 [95% CI 746, 1752] mg/d). Good‐quality studies had a pooled mean of (602 [95% CI 342, 861] mg/d). This means that some of the heterogeneity between the studies can be explained by study quality, although this does not explain the overall sizeable heterogeneity. There was no evidence of an effect of study size on the heterogeneity (Appendix S3).
Subgroup analyses indicated a greater difference in the measures in middle‐income countries compared to high‐income countries (P = .008). The pooled mean difference for the middle‐income countries was 1315 (95% CI 934, 1698) mg/d and for the high‐income countries was 466 (95% CI 207, 724) mg/d. There was weak evidence of a “multiple‐pass” effect (P = .053). In other words, studies clearly stating that they used multiple‐pass methods for 24‐hour diet recall collection showed a smaller difference in their measures (361 [95% CI 89, 633] mg/d) than others (834 [95% CI 475, 1192] mg/d). An effect is suggested between those studies with or without a clear statement of validation of the urine sample (P = .086). Studies reporting that they validated their urine samples for completeness had a pooled mean difference of 488 (95% CI 250, 726) mg/d, whereas those that did not had 985 (95% CI 470, 1500) mg/d. There was no difference between studies that used a factor (0.86, 0.9, or 0.95) to convert measured 24‐hour sodium excretion into an estimate of intake and those that did not.
4. DISCUSSION
We found that 24‐hour diet recall underestimated population mean sodium intake by an average of 607 mg per day (equivalent to around 1.5 g salt per day) compared to 24‐hour urine collection. The difference between measures from 24 urine and 24‐hour diet recall was smaller in high‐income than other countries, in studies where multiple‐pass methods of 24‐hour diet recall were reported and where urine was validated for completeness. Higher quality studies also reported smaller differences between measures than lower quality studies.
This study shows that 24‐hour urine collection remains the best method of dietary sodium intake for accurate measurement of population sodium intake—a finding consistent with other recently published studies.15, 16 Accurate measurement is especially important where intakes are not substantially above target levels, and underestimates in assessment in this situation may delay or prevent the development of suitable public health interventions to lower intakes. The degree to which 24‐hour diet recall underestimates population mean sodium intakes is not insubstantial, at around 600 mg/d, with differences much higher in some studies (Figure 2). Further, the high degree of heterogeneity in studies suggests that bias over time may not be consistent, thereby unable to detect small decreases or increases in population sodium intake over time, essential for monitoring and evaluation. The difference between high‐income and non–high‐income countries may be due to resourcing issues maintaining high‐quality up‐to‐date food composition databases in lower resource countries, although all studies from non–high‐income countries used local country‐specific food composition databases.
Other differences were observed by study quality, and use of multiple‐pass methods in 24‐hour diet recall and validation of urine for completeness. Our measure of study quality was specific to nutrient intake validation studies,20 which is how the results of all these studies were assessed in this meta‐analysis. However, not all studies included were designed as validation studies, so are not “lower quality studies” per se. Smaller differences among studies that used multiple‐pass methods of dietary assessment (where there are multiple passes of assessment with prompts about frequently forgotten foods) and those that report validating urine for completeness were expected given that these methods are used to enhance the accuracy of both methods of assessment. Although these differences were not statistically significant (P > .05), the actual differences are relevant in a population monitoring setting.
Interestingly, use of a conversion factor to account for incomplete urinary excretion of sodium was not associated with a greater difference between 24‐hour diet recall and 24‐hour urine intake measurements. We expected that the difference would be greater in those studies that converted measured 24‐hour urinary excretion into estimates of intake based on the assumption that only around 90% of ingested sodium is excreted in the urine. Although not significantly different, the pooled estimate of the difference for those studies that used a conversion factor was in fact smaller than that for those that did not (406 mg/d vs 740 mg/d, respectively).
Although there was no difference among studies that report assessment of discretionary salt intake overall, countries where discretionary salt is a large proportion of intake should clearly take account of discretionary salt. For example, Perin et al24 estimated that discretionary salt was around 78% of total salt intake in a Brazilian sample of hypertensive patients. Not measuring discretionary salt in this situation would have led to a substantial underestimate of total intake.
Many countries already have established nutrition surveys that use 24‐hour diet recall to assess intakes of nutrients and foods. While dietary sodium intake is often reported from these studies, 24‐hour urinary collection is generally considered the most accurate method of measuring dietary sodium intake. Countries where population 24‐hour urine assessment has been undertaken have generally conducted dedicated 24‐hour urine collection surveys9, 28 rather than incorporating 24‐hour urine collection into existing surveys. This is largely due to the considerable burden on participants of 24‐hour urine collection. This study demonstrates that where countries rely on 24‐hour diet recall for estimating population sodium intake, it is important that high‐quality 24‐hour diet recall methods are used. We recommend the use of multiple‐pass methods and accurate food composition databases, and where discretionary salt is a large proportion of population sodium intake, estimates of discretionary salt intake must be included. We also recommend that countries consider conducting a high‐quality validation study20 to indicate the degree to which the 24‐hour recall method relates to measured 24‐hour urine sodium excretion in the population of interest. This information can be used to plan population sodium intake measurement and monitoring.
4.1. Strengths and limitations
This meta‐analysis reports on twenty‐eight studies, including observational studies, validation studies, and intervention studies. We report here only on group means as the mean population intake is the key measure in the WHO voluntary target for reduction of non‐communicable diseases.2 We have not compared differences in variability between the two methods. Estimating variability in population sodium intake is important for determining the proportion of the population above recommended levels, but has not been examined here. We have not been able to fully explain the sizeable heterogeneity between study results. Both measures of sodium intake methods have potential for bias. Twenty‐four‐hour diet recall is prone to recall bias, which may be systematic or random, and social desirability bias.29, 30 Twenty‐four‐hour diet recall relies on accurate data collection, and use of appropriate and up‐to‐date food composition databases. Twenty‐four‐hour urines have considerable respondent burden, and both under‐ and over‐collection have been reported.31 Not all studies included in this analysis were validation studies, and so attention to accurate data collection may have been variable. Some authors may have not reported methods such as accounting for discretionary salt, or using methods to assess completeness of 24‐hour urine collections that were used in the study, thereby affecting the accuracy of our sensitivity analyses.
5. CONCLUSIONS
Almost all populations have intakes that are substantially above the recommended 2000 mg/d population mean for adults. Public health interventions are urgently required to reduce dietary sodium intake in order to achieve the WHO recommendation to reduce intake by 30% by 2025. Accurate measurement and monitoring of population dietary sodium intake is necessary to assess whether public health interventions to reduce population sodium intake are effective. Monitoring with 24‐hour urinary excretion remains the most accurate method of assessment as 24‐hour diet recall tends to underestimate intake. Where 24‐hour diet recall is the method used, we recommend using multiple‐pass methods, ensuring accurate food composition databases, measuring discretionary salt where this is a large proportion of intake. Ideally, a high‐quality validation study comparing 24‐hour diet recall with 24‐hour urine should be undertaken to assess the degree of bias in the 24‐hour recall method.
CONFLICT OF INTEREST
Norm Campbell was a paid consultant to the Novartis Foundation (2016‐2017) to support their program to improve hypertension control in low‐ to middle‐income countries which includes travel support for site visits and a contract to develop a survey. NRCC has provided paid consultative advice on accurate blood pressure assessment to Midway Corporation (2017) and is an unpaid member of World Action on Salt and Health (WASH). Nancy Cook was an expert panel member for Jazz Pharmaceuticals (2019). Mark Woodward is a consultant for Amgen and Kyowa Hakko Kirin.
AUTHOR CONTRIBUTIONS
Rachael McLean, Claire Cameron, and Norm Campbell designed the study; Rachael McLean, Claire Cameron, and Elizabeth Butcher conducted the systematic literature review and extracted the data; Claire Cameron and Rachael McLean conducted the statistical analysis and wrote the manuscript; and Elizabeth Butcher, Nancy Cook, Mark Woodward, and Norm Campbell contributed to the manuscript.
Supporting information
ACKNOWLEDGMENTS
We would like to thank Nathaniel Otley for his assistance in preparing and analyzing the data, as well as contributing to the manuscript.
McLean R, Cameron C, Butcher E, Cook NR, Woodward M, Campbell NRC. Comparison of 24‐hour urine and 24‐hour diet recall for estimating dietary sodium intake in populations: A systematic review and meta‐analysis. J Clin Hypertens. 2019;21:1753–1762. 10.1111/jch.13729
REFERENCES
- 1. World Health Organization . Ten threats to global health Geneva: World Health Organization; 2019. https://www.who.int/emergencies/ten-threats-to-global-health-in-2019. Accessed April 15, 2019.
- 2. World Health Organization . Global Action Plan for the Prevention and Control of Noncommunicable Diseases 2013–2020. Geneva: World Health Organization; 2013. [Google Scholar]
- 3. De Keyzer W, Dofková M, Lillegaard ITL, et al. Reporting accuracy of population dietary sodium intake using duplicate 24 h dietary recalls and a salt questionnaire. Br J Nutr. 2015;113(3):488‐497. [DOI] [PubMed] [Google Scholar]
- 4. Bedford JL, Barr SI. Higher urinary sodium, a proxy for intake, is associated with increased calcium excretion and lower hip bone density in healthy young women with lower calcium intakes. Nutrients. 2011;3(11):951‐961. [DOI] [PMC free article] [PubMed] [Google Scholar]
- 5. Milajerdi A, Djafarian K, Shab‐Bidar S. Dose–response association of dietary sodium intake with all‐cause and cardiovascular mortality: a systematic review and meta‐analysis of prospective studies. Public Health Nutr. 2019;22(2):295‐306. [DOI] [PMC free article] [PubMed] [Google Scholar]
- 6. National Academies of Sciences E, and Medicine . Dietary Reference Intakes for Sodium and Potassium. Washington, DC: The National Academies Press; 2019. [PubMed] [Google Scholar]
- 7. Queiroz A, Damasceno A, Jessen N, et al. Urinary sodium and potassium excretion and dietary sources of sodium in Maputo, Mozambique. Nutrients 2017;9(8):830. [DOI] [PMC free article] [PubMed] [Google Scholar]
- 8. Cogswell ME, Zhang Z, Carriquiry AL, et al. Sodium and potassium intakes among US adults: NHANES 2003–2008. Am J Clin Nutr. 2012;96(3):647‐657. [DOI] [PMC free article] [PubMed] [Google Scholar]
- 9. Joint Health Surveys Unit . An Assessment of Dietary Sodium Levels Among Adults (Aged 19–64) in the General Population, Based on Analysis of Dietary Sodium in 24 hour Urine Samples. London: National Centre for Social Research; 2006. [Google Scholar]
- 10. Okuda N, Stamler J, Brown IJ, et al. Individual efforts to reduce salt intake in China, Japan, UK, USA: what did people achieve? The INTERMAP Population Study. J Hypertens. 2014;32(12):2385‐2392. [DOI] [PubMed] [Google Scholar]
- 11. Joint Health Surveys Unit . A Survey of 24 Hour and Spot Urinary Sodium and Potassium Excretion in a Representative Sample of the Scottish Population. London: National Centre for Social Research; 2007. [Google Scholar]
- 12. Laatikainen T, Pietinen P, Valsta LM, Sundvall J, Reinivuo H, Tuomilehto J. Sodium in the Finnish diet: 20‐year trends in urinary sodium excretion among the adult population. Eur J Clin Nutr. 2006;60:965‐970. [DOI] [PubMed] [Google Scholar]
- 13. Cogswell ME, Loria CM, Terry AL, et al. Estimated 24‐hour urinary sodium and potassium excretion in US adults: estimated 24‐hour urinary sodium and potassium excretion in US adults estimated 24‐hour urinary sodium and potassium excretion in US adults. JAMA. 2018;319(12):1209‐1220. [DOI] [PMC free article] [PubMed] [Google Scholar]
- 14. Moshfegh AJ, Rhodes DG, Baer DJ, et al. The US Department of Agriculture Automated Multiple‐Pass Method reduces bias in the collection of energy intakes. Am J Clin Nutr. 2008;88(2):324‐332. [DOI] [PubMed] [Google Scholar]
- 15. Campbell NR, He FJ, Tan M, et al. The International Consortium for Quality Research on Dietary Sodium/Salt (TRUE) position statement on the use of 24‐hour, spot, and short duration (<24 hours) timed urine collections to assess dietary sodium intake. J Clin Hypertens. 2019;21:700‐709. [DOI] [PMC free article] [PubMed] [Google Scholar]
- 16. Lucko AM, Doktorchik C, Woodward M, et al. Percentage of ingested sodium excreted in 24‐hour urine collections: a systematic review and meta‐analysis. J Clin Hypertens. 2018;20(9):1220‐1229. [DOI] [PMC free article] [PubMed] [Google Scholar]
- 17. McLean R, Farmer VL, Nettleton A, et al. Twenty‐four‐hour diet recall and diet records compared with 24‐hour urinary excretion to predict an individual’s sodium consumption: a systematic review. J Clin Hypertens. 2018;20:1360‐1376. [DOI] [PMC free article] [PubMed] [Google Scholar]
- 18. Higgins JP, Green S. Cochrane Handbook for Systematic Reviews of Interventions; Chichester (UK): John Wiley & Sons. 2008. [Google Scholar]
- 19. Higgins JP, White IR, Anzures‐Cabrera J. Meta‐analysis of skewed data: combining results reported on log‐transformed or raw scales. Stat Med. 2008;27(29):6072‐6092. [DOI] [PMC free article] [PubMed] [Google Scholar]
- 20. Serra‐Majem L, Andersen LF, Henrique‐Sanchez P, et al. Evaluating the quality of dietary intake validation studies. Br J Nutr. 2009;102:S3‐S9. [DOI] [PubMed] [Google Scholar]
- 21. The World Bank . World Bank Country and Lending Groups: Country Classification undated. https://datahelpdesk.worldbank.org/knowledgebase/articles/906519-world-bank-country-and-lending-groups%20income%20level%202018-9. Accessed March 14, 2019.
- 22. Erdem Y, Akpolat T, Derici Ü, et al. Dietary sources of high sodium intake in Turkey: SALTURK II. Nutrients. 2017;9:933. [DOI] [PMC free article] [PubMed] [Google Scholar]
- 23. Ferreira‐Sae M‐C, Gallani M‐C, Nadruz W, et al. Reliability and validity of a semi‐quantitative FFQ for sodium intake in low‐income and low‐literacy Brazilian hypertensive subjects. Public Health Nutr. 2009;12(11):2168‐2173. [DOI] [PubMed] [Google Scholar]
- 24. Perin MS, Cornelio ME, Rodrigues RC, Gallani MC. Characterization of salt consumption among hypertensives according to socio‐demographic and clinical factors. Rev Lat Am Enfermagem. 2013;21(5):1013‐1021. [DOI] [PubMed] [Google Scholar]
- 25. Charlton KE, Steyn K, Levitt NS, et al. Ethnic differences in intake and excretion of sodium, potassium, calcium and magnesium in South Africans. Eur J Cardiovasc Prev Rehabil. 2005;12(4):355‐362. [DOI] [PubMed] [Google Scholar]
- 26. Dhemla S, Varma K. Estimation of salt intake of normotensive subjects of Jaipur City. Nutr Food Sci. 2016;46(6):766‐777. [Google Scholar]
- 27. Johansson G, Callmer E, Gustafsson J‐Å. Validity of repeated dietary measurements in a dietary intervention study. Eur J Clin Nutr. 1992;46(10):717‐728. [PubMed] [Google Scholar]
- 28. McLean R, Edmonds J, Williams S, Mann J, Skeaff SA. Balancing sodium and potassium: estimates of intake in a New Zealand adult population sample. Nutrients. 2015;7(11):8930‐8938. [DOI] [PMC free article] [PubMed] [Google Scholar]
- 29. Gemming L, Jiang Y, Swinburn B, Utter J, Ni MC. Under‐reporting remains a key limitation of self‐reported dietary intake: an analysis of the 2008/09 New Zealand Adult Nutrition Survey. Eur J Clin Nutr. 2013;68(2):259‐264. [DOI] [PubMed] [Google Scholar]
- 30. Bailey R. Evaluating Calorie Intake: Data Science Campus; 2018. https://datasciencecampus.ons.gov.uk/2018/02/15/eclipse/. Accessed February 20, 2018.
- 31. John KA, Cogswell ME, Campbell NR, et al. Accuracy and usefulness of select methods for assessing complete collection of 24‐hour urine: a systematic review. J Clin Hypertens. 2016;18(5):456‐467. [DOI] [PMC free article] [PubMed] [Google Scholar]
- 32. Espeland MA, Kumanyika S, Wilson AC, et al. Lifestyle interventions influence relative errors in self‐reported diet intake of sodium and potassium. Ann Epidemiol. 2001;11(2):85–93. [DOI] [PubMed] [Google Scholar]
- 33. Freedman LS, Commins JM, Moler JE, et al. Pooled results from 5 validation studies of dietary self‐report instruments using recovery biomarkers for potassium and sodium intake. Am J Epidemiol. 2015;181(7):473–487. [DOI] [PMC free article] [PubMed] [Google Scholar]
- 34. Subar AF, Midthune D, Tasevska N, Kipnis V, Freedman LS. Checking for completeness of 24‐h urine collection using para‐amino benzoic acid not necessary in the Observing Protein and Energy Nutrition study. Eur J Clin Nutr. 2013;67(8):863–867. [DOI] [PubMed] [Google Scholar]
- 35. Arab L, Wesseling‐Perry K, Jardack P, Henry J, Winter A. Eight self‐administered 24‐hour dietary recalls using the Internet are feasible in African Americans and Whites: the energetics study. J Am Diet Assoc. 2010;110(6):857–864. [DOI] [PMC free article] [PubMed] [Google Scholar]
- 36. Prentice RL, Mossavar‐Rahmani Y, Huang Y, et al. Evaluation and comparison of food records, recalls, and frequencies for energy and protein assessment by using recovery biomarkers. Am J Epidemiol. 2011;174(5):591–603. [DOI] [PMC free article] [PubMed] [Google Scholar]
- 37. Neuhouser ML, Tinker L, Shaw PA, et al. Use of recovery biomarkers to calibrate nutrient consumption self‐reports in the Women's Health Initiative. Am J Epidemiol. 2008;167(10):1247–1259. [DOI] [PubMed] [Google Scholar]
- 38. Kelly C, Geaney F, Fitzgerald A, Browne G, Perry I. Validation of diet and urinary excretion derived estimates of sodium excretion against 24‐hour urine excretion in a worksite sample. Nutr Metab Cardiovasc Dis. 2015;25:771–779. [DOI] [PubMed] [Google Scholar]
- 39. Kong J‐S, Lee Y‐K, Kim MK, et al. Estimation model for habitual 24‐hour urinary‐sodium excretion using simple questionnaires from normotensive Koreans. PLoS One. 2018;13(2):15. [DOI] [PMC free article] [PubMed] [Google Scholar]
- 40. Lassale C, Castetbon K, Laporte F, et al. Validation of a Web‐based, self‐administered, non‐consecutive‐day dietary record tool against urinary biomarkers. Br J Nutr. 2015;113(6):953–962. [DOI] [PubMed] [Google Scholar]
- 41. Mann KV, Sullivan PL. Effect of task‐centered instructional programs on hypertensives' ability to achieve and maintain reduced dietary sodium intake. Patient Educ Couns. 1987;10(1):53–72. [Google Scholar]
- 42. Mercado CI, Cogswell ME, Valderrama AL, et al. Difference between 24‐h diet recall and urine excretion for assessing population sodium and potassium intake in adults aged 18–39 y. Am J Clin Nutr. 2015;101(2):376–386. [DOI] [PMC free article] [PubMed] [Google Scholar]
- 43. Nam GE, Kim SM, Choi M‐K, et al. Association between 24‐h urinary sodium excretion and obesity in Korean adults: a multicenter study. Nutrition. 2017;41:113–119. [DOI] [PubMed] [Google Scholar]
- 44. Reinivuo H, Valsta L, Laatikainen T, Tuomilehto J, Pietinen P. Sodium in the Finnish diet: II trends in dietary sodium intake and comparison between intake and 24‐h excretion of sodium. Eur J Clin Nutr. 2006;60(10):1160–1167. [DOI] [PubMed] [Google Scholar]
- 45. Rhodes DG, Murayi T, Clemens JC, Baer DJ, Sebastian RS, Moshfegh AJ. The USDA Automated Multiple‐Pass Method accurately assesses population sodium intakes. Am J Clin Nutr. 2013;97(5):958–964. [DOI] [PubMed] [Google Scholar]
- 46. Santos JA, Webster J, Land M‐A, et al. Dietary salt intake in the Australian population. Public Health Nutrit. 2017;20(11):1887–1894. [DOI] [PMC free article] [PubMed] [Google Scholar]
- 47. Satoh M, Kato N, Hosaka M, et al. Validity of salt intake assessment system based on a 24‐h dietary recall method using a touch panel computer. Clin Exp Hypertens. 2014;36(7):471–477. [DOI] [PubMed] [Google Scholar]
- 48. Trijsburg L, de Vries JHM, Boshuizen HC, et al. Comparison of duplicate portion and 24 h recall as reference methods for validating a FFQ using urinary markers as the estimate of true intake. Br J Nutr. 2015;114(8):1304–1312. [DOI] [PubMed] [Google Scholar]
- 49. Yuan C, Spiegelman D, Rimm EB, et al. Relative validity of nutrient intakes assessed by questionnaire, 24‐hour recalls, and diet records as compared with urinary recovery and plasma concentration biomarkers: findings for women. Am J Epidemiol. 2018;187(5):1051–1063. [DOI] [PMC free article] [PubMed] [Google Scholar]
- 50. Yuan C, Spiegelman D, Rimm EB, et al. Relative validity of nutrient intakes assessed by questionnaire, 24‐hour recalls, and diet records as compared with urinary recovery and plasma concentration biomarkers: findings for women. Am J Epidemiol. 2017;187(5):1051–1063. [DOI] [PMC free article] [PubMed] [Google Scholar]
- 51. Zhang J, Temme EH, Sasaki S, Kesteloot H. Under‐and overreporting of energy intake using urinary cations as biomarkers: relation to body mass index. Am J Epidemiol. 2000;152(5):453–462. [DOI] [PubMed] [Google Scholar]
Associated Data
This section collects any data citations, data availability statements, or supplementary materials included in this article.
Supplementary Materials