

Abstract
Lipids and lipid ratios have been proven to be associated with cardiovascular disease; however, their relationships with stroke and stroke subtypes had not been fully understood. This study aims to assess the associations of lipids and lipid ratios with type‐specific stroke and compare their predictive capacities for stroke occurrence. In this prospective cohort study, a total of 42 005 Chinese participants aged 20 to 80 who were free of stroke at baseline were included and selected into subgroups of stroke subtypes (ischemic, hemorrhagic, and total). Total stroke outcome included a combination of ischemic and hemorrhagic stroke. Over an average follow‐up of 3.6 years, 781 participants developed stroke (623 ischemic and 158 hemorrhagic). In men, the highest TC/HDL‐C quartile was significantly associated with increased ischemic stroke risk (multivariable‐adjusted hazard ratio [HR], 1.52, 95% confidence interval [CI], 1.14‐2.03) and total stroke risk (HR, 1.45, 95% CI, 1.12‐1.87), and TC/HDL‐C had the highest area under the receiver operating characteristic curve (AUC) for predicting ischemic (AUC, 0.868) and total stroke (AUC, 0.874). In women, the highest TG quartile was significantly associated with increased risk of ischemic (HR, 1.99, 95% CI, 1.11‐3.59) and total stroke (HR, 1.85, 95% CI, 1.07‐3.20), with AUCs of 0.850 and 0.861, respectively. No lipid variables were significantly associated with hemorrhagic stroke in both sex. In conclusion, TC/HDL‐C ratio may better predict stroke risk in men, whereas TG was more valuable in predicting stroke risk in women. TC/HDL‐C and TG may help to discriminate high stroke risk individuals and serve as potential targets for stroke prevention.
Keywords: coronary disease, epidemiology, lipids, stroke and stroke prevention
1. INTRODUCTION
Dyslipidemia is conventionally considered to play an important role in the pathogenesis of stroke.1, 2 Traditional lipid parameters, represented by increased serum concentrations of total cholesterol (TC), triglyceride (TG), low‐density lipoprotein cholesterol (LDL‐C), and decreased high‐density lipoprotein cholesterol (HDL‐C), are recognized as predictors for cardiovascular disease (CVD) including stroke.3, 4, 5, 6 However, several lipid ratio parameters, such as TC/HDL‐C, TG/HDL‐C, and LDL‐C/HDL‐C, defined in an attempt to optimize the predictive capacity of the lipid profile, have been demonstrated by several published studies to be better predictors of vascular risk than traditional lipid parameters.7, 8, 9, 10, 11, 12, 13
Despite this, previous studies reported inconsistent results on the associations between lipid ratios and stroke risk. For instance, a prospective and a retrospective cohort study observed that increased TC/HDL‐C ratio was significantly associated with ischemic stroke and brain ischemia recurrence,14, 15 and a randomized controlled trial study found a significant association between elevated TG/HDL‐C ratio and recurrent stroke risk.16 Findings from the Northern Manhattan Study and the Iwate‐Kenpoku Cohort study conversely indicated no association between lipid ratios and stroke.17, 18 Thus, there is still a lack of relevant epidemiologic evidence to suggest the relationships between lipid ratios and stroke. Moreover, few studies have directly compared the contribution of lipids and lipid ratios on type‐specific stroke, particularly in Asian populations. Examining and quantifying to what extent lipids and lipid ratios contribute to stroke risk has implications for risk stratification and prevention of stroke.
In this study, we aim to comprehensively assess the associations between lipids, lipid ratios, and stroke in a Chinese prospective cohort, meanwhile to evaluate their capacities for predicting stroke risk.
2. METHODS
Data were obtained from the database of multicenter longitudinal health management cohorts in Shandong province, which was based on the routine health examination system in the Center for Health Management of Jining Medical University Hospital. Previous studies in this cohort demonstrated high reliability and validity of the data.19, 20 The protocol was approved by ethics committee of the School of Public Health (20140322), Shandong University. Written informed consent was obtained from all participants.
2.1. Study population and cohort design
The prospective cohort recruited participants who underwent routine health examination at least two times from 2007 to 2015 (n = 76 364). The exclusion criteria were as follows: (a) with stroke history or stroke at baseline (n = 887); (b) with missing data of age, sex, serum lipid values, or other crucial variables (n = 31 722); and (c) aged less than 20 or more than 80 (n = 1750). After exclusion of ineligible participants, a total of 42 005 participants (25 989 men and 16 016 women) were enrolled in the final analysis.
2.2. Measurements
Demographic, clinical, and laboratory data were collected at baseline. Fasting serum TC, TG, HDL‐C, and LDL‐C were measured enzymatically by cobas 8000 automatic chemical analyzer (Roche Diagnostics, Basel, Switzerland) at the clinical laboratory of Jining Medical University Hospital. Non‐HDL‐C was calculated as TC minus HDL‐C. Based on the routine serum lipid profiles obtained, we computed three lipid ratio variables as follows: TC/HDL‐C, TG/HDL‐C, and LDL‐C/HDL‐C ratios, all of which have at least once been reported as a predictor of cardiovascular risk in the literature.8, 9, 10, 11, 21, 22 Systolic blood pressure (SBP) and diastolic blood pressure (DBP) were measured on the right upper arm of participants in a sitting position after a 5‐minute rest. Body mass index (BMI) was calculated as weight in kilograms divided by the square of the height in meters. Trained interviewers obtained information on cigarette smoking (current/not current), alcohol consumption status (current/not current), family history of CVD (yes/no), and history of hypertension (yes/no). Type 2 diabetes mellitus was defined as fasting plasma glucose ≥7.0 mmol/L and/or 2 hours postprandial plasma glucose ≥11.1 mmol/L according to the Chinese Guidelines for Prevention and Treatment of Diabetes (2013 Edition). Information on the use of lipid‐lowering drugs was obtained from the database of medical insurance information from the Office for Basic Medical Insurance in Shandong Province and recorded as yes/no.
2.3. Outcomes
Based on the updated definition and criteria of stoke,23 the outcomes for this study were defined as follows: The primary outcome was ischemic stroke, secondary outcome was hemorrhagic stroke, and tertiary outcome was a combination of ischemic stroke and hemorrhagic stroke. Diagnosis of stroke and stroke subtypes was firstly recognized based on the health examination records and further confirmed by accessing the databases of medical insurance information from the Office for Basic Medical Insurance in Shandong Province. The International Classification of Diseases, 10th revision (ICD‐10) was used to identify stroke events (I60‐I62 for hemorrhagic stroke, I63‐I66 for ischemic stroke).
2.4. Statistical analysis
The anthropometric and biochemical characteristics by sex and by outcome events were described and compared at baseline. Cox proportional hazards models were performed to estimate the effect of lipids and lipid ratios on risk of outcome events, after firstly adjusting for age, BMI, SBP, DBP, cigarette smoking, alcohol consumption status, and use of lipid‐lowering drugs (model 1), and then for other possible confounding factors: diabetes, history of hypertension, and family history of CVD (model 2). All lipid and lipid ratio variables were evaluated in the following two ways: (a) as continuous variables and (b) as categories (each was stratified into four quartiles according to the distribution, and dummy variables were created for each category to compare with the lowest quartile as the referent group). The significance of the trend over different categories was tested in the same model by giving an ordinal numeric value for each dummy variable. The effect of each parameter was expressed as hazard ratio (HR) with associated 95% confidence interval (CI). The proportional hazards assumption in the Cox model was assessed with graphical methods and with models including time‐by‐covariate interactions. All proportionality assumptions were valid. Receiver operating characteristic (ROC) curve analysis was performed, and the area under the ROC curve (AUC) was calculated to compare the predictive capacity of lipid variables and identify the maximum value of sensitivity and specificity combinations corresponding to the appropriate cutoff points of lipid variables for the prediction of the stroke events. The optimal cutoff values were defined as the point at which the value of “sensitivity+specificity‐1” reached the maximum value. Data analyses were performed by sex. All statistical analyses were performed with the SAS system (version 9.4), and P < 0.05 (2‐tailed) was considered statistically significant.
3. RESULTS
3.1. Baseline characteristics of study population
Over an average follow‐up period of 3.6 years, 781 participants developed incident stroke (623 ischemic and 158 hemorrhagic). Table 1 summarizes the baseline characteristics of study variables by sex. Compared with female participants, male participants were older and had higher levels of BMI, SBP, DBP, TC, TG, LDL‐C, non‐HDL‐C, TC/HDL‐C, TG/HDL‐C, and LDL‐C/HDL‐C, and lower level of HDL‐C. Additionally, men appeared to be with more history of hypertension and higher prevalence of diabetes, and developed more stroke events than women during follow‐up. Table S1 summarizes the baseline characteristics of participants in stroke subtype groups and nonstroke group. Compared with nonstroke group, participants who developed stroke showed a significant increase in all lipids and lipid ratios except from HDL‐C.
Table 1.
Descriptive characteristics of study variables by sex
| Variables | Men (n = 25 989) | Women (n = 16 016) | P value |
|---|---|---|---|
| Age | 41.83 ± 12.3 | 43.02 ± 13.17 | <0.001 |
| BMI, kg/m2 | 25.85 ± 3.64 | 23.56 ± 3.59 | <0.001 |
| SBP, mm Hg | 130.19 ± 16.84 | 120.63 ± 18.78 | <0.001 |
| DBP, mm Hg | 81.23 ± 12.25 | 72.89 ± 11.54 | <0.001 |
| Current smoker, n (%) | 4804 (18.48) | 25 (0.16) | <0.001 |
| Alcohol consumption, n (%) | 5404 (20.79) | 17 (0.11) | <0.001 |
| Use of lipid‐lowering drugs, n (%) | 1492 (5.74) | 678 (4.23) | <0.001 |
| Diabetes, n (%) | 2051 (7.89) | 812 (5.07) | <0.001 |
| History of hypertension, n (%) | 8508 (32.74) | 2831 (17.68) | <0.001 |
| Family history of CVD, n (%) | 474 (1.82) | 397 (2.48) | <0.001 |
| Follow‐up year | 3.66 ± 2.13 | 3.45 ± 2.03 | <0.001 |
| Incident stroke, n (%) | 542 (2.09) | 239 (1.49) | <0.001 |
| Lipid variables | |||
| TC, mmol/L | 4.91 ± 0.93 | 4.75 ± 0.91 | <0.001 |
| TG, mmol/L | 1.8 ± 1.65 | 1.17 ± 0.91 | <0.001 |
| HDL‐C, mmol/L | 1.26 ± 0.26 | 1.42 ± 0.26 | <0.001 |
| LDL‐C, mmol/L | 2.87 ± 0.74 | 2.73 ± 0.74 | <0.001 |
| Non‐HDL‐C, mmol/L | 3.64 ± 0.92 | 3.33 ± 0.91 | <0.001 |
| TC/HDL‐C | 4.03 ± 1.07 | 3.45 ± 0.88 | <0.001 |
| TG/HDL‐C | 1.59 ± 1.89 | 0.91 ± 0.95 | <0.001 |
| LDL‐C/HDL‐C | 2.35 ± 0.71 | 1.98 ± 0.64 | <0.001 |
Data were expressed as mean ± standard deviation or frequency (%). Comparison was conducted using Mann‐Whitney U test or chi‐square test.
BMI, body mass index; CVD, cardiovascular disease; HDL‐C, high‐density lipoprotein cholesterol; LDL‐C, low‐density lipoprotein cholesterol; TC, total cholesterol; TG, triglyceride.
3.2. Adjusted HRs of lipids and lipid ratios as continuous variables
Table 2 shows the adjusted HRs and 95% CIs of lipids and lipid ratios as continuous variables for stroke events. After multivariable adjustment (model 1), higher levels of TG, non‐HDL‐C, TC/HDL‐C, and TG/HDL‐C was significantly associated with higher risk of ischemic and total stroke in men, with HRs (95% CIs) of 1.07 (1.02‐1.13), 1.13 (1.02‐1.25), 1.11 (1.02‐1.21), 1.06 (1.01‐1.10), 1.08 (1.03‐1.13), 1.15 (1.05‐1.26), 1.11 (1.03‐1.20), and 1.06 (1.02‐1.10), respectively. The HRs of TG, TC/HDL‐C, and TG/HDL‐C for both ischemic and total stroke, and the HRs of non‐HDL‐C for total stroke were attenuated but remained significant after adjusting for other covariates (model 2). Besides, higher level of TC were significantly associated with increased total stroke risk with the adjusted HRs (95% CIs) of 1.12 (1.03‐1.23) in model 1 and 1.09 (1.00‐1.20) in model 2. In women, higher TG level was significantly associated with increased risk of ischemic and total stroke with multivariable‐adjusted HRs (95% CIs) of 1.12 (1.01‐1.23) and 1.10 (1.00‐1.20), respectively. No significant associations were observed between lipid variables and hemorrhagic stroke in both sex.
Table 2.
Adjusted hazard ratios and 95% confidence intervals of lipids and lipid ratios as continuous variables for stroke
| Ischemic stroke | Hemorrhagic stroke | Total stroke | ||||
|---|---|---|---|---|---|---|
| Model 1 | Model 2 | Model 1 | Model 2 | Model 1 | Model 2 | |
| Men | ||||||
| Lipid, mmol/L | ||||||
| TC | 1.11 (1.00‐1.22) | 1.09 (0.98‐1.20) | 1.18 (0.99‐1.42) | 1.11 (0.93‐1.34) | 1.12 (1.03‐1.23)a | 1.09 (1.00‐1.20)a |
| TG | 1.07 (1.02‐1.13)a | 1.06 (1.00‐1.12)a | 1.09 (1.00‐1.19) | 1.04 (0.95‐1.15) | 1.08 (1.03‐1.13)a | 1.06 (1.01‐1.11)a |
| HDL‐C | 0.85 (0.59‐1.23) | 0.83 (0.57‐1.21) | 0.97 (0.50‐1.90) | 0.94 (0.47‐1.86) | 0.88 (0.64‐1.21) | 0.86 (0.62‐1.19) |
| LDL‐C | 1.08 (0.95‐1.22) | 1.06 (0.94‐1.21) | 1.11 (0.89‐1.40) | 1.07 (0.85‐1.35) | 1.08 (0.97‐1.21) | 1.07 (0.96‐1.19) |
| Non‐HDL‐C | 1.13 (1.02‐1.25)a | 1.11 (1.00‐1.23) | 1.20 (1.00‐1.45) | 1.13 (0.94‐1.36) | 1.15 (1.05‐1.26)a | 1.12 (1.02‐1.22)a |
| Lipid ratios | ||||||
| TC/HDL‐C | 1.11 (1.02‐1.21)a | 1.10 (1.01‐1.2)a | 1.11 (0.95‐1.30) | 1.08 (0.92‐1.27) | 1.11 (1.03‐1.20)a | 1.10 (1.02‐1.19)a |
| TG/HDL‐C | 1.06 (1.01‐1.10)a | 1.05 (1.00‐1.10)a | 1.05 (0.97‐1.14) | 1.02 (0.93‐1.12) | 1.06 (1.02‐1.10)a | 1.04 (1.00‐1.09)a |
| LDL‐C/HDL‐C | 1.12 (0.98‐1.27) | 1.11 (0.98‐1.27) | 1.10 (0.86‐1.39) | 1.08 (0.84‐1.38) | 1.11 (0.99‐1.24) | 1.11 (0.99‐1.24) |
| Women | ||||||
| Lipid, mmol/L | ||||||
| TC | 0.97 (0.83‐1.13) | 0.97 (0.83‐1.12) | 1.21 (0.86‐1.71) | 1.22 (0.86‐1.72) | 1.00 (0.87‐1.15) | 1.00 (0.87‐1.15) |
| TG | 1.11 (1.01‐1.22)a | 1.12 (1.01‐1.23)a | 1.04 (0.79‐1.36) | 0.99 (0.73‐1.33) | 1.10 (1.00‐1.20)a | 1.10 (1.00‐1.20)a |
| HDL‐C | 1.15 (0.68‐1.94) | 1.14 (0.67‐1.93) | 1.31 (0.37‐4.70) | 1.59 (0.44‐5.72) | 1.17 (0.72‐1.91) | 1.19 (0.73‐1.94) |
| LDL‐C | 0.89 (0.75‐1.07) | 0.89 (0.74‐1.07) | 1.39 (0.91‐2.12) | 1.42 (0.92‐2.18) | 0.95 (0.81‐1.13) | 0.95 (0.80‐1.13) |
| Non‐HDL‐C | 0.96 (0.82‐1.12) | 0.95 (0.81‐1.11) | 1.21 (0.85‐1.72) | 1.19 (0.83‐1.7) | 0.99 (0.86‐1.14) | 0.98 (0.85‐1.14) |
| Lipid ratios | ||||||
| TC/HDL‐C | 0.96 (0.82‐1.12) | 0.96 (0.82‐1.13) | 1.07 (0.75‐1.52) | 1.02 (0.71‐1.45) | 0.98 (0.85‐1.13) | 0.97 (0.84‐1.12) |
| TG/HDL‐C | 1.08 (0.99‐1.18) | 1.09 (1.00‐1.19) | 1.00 (0.75‐1.33) | 0.94 (0.68‐1.30) | 1.07 (0.99‐1.17) | 1.07 (0.98‐1.17) |
| LDL‐C/HDL‐C | 0.86 (0.69‐1.07) | 0.86 (0.69‐1.07) | 1.30 (0.79‐2.13) | 1.24 (0.75‐2.04) | 0.91 (0.75‐1.12) | 0.91 (0.74‐1.11) |
Model 1: adjusted age (continuous), BMI (continuous), SBP (continuous), DBP (continuous), cigarette smoking (current/not current), alcohol consumption (current/not current), and use of lipid‐lowering drugs (yes/no). Model 2: adjusted model 1 plus diabetes (yes/no), history of hypertension (yes/no), and family history of CVD (yes/no).
HDL‐C, high‐density lipoprotein cholesterol; TC, total cholesterol; TG, triglyceride; LDL‐C, low‐density lipoprotein cholesterol.
P value <0.05.
3.3. Adjusted HRs of lipids and lipid ratios as categories
When estimated as categories, the increased ischemic and total stroke risks were significantly associated with the highest TC/HDL‐C quartile in men and the highest TG quartile in women after multivariable adjustment (Tables S2 and S3). Figure 1 summarizes the adjusted HRs and 95% CIs of TC/HDL‐C quartiles for ischemic and total stroke in men. In model 1, the HRs (95% CIs; P for trend) of the highest vs the lowest TC/HDL‐C quartile group was 1.55 (1.16‐2.06; P trend = 0.004) for ischemic and 1.49 (1.16‐1.92; P trend = 0.002) for total stroke. After adjusting for other covariates in model 2, the highest TC/HDL‐C quartile remained significantly associating with ischemic (HR, 1.52, 95% CI, 1.14‐2.03, P trend = 0.006) and total stroke (1.45, 1.12‐1.87, P trend = 0.004). Figure 2 summarizes the adjusted HRs and 95% CIs of TG quartiles for ischemic and total stroke in men. In model 1, the HRs (95% CIs) of the highest vs the lowest TG quartile group was 1.99 (1.11‐3.58; P trend = 0.018) for ischemic and 1.87 (1.08‐3.24; P trend = 0.018) for total stroke, respectively. After further adjustment in model 2, the highest TG quartile remained significantly associating with ischemic (1.99, 1.11‐3.59, P trend = 0.019) and total stroke (1.85, 1.07‐3.20, P trend = 0.025). No lipid variables were significantly associated with hemorrhagic stroke in both sex.
Figure 1.
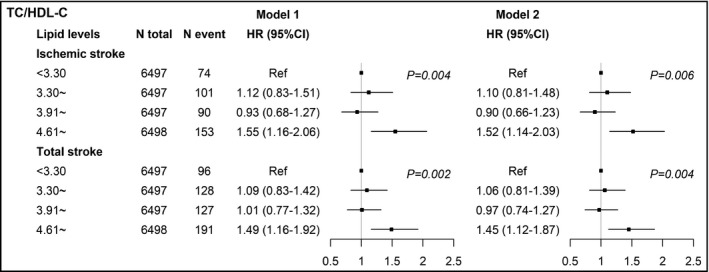
Adjusted hazard ratios and 95% confidence intervals of TC/HDL‐C for ischemic and total stroke in men. Model 1: adjusted age (continuous), BMI (continuous), SBP (continuous), DBP (continuous), cigarette smoking (current/not current), alcohol consumption (current/not current), and use of lipid‐lowering drugs (yes/no). Model 2: adjusted model 1 plus diabetes (yes/no), history of hypertension (yes/no), and family history of CVD (yes/no). TC, total cholesterol; HDL‐C, high‐density lipoprotein cholesterol; HR, hazard ratio
Figure 2.
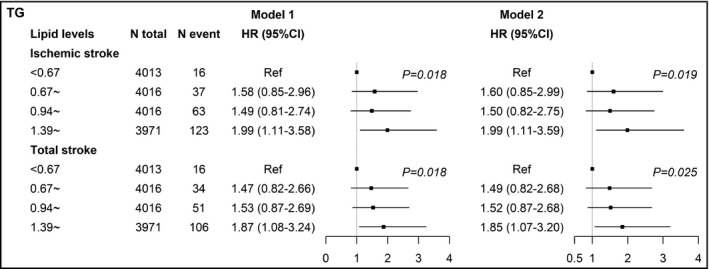
Adjusted hazard ratios and 95% confidence intervals of TG for ischemic and total stroke in women. Model 1: adjusted age (continuous), BMI (continuous), SBP (continuous), DBP (continuous), cigarette smoking (current/not current), alcohol consumption (current/not current), and use of lipid‐lowering drugs (yes/no). Model 2: adjusted model 1 plus diabetes (yes/no), history of hypertension (yes/no), and family history of CVD (yes/no). TG, triglyceride; HR, hazard ratio
3.4. Predictive capacity of lipid and lipid ratio variables
Table 3 shows the results of AUC analyses of each lipid variable for predicting future ischemic and total stroke by sex. Compared with other lipid variables, TC/HDL‐C and TG were with the highest adjusted AUC in predicting men and women's stroke, indicating their potential superior predictive capacity. Figure 3 presents the adjusted ROC curves of TC/HDL‐C for predicting future ischemic and total stroke in men. The area under the ROC curves of TC/HDL‐C were 0.864 (model 1) and 0.868 (model 2) for ischemic stroke, and 0.868 (model 1) and 0.874 (model 2) for total stroke in men. In women, the AUC of TG for ischemic and total stroke was 0.846 and 0.857 in model 1, and 0.850 and 0.861 in model 2, respectively, as shown in Figure 4. According to the ROC curves, the cutoff values of TC/HDL‐C for predicting increased stroke risk in men were 4.77 (ratio) and the cutoff values of TG for predicting increased stroke risk in women were 1.025 mmol/L. The evaluation of the performance of lipid variables for predicting stroke by other diagnosis indexes: sensitivity, specificity, likelihood ratio (+), and likelihood ratio (−), is shown in Tables S4 and S5. TC/HDL‐C and TG were with the best capacity for correctly discriminating and predicting stroke events in men and women.
Table 3.
Adjusted AUCs and 95% confidence intervals of lipids and lipid ratios for predicting ischemic and total stroke
| Variables | Ischemic stroke | Total stroke | ||
|---|---|---|---|---|
| Model 1 | Model 2 | Model 1 | Model 2 | |
| Men | ||||
| TC | 0.863 (0.847, 0.879) | 0.867 (0.851, 0.883) | 0.868 (0.853, 0.882) | 0.874 (0.860, 0.888) |
| TG | 0.863 (0.847, 0.880) | 0.867 (0.851, 0.883) | 0.867 (0.853, 0.882) | 0.874 (0.859, 0.888) |
| HDL‐C | 0.863 (0.846, 0.879) | 0.867 (0.851, 0.883) | 0.866 (0.852, 0.881) | 0.873 (0.859, 0.887) |
| LDL‐C | 0.862 (0.846, 0.879) | 0.867 (0.851, 0.883) | 0.867 (0.852, 0.881) | 0.873 (0.859, 0.888) |
| Non‐HDL‐C | 0.863 (0.847, 0.880) | 0.867 (0.852, 0.884) | 0.868 (0.854, 0.882) | 0.874 (0.860, 0.888) |
| TC/HDL‐C | 0.864 (0.848, 0.880) | 0.868 (0.853, 0.884) | 0.868 (0.854, 0.882) | 0.874 (0.860, 0.888) |
| TG/HDL‐C | 0.863 (0.847, 0.879) | 0.867 (0.851, 0.883) | 0.867 (0.852, 0.882) | 0.873 (0.859, 0.888) |
| LDL‐C/HDL‐C | 0.863 (0.847, 0.879) | 0.868 (0.852, 0.884) | 0.867 (0.853, 0.882) | 0.874 (0.860, 0.888) |
| Women | ||||
| TC | 0.845 (0.822, 0.868) | 0.849 (0.827, 0.872) | 0.856 (0.835, 0.877) | 0.861 (0.841, 0.881) |
| TG | 0.846 (0.823, 0.869) | 0.850 (0.828, 0.872) | 0.857 (0.836, 0.877) | 0.861 (0.841, 0.881) |
| HDL‐C | 0.845 (0.822, 0.868) | 0.849 (0.827, 0.871) | 0.856 (0.835, 0.877) | 0.861 (0.841, 0.881) |
| LDL‐C | 0.845 (0.822, 0.868) | 0.849 (0.827, 0.872) | 0.856 (0.835, 0.877) | 0.861 (0.841, 0.881) |
| Non‐HDL‐C | 0.845 (0.822, 0.868) | 0.849 (0.826, 0.872) | 0.856 (0.835, 0.877) | 0.849 (0.826, 0.872) |
| TC/HDL‐C | 0.845 (0.822, 0.868) | 0.849 (0.826, 0.871) | 0.856 (0.835, 0.877) | 0.861 (0.841, 0.881) |
| TG/HDL‐C | 0.846 (0.823, 0.869) | 0.850 (0.827, 0.872) | 0.856 (0.835, 0.877) | 0.861 (0.841, 0.881) |
| LDL‐C/HDL‐C | 0.845 (0.821, 0.868) | 0.849 (0.826, 0.871) | 0.856 (0.835, 0.877) | 0.861 (0.841, 0.881) |
Model 1: adjusted age (continuous), BMI (continuous), SBP (continuous), DBP (continuous), cigarette smoking (current/not current), alcohol consumption (current/not current), and use of lipid‐lowering drugs (yes/no). Model 2: adjusted model 1 plus diabetes (yes/no), history of hypertension (yes/no), and family history of CVD (yes/no).
HDL‐C, high‐density lipoprotein cholesterol; LDL‐C, low‐density lipoprotein cholesterol; TC, total cholesterol; TG, triglyceride; .
Figure 3.
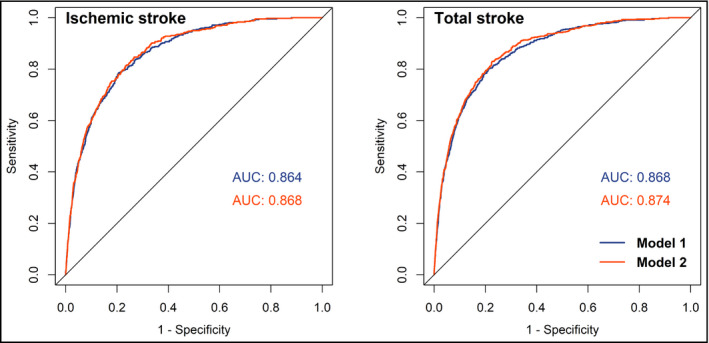
Adjusted ROC curves and AUCs of TC/HDL‐C for predicting ischemic and total stroke in men. Model 1: adjusted age (continuous), BMI (continuous), SBP (continuous), DBP (continuous), cigarette smoking (current/not current), alcohol consumption (current/not current), and use of lipid‐lowering drugs (yes/no). Model 2: adjusted model 1 plus diabetes (yes/no), history of hypertension (yes/no), and family history of CVD (yes/no). ROC curves, receiver operating characteristic curves; AUC, area under ROC curve; TC, total cholesterol; HDL‐C, high‐density lipoprotein cholesterol
Figure 4.
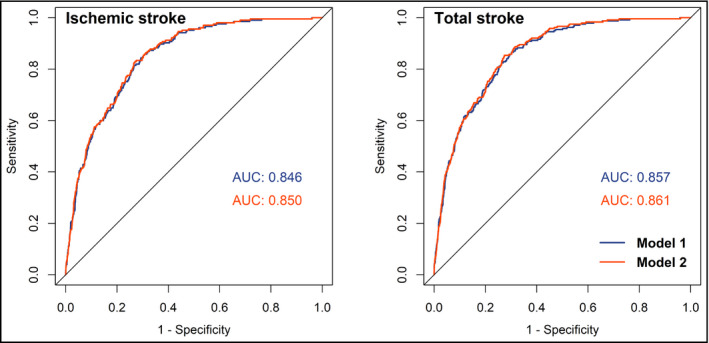
Adjusted ROC curves and AUCs of TG for predicting ischemic and total stroke in women. Model 1: adjusted age (continuous), BMI (continuous), SBP (continuous), DBP (continuous), cigarette smoking (current/not current), alcohol consumption (current/not current), and use of lipid‐lowering drugs (yes/no). Model 2: adjusted model 1 plus diabetes (yes/no), history of hypertension (yes/no), and family history of CVD (yes/no). ROC curves, receiver operating characteristic curves; AUC, area under ROC curve; TG, triglyceride
4. DISCUSSION
The findings from this large cohort add to the growing evidence that serum lipid and lipid ratio parameters are associated with stroke risk. When estimated as continuous variables, higher levels of TG, TC/HDL‐C, and TG/HDL‐C in men and TG in women were associated with increased risk of ischemic and total stroke. When stratified into categories, regression results confirmed the contribution of TC/HDL‐C in men and TG in women to ischemic and total stroke. Further AUC analyses demonstrated TC/HDL‐C and TG had better predictive capacity than other lipid parameters in predicting stroke in men and women. However, we did not observe significant associations between lipids variables and hemorrhagic stroke in both sex.
Significant progress has been made in assessing the relationship between lipid parameters and stroke. Particularly, lipid ratios have became well‐established representations of their joint contribution to cardiovascular risk stratification.7, 8, 9, 10, 11, 12, 13 Yet some inconsistency exists regarding the association between lipid ratios and stroke. For instance, a retrospective observational cohort study reported brain ischemia recurrence increased with increased values of TC/HDL‐C and LDL‐C/HDL‐C in patients with embolic stroke,15 and a case‐control study found that higher TC/HDL‐C, TG/HDL‐C, and LDL‐C/HDL‐C related to an increased risk for ischemic stroke.24 However, the Northern Manhattan Study found no relation of stroke risk with higher level of TC/HDL‐C ratio,17 and a Japanese study indicated no association between lipoprotein ratio quartiles and ischemic stroke.18 The discrepant findings may be explained by the substantial heterogeneity of the study population, design, end point definition, or due to missing data on type‐specific stroke and because of possible different association between lipids profiles with stroke subtypes and insufficient adjustment for potential medical confounders.
In this study, after adjusting for confounders, the TC/HDL‐C ratio showed significant association with the risk of ischemic and total stroke in men, though TC or HDL‐C alone did not show any significant association. A Finland cohort study revealed TC/HDL‐C was associated with ischemic stroke for both men and women,25 whereas we observed no significant association between TC/HDL‐C and stroke risk in women. In addition, we observed that TC/HDL‐C presented a higher AUC for stroke than other lipid variables, indicating its potential for higher discriminatory power, as well as better predictive capacity for stroke. This observation is concordant with results from several previous studies, which suggests TC/HDL‐C ratio may be a more potent predictor of cardiovascular risk than TC, LDL‐C, or HDL‐C alone.12, 26
The simultaneous use of lipid profile in a ratio is more useful than individual lipid values as it more closely reflects the complex interactions of lipoprotein metabolism. Some researchers claimed the lipid ratio indicates the proportion of atherogenic to anti‐atherogenic lipoproteins.7 We assume individuals with a high TC/HDL‐C ratio have greater stroke risk owing to the imbalance between the cholesterol carried by atherogenic and protective lipoproteins. This may be due to an increase in the atherogenic component contained in the numerator, a decrease in the anti‐atherosclerotic trait of the denominator, or both.27
The association between TG level and stroke risk has been investigated in several studies, of which some found a positive association,28, 29, 30 while others found no association.2, 31, 32 In this study, we observed increased level of TG was associated with increased risk of ischemic and total stroke in women, concordant with the result from the Women's Health Initiative Observational Study28 and a large Asian‐Pacific meta‐analysis.29 Mechanically, increased level of TG indicates the presence of increased level of atherogenic remnant lipoproteins,33 which may carry, like low‐density lipoprotein, large amounts of cholesterol that upon entrance into the arterial intima and cause atherosclerosis and eventually ischemic stroke. Also, increased level of TG associates with increased levels of small, dense LDLs, both of which associate with atherosclerosis.34 Nevertheless, some observational studies indicated no association between TG and stroke, and a systematic review showed a weak detrimental effect of higher triglyceride levels on stroke risk. These mixed results may be explained by different study population and study design, or partly due to differential use of both fasting and nonfasting TG levels, as several studies put forward using levels of nonfasting rather than fasting TG may better predict ischemic stroke, perhaps because the greater variability of postprandial levels captures important information about an individual's metabolism.31, 35 These discrepancies highlight the need for additional large prospective studies to firmly establish the independent effect of TG levels on stroke risk.
Although TG was associated with stroke risk in women, such association was not observed in men in this study. Summarily, TC/HDL‐C was associated with stroke risk in men but not in women. This observed sex disparity possibly resulted from various mechanisms raised by previous studies. For instance, considering the different hormonal profiles between two sex, Women's Health Initiative and others argue that the effect of estrogen on lipid metabolism to be responsible for this disparity.36, 37, 38 Other basic research studies point out women's atherosclerotic plaques tend to have more stable fibrous cap and erode more frequently, whereas men prone to more plaque ruptures.39 Moreover, the removal and transport rate of low‐ and very low‐density lipoprotein is higher in women than in men,40, 41 leading to the unequal risk level of atherosclerosis in male and female sex. These observations may partly account for the sex disparity emphasized by this study.
The association between lipid profiles and hemorrhagic stroke is less certain. Several studies reported an increased risk of hemorrhagic stroke at lower lipid levels,42, 43, 44 while others observed no significant association.4, 45 We observed in this study a significant association of the third LDL‐C/HDL‐C quartile group with lower hemorrhagic stroke risk, possibly indicates an inverse or a nonlinear association. Nevertheless, the exact relationship between lipids and hemorrhagic stroke remains to be further examined.
This study has several limitations. Firstly, the associations of lipid parameters with stroke have been revealed to be heterogeneous across ischemic stroke subtypes,4 and lacunar stroke and embolic stroke seem to be less associated with elevated lipid levels than those large artery atherosclerotic stroke subtypes, such as atherothrombotic infarction.46, 47 Therefore, it is probable that including these ischemic stroke subtypes as an entirety in this analysis masks the true association. Secondly, we had no measurements of several important markers for atherogenic lipoproteins, including apolipoprotein B or A‐I, and these markers could potentially provide additional information about stroke risk. Thirdly, this study is conducted based on the routine health examination in health examination center, and so the participants who undertook the health examination may not be representative of the overall health population, thereby limiting generalizability. Finally, although we adjusted for numerous covariates by multivariable regression, the effects of residual confounders may not be wholly controlled due to measurement errors or unmeasured factors. However, our study is strengthened by the rigorous procedures of the prospective design and inclusion of type‐specific stroke participants with large sample size, as well as sufficiently long follow‐up time. In addition, we estimated variables both as categories and as continuous variables, which comprehensively reflected and confirmed the association between lipid‐related variables and stroke risk.
5. CONCLUSIONS
This study provided evidence on the association of lipids and lipid ratios with stroke and its subtypes. TC/HDL‐C was mostly associated with ischemic and total stroke in men, whereas TG was more important in predicting ischemic and total stroke in women. These two lipid indexes appeared to be of most important prognostic value for identifying high‐risk participants predisposed to stroke in men and women and may serve as potential targets for stroke prevention.
ACKNOWLEDGMENTS
We thank the team of Department of Biostatistics, Shandong University, for their diligence in early data acquisition and data preparation, and thank the staff of Center for Health Management, Hospital of Jining Medical College, for their data collection work. Specifically, we thank the participants in the cohort for contributing their health checkup information.
CONFLICT OF INTEREST
All authors declared that they have no conflict of interests.
Supporting information
Liu X, Yan L, Xue F. The associations of lipids and lipid ratios with stroke: A prospective cohort study. J Clin Hypertens. 2019;21:127–135. 10.1111/jch.13441
Funding information
The study was supported by the National Natural Science Foundation, China (No. 81573259).
REFERENCES
- 1. Pisciotta L, Bertolini S, Pende A. Lipoproteins, stroke and statins. Curr Vasc Pharmacol. 2015;13(2):202‐208. [DOI] [PubMed] [Google Scholar]
- 2. Shahar E, Chambless LE, Rosamond WD, et al. Plasma lipid profile and incident ischemic stroke: the Atherosclerosis Risk in Communities (ARIC) study. Stroke. 2003;34(3):623‐631. [DOI] [PubMed] [Google Scholar]
- 3. Gu X, Yang X, Li Y, et al. Usefulness of low‐density lipoprotein cholesterol and non‐high‐density lipoprotein cholesterol as predictors of cardiovascular disease in Chinese. Am J Cardiol. 2015;116(7):1063‐1070. [DOI] [PubMed] [Google Scholar]
- 4. Tirschwell DL, Smith NL, Heckbert SR, Lemaitre RN, Longstreth WT Jr, Psaty BM. Association of cholesterol with stroke risk varies in stroke subtypes and patient subgroups. Neurology. 2004;63(10):1868‐1875. [DOI] [PubMed] [Google Scholar]
- 5. Kurth T, Everett BM, Buring JE, Kase CS, Ridker PM, Gaziano JM. Lipid levels and the risk of ischemic stroke in women. Neurology. 2007;68(8):556‐562. [DOI] [PMC free article] [PubMed] [Google Scholar]
- 6. Blood pressure, cholesterol, and stroke in eastern Asia. Eastern Stroke and Coronary Heart Disease Collaborative Research Group. Lancet. 1998;352(9143):1801‐1807. [PubMed] [Google Scholar]
- 7. Millan J, Pinto X, Munoz A, et al. Lipoprotein ratios: physiological significance and clinical usefulness in cardiovascular prevention. Vasc Health Risk Manag. 2009;5:757‐765. [PMC free article] [PubMed] [Google Scholar]
- 8. da Luz PL, Favarato D, Faria‐Neto JR Jr, Lemos P, Chagas AC. High ratio of triglycerides to HDL‐cholesterol predicts extensive coronary disease. Clinics. 2008;63(4):427‐432. [DOI] [PMC free article] [PubMed] [Google Scholar]
- 9. Barzi F, Patel A, Woodward M, et al. A comparison of lipid variables as predictors of cardiovascular disease in the Asia Pacific region. Ann Epidemiol. 2005;15(5):405‐413. [DOI] [PubMed] [Google Scholar]
- 10. Bittner V, Johnson BD, Zineh I, et al. The triglyceride/high‐density lipoprotein cholesterol ratio predicts all‐cause mortality in women with suspected myocardial ischemia: a report from the Women's Ischemia Syndrome Evaluation (WISE). Am Heart J. 2009;157(3):548‐555. [DOI] [PMC free article] [PubMed] [Google Scholar]
- 11. Fujihara K, Suzuki H, Sato A, et al. Carotid artery plaque and LDL‐to‐HDL cholesterol ratio predict atherosclerotic status in coronary arteries in asymptomatic patients with type 2 diabetes mellitus. J Atheroscler Thromb. 2013;20(5):452‐464. [DOI] [PubMed] [Google Scholar]
- 12. da Luz PL, Cesena FH, Favarato D, Cerqueira ES. Comparison of serum lipid values in patients with coronary artery disease at <50, 50 to 59, 60 to 69, and >70 years of age. Am J Cardiol. 2005;96(12):1640‐1643. [DOI] [PubMed] [Google Scholar]
- 13. Turak O, Afşar B, Ozcan F, et al. The role of plasma triglyceride/high‐density lipoprotein cholesterol ratio to predict new cardiovascular events in essential hypertensive patients. J Clin Hypertens. 2016;18(8):772‐777. [DOI] [PMC free article] [PubMed] [Google Scholar]
- 14. Pikula A, Beiser AS, Wang J, et al. Lipid and lipoprotein measurements and the risk of ischemic vascular events: Framingham Study. Neurology. 2015;84(5):472‐479. [DOI] [PMC free article] [PubMed] [Google Scholar]
- 15. de la Riva P, Zubikarai M, Sarasqueta C, et al. Nontraditional lipid variables predict recurrent brain ischemia in embolic stroke of undetermined source. J Stroke Cerebrovasc Dis. 2017;26(8):1670‐1677. [DOI] [PubMed] [Google Scholar]
- 16. Park JH, Lee J, Ovbiagele B. Nontraditional serum lipid variables and recurrent stroke risk. Stroke. 2014;45(11):3269‐3274. [DOI] [PMC free article] [PubMed] [Google Scholar]
- 17. Willey JZ, Xu Q, Boden‐Albala B, et al. Lipid profile components and risk of ischemic stroke: the Northern Manhattan Study (NOMAS). Arch Neurol. 2009;66(11):1400‐1406. [DOI] [PMC free article] [PubMed] [Google Scholar]
- 18. Yokokawa H, Yasumura S, Tanno K, et al. Serum low‐density lipoprotein to high‐density lipoprotein ratio as a predictor of future acute myocardial infarction among men in a 2.7‐year cohort study of a Japanese northern rural population. J Atheroscler Thromb. 2011;18(2):89‐98. [DOI] [PubMed] [Google Scholar]
- 19. Cao J, Wang C, Zhang G, et al. Incidence and simple prediction model of hyperuricemia for urban Han Chinese adults: a prospective cohort study. Int J Environ Res Public Health. 2017;14(1):67. [DOI] [PMC free article] [PubMed] [Google Scholar]
- 20. Yuan Z, Yang Y, Wang C, et al. Trajectories of long‐term normal fasting plasma glucose and risk of coronary heart disease: a prospective cohort study. J Am Heart Assoc. 2018;7(4). [DOI] [PMC free article] [PubMed] [Google Scholar]
- 21. Zengin E, Bickel C, Schnabel RB, et al. Risk factors of coronary artery disease in secondary prevention‐results from the AtheroGene–study. PLoS ONE. 2015;10(7):e0131434. [DOI] [PMC free article] [PubMed] [Google Scholar]
- 22. D'Agostino RB Sr, Vasan RS, Pencina MJ, et al. General cardiovascular risk profile for use in primary care: the Framingham Heart Study. Circulation. 2008;117(6):743‐753. [DOI] [PubMed] [Google Scholar]
- 23. Sacco RL, Kasner SE, Broderick JP, et al. An updated definition of stroke for the 21st century: a statement for healthcare professionals from the American Heart Association/American Stroke Association. Stroke. 2013;44(7):2064‐2089. [DOI] [PMC free article] [PubMed] [Google Scholar]
- 24. Guo X, Li Z, Sun G, et al. Comparison of four nontraditional lipid profiles in relation to ischemic stroke among hypertensive Chinese population. Int J Cardiol. 2015;201:123‐125. [DOI] [PubMed] [Google Scholar]
- 25. Zhang Y, Tuomilehto J, Jousilahti P, Wang Y, Antikainen R, Hu G. Total and high‐density lipoprotein cholesterol and stroke risk. Stroke. 2012;43(7):1768‐1774. [DOI] [PubMed] [Google Scholar]
- 26. Lemieux I, Lamarche B, Couillard C, et al. Total cholesterol/HDL cholesterol ratio vs LDL cholesterol/HDL cholesterol ratio as indices of ischemic heart disease risk in men: the Quebec Cardiovascular Study. Arch Int Med. 2001;161(22):2685‐2692. [DOI] [PubMed] [Google Scholar]
- 27. Criqui MH, Golomb BA. Epidemiologic aspects of lipid abnormalities. Am J Med. 1998;105(1a):48s–57s. [DOI] [PubMed] [Google Scholar]
- 28. Berger JS, McGinn AP, Howard BV, et al. Lipid and lipoprotein biomarkers and the risk of ischemic stroke in postmenopausal women. Stroke. 2012;43(4):958‐966. [DOI] [PMC free article] [PubMed] [Google Scholar]
- 29. Patel A, Barzi F, Jamrozik K, et al. Serum triglycerides as a risk factor for cardiovascular diseases in the Asia‐Pacific region. Circulation. 2004;110(17):2678‐2686. [DOI] [PubMed] [Google Scholar]
- 30. Tanne D, Koren‐Morag N, Graff E, Goldbourt U. Blood lipids and first‐ever ischemic stroke/transient ischemic attack in the Bezafibrate Infarction Prevention (BIP) Registry: high triglycerides constitute an independent risk factor. Circulation. 2001;104(24):2892‐2897. [DOI] [PubMed] [Google Scholar]
- 31. Bansal S, Buring JE, Rifai N, Mora S, Sacks FM, Ridker PM. Fasting compared with nonfasting triglycerides and risk of cardiovascular events in women. JAMA. 2007;298(3):309‐316. [DOI] [PubMed] [Google Scholar]
- 32. Labreuche J, Touboul PJ, Amarenco P. Plasma triglyceride levels and risk of stroke and carotid atherosclerosis: a systematic review of the epidemiological studies. Atherosclerosis. 2009;203(2):331‐345. [DOI] [PubMed] [Google Scholar]
- 33. Zilversmit DB. Atherogenesis: a postprandial phenomenon. Circulation. 1979;60(3):473‐485. [DOI] [PubMed] [Google Scholar]
- 34. Berneis KK, Krauss RM. Metabolic origins and clinical significance of LDL heterogeneity. J Lipid Res. 2002;43(9):1363‐1379. [DOI] [PubMed] [Google Scholar]
- 35. Freiberg JJ, Tybjaerg‐Hansen A, Jensen JS, Nordestgaard BG. Nonfasting triglycerides and risk of ischemic stroke in the general population. JAMA. 2008;300(18):2142‐2152. [DOI] [PubMed] [Google Scholar]
- 36. Rossouw JE, Anderson GL, Prentice RL, et al. Risks and benefits of estrogen plus progestin in healthy postmenopausal women: principal results from the Women's Health Initiative randomized controlled trial. JAMA. 2002;288(3):321‐333. [DOI] [PubMed] [Google Scholar]
- 37. Grodstein F, Clarkson TB, Manson JE. Understanding the divergent data on postmenopausal hormone therapy. N Engl J Med. 2003;348(7):645‐650. [DOI] [PubMed] [Google Scholar]
- 38. Knopp RH, Paramsothy P, Retzlaff BM, et al. Sex differences in lipoprotein metabolism and dietary response: basis in hormonal differences and implications for cardiovascular disease. Curr Cardiol Rep. 2006;8(6):452‐459. [DOI] [PubMed] [Google Scholar]
- 39. Burke AP, Farb A, Malcom G, Virmani R. Effect of menopause on plaque morphologic characteristics in coronary atherosclerosis. Am Heart J. 2001;141(suppl 2):S58‐S62. [DOI] [PubMed] [Google Scholar]
- 40. Mittendorfer B, Patterson BW, Klein S. Effect of sex and obesity on basal VLDL‐triacylglycerol kinetics. Am J Clin Nutr. 2003;77(3):573‐579. [DOI] [PubMed] [Google Scholar]
- 41. Knopp RH, Paramsothy P, Retzlaff BM, et al. Gender differences in lipoprotein metabolism and dietary response: basis in hormonal differences and implications for cardiovascular disease. Curr Atheroscler Rep. 2005;7(6):472‐479. [DOI] [PubMed] [Google Scholar]
- 42. Suh I, Jee SH, Kim HC, Nam CM, Kim IS, Appel LJ. Low serum cholesterol and haemorrhagic stroke in men: Korea Medical Insurance Corporation Study. Lancet. 2001;357(9260):922‐925. [DOI] [PubMed] [Google Scholar]
- 43. Zhang X, Patel A, Horibe H, et al. Cholesterol, coronary heart disease, and stroke in the Asia Pacific region. Int J Epidemiol. 2003;32(4):563‐572. [DOI] [PubMed] [Google Scholar]
- 44. Wieberdink RG, Poels MM, Vernooij MW, et al. Serum lipid levels and the risk of intracerebral hemorrhage: the Rotterdam Study. Arterioscler Thromb Vasc Biol. 2011;31(12):2982‐2989. [DOI] [PubMed] [Google Scholar]
- 45. Bots ML, Elwood PC, Nikitin Y, et al. Total and HDL cholesterol and risk of stroke. EUROSTROKE: a collaborative study among research centres in Europe. J Epidemiol Community Health. 2002;56(suppl 1):i19–i24. [DOI] [PMC free article] [PubMed] [Google Scholar]
- 46. Cui R, Iso H, Yamagishi K, et al. High serum total cholesterol levels is a risk factor of ischemic stroke for general Japanese population: the JPHC study. Atherosclerosis. 2012;221(2):565‐569. [DOI] [PubMed] [Google Scholar]
- 47. Imamura T, Doi Y, Arima H, et al. LDL cholesterol and the development of stroke subtypes and coronary heart disease in a general Japanese population. Stroke. 2009;40(2):382‐388. [DOI] [PubMed] [Google Scholar]
Associated Data
This section collects any data citations, data availability statements, or supplementary materials included in this article.
Supplementary Materials