

Abstract
Background
RNA vaccines against coronavirus disease 2019 (COVID-19) have demonstrated ∼95% efficacy in phase III clinical trials. Although complete vaccination consisted of 2 doses, the onset of protection for both licensed RNA vaccines was observed as early as 12 days after a single dose. The adaptive immune response that coincides with this onset of protection could represent the necessary elements of immunity against COVID-19.
Methods
Serological and T cell analysis was performed in a cohort of 20 healthcare workers after receiving the first dose of the Pfizer/BioNTech BNT162b2 vaccine. The primary endpoint was the adaptive immune responses detectable at days 7 and 10 after dosing.
Findings
Spike-specific T cells and binding antibodies were detectable 10 days after the first dose of the vaccine, in contrast to receptor-blocking and severe acute respiratory syndrome-coronavirus-2 (SARS-CoV-2) neutralizing antibodies, which were mostly undetectable at this early time point.
Conclusions
Our findings suggest that early T cell and binding antibody responses, rather than either receptor-blocking or virus neutralizing activity, induced early protection against COVID-19.
Funding
The study was funded by a generous donation from The Hour Glass to support COVID-19 research.
Keywords: COVID-19, RNA vaccine, vaccine efficacy, T cells, binding antibodies, neutralizing antibodies
Graphical abstract
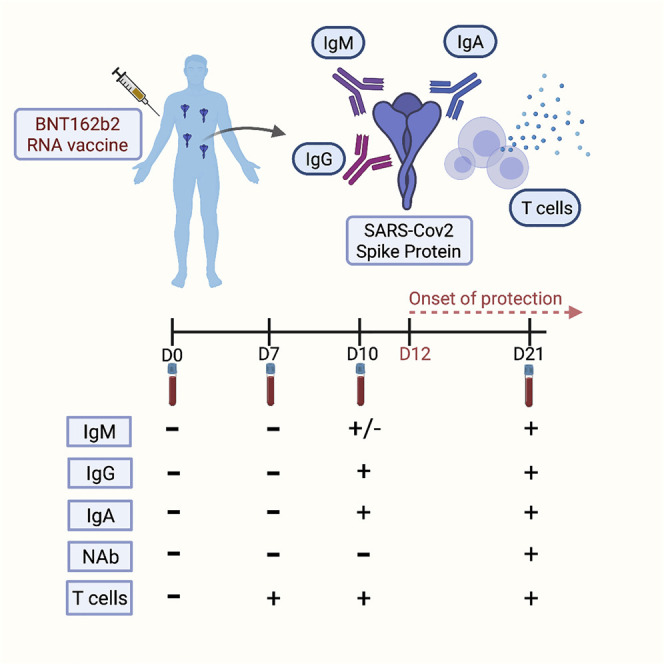
Context and significance
RNA vaccines have shown efficacy in preventing coronavirus disease 2019 (COVID-19) as early as 12 days after the first dose. Vaccine efficacy onset presents a unique opportunity to define the necessary elements of immunity against COVID-19. Kalimuddin et al. tracked the serological and T cell responses longitudinally in 20 healthcare workers after the first Pfizer/BioNTech BNT162b2 vaccine dose. Anti-spike immunoglobulin G (IgG) and IgA antibodies and spike-specific T cells were detectable at day 10 after the first dose; neutralizing and receptor-blocking antibodies remained mostly undetectable at this time point. These results suggest that binding antibodies and T cell responses are responsible for early protection against COVID-19 and call for circumspection on the prevailing notion that neutralizing antibodies are absolutely required for protection.
Kalimuddin et al. show that spike protein-binding antibodies and spike-specific T cells, but not neutralizing antibodies, could explain the onset of vaccine efficacy after the first dose of BNT162b2 vaccination. Their findings provide insight into the components of the adaptive immune response necessary for protection against COVID-19.
Introduction
The pandemic spread of severe acute respiratory syndrome-coronavirus-2 (SARS-CoV-2) has caused well over 100 million cases of coronavirus disease-19 (COVID-19) and 2 million deaths. The arrival of efficacious vaccines has been much welcomed to aid in curtailing this global health crisis. Vaccination also provides a unique opportunity to understand the adaptive immune responses necessary for protection against COVID-19. The identification of the constituents of immunity against COVID-19 could be pivotal in expediting the licensing of new efficacious vaccines to supply the urgent global demand.
The first vaccine to be licensed for emergency use was BNT162b2 by Pfizer/BioNTech. The Phase III clinical trial of this 2-dose RNA vaccine has shown ∼95% efficacy.1 However, intention-to-treat Kaplan-Meier analysis showed a dramatic reduction in and flattening of the cumulative number of COVID-19 cases in the vaccinated compared to the placebo arm, starting as early as 12 days after the first vaccine dose. Subsequent analyses have also shown that vaccine efficacy is as high as 92.6% at day 14 after the first dose of BNT162b2.2 Given that the incubation period for COVID-19 can be as short as 2 days,3 vaccine-induced adaptive immune responses that protect against COVID-19 should thus be measurable in ∼95% of vaccinated individuals as early as 10 days after the first dose. Since immunogenicity of BNT162b2 was not characterized at this time point,4 we investigated the early vaccine-induced adaptive immune responses to glimpse the factors necessary for protection against COVID-19. The primary endpoints of our study were the serological and T cell immune responses in study participants at day (D) 7 and D10 after 1 dose of BNT162b2. These endpoints were compared with pre-vaccination and pre-second dose immune responses.
Results
We enrolled 20 healthcare workers (HCWs) with no known history of COVID-19. The demographic features of the study participants are shown in Table S1.
SARS-CoV-2 spike (S) protein-binding immunoglobulin G (IgG), IgA and IgM antibodies were increased at D10 but not at D7, compared to baseline. The proportion of study participants that showed at least a 4-fold increase in geometric mean median fluorescence intensity (GMFI) for anti-S IgM antibodies was 50% (10/20) at D10 (Figure 1 A). Those that showed a similar level of increase in IgA and IgG at D10 were 85% (17/20) and 80% (16/20), respectively (Figures 1B and 1C). All of the participants were positive for these 3 classes of antibodies at D21, just before administration of the second BNT162b2 dose. In contrast to binding antibodies, 0% and only 20% (4/20) of study participants at D7 and D10, respectively, had antibodies that blocked S protein binding to human angiotensin-converting enzyme 2 (hACE2) (Figure 1D). Similarly, 0% and only 15% (3/20) of participants at D7 and D10, respectively, had antibodies that neutralized live SARS-CoV-2 virus at a 50% reduction in plaque reduction neutralization test (PRNT50) titer ≥10 (Figure S1A).
Figure 1.

Early humoral responses following 1st dose of vaccine
(A–C) Antibody responses in serum following dose 1 of vaccine were characterized in study participants at pre-dose, and at days (D) 7, 10, and 21 post-vaccination. SARS-CoV-2 S-specific IgM (A), IgA (B), and IgG (C) were measured using a bead-based immunoassay and binding data reported as median fluorescence intensity (MFI). Data were fitted with a locally weighted scatterplot smoothing (LOESS) regression analysis (blue, purple, and red lines for IgM, IgA, and IgG, respectively). IgM, IgA, and IgG data for the study population at each of the time points is presented as geometric mean MFI (GMFI). Percentage of response in the study healthcare population was calculated using a positive threshold of a ≥4-fold increase in GMFI over pre-dose.
(D) Inhibition of RBD binding to hACE2 receptor was tested using the commercial cPASS kit at 1:20 serum dilution, with a positive antibody response defined as RBD-hACE2 binding inhibition >20%. Pie charts show the percentage of study participants with positive RBD-hACE2 antibody response at each study time point.
The presence of virus binding but not neutralizing antibodies suggests that humoral immunity may, at least in part, be dependent on Fc-mediated functions. We thus measured, in a subset of serum samples with sufficient volumes, the extent of S-specific antibody-dependent cellular cytotoxicity (ADCC) induced by the antibodies produced from vaccination. We found a significant elevation in the percentage of CD107α+ cells (a marker of natural killer [NK] cell degranulation) at D10 compared to D0 (Figure S1B); significant elevation in interferon (IFN)-γ+ cells (a marker of NK cell cytokine release) was not detected until D21 (Figure S1C). These findings suggest that Fc-mediated functions may, at least in part, contribute to the early vaccine-induced protection against COVID-19.
We next measured T cell responses after a single dose of BNT162b2. The kinetics of induction of S-specific T cells was tested by measuring the frequency of activated CD8+ (CD69+4-1BB+) and CD4+ (OX40+4-1BB+) T cells following peptide stimulation (Figures S2A and S2B). The frequency of vaccinated individuals with CD8+ and CD4+ T cells activated by S peptide pools increased sequentially from D7 to D10. Peak activated CD8+ T cell response was observed in the majority at D21, whereas activated CD4+ T cell levels mostly plateaued from D10 to D21 (Figure 2 A).
Figure 2.

Induction of SARS-CoV-2 spike-specific T cell responses following 1st dose of vaccine
(A) The frequency of antigen-specific stimulation measured by activation-induced markers (AIM+) CD69+4-1BB+ expression in CD8 T cells (left) and OX40+4-1BB+ expression in CD4 T cells (right). Summarized graph represents the percentage of activation after the background subtraction of cells without SARS-CoV-2 spike (S) stimulation.
(B) The amount of IFN-γ secreted upon whole-blood stimulation with the SARS-CoV-2 S-peptide pool after deduction with the respective DMSO control.
(C) The frequency of IFN-γ SFU reactive to the SARS-CoV-2 S-peptide pool after subtraction against the negative control.
The black line indicates the median responses at different time points in (A)–(C), and n = 20 unless indicated on the figure. Whole-blood IFN-γ assay and other T cell assays were only performed in 18 and 19 individuals, respectively, on D21 due to the lack of samples. The pie graph below the axis in (A–(C) represents the summarized number of positive responses (red) defined as having a T cell response compared to D1. Statistical comparisons were performed using nonparametric ANOVA, Friedman test. ∗p < 0.05, ∗∗p < 0.01, ∗∗∗p < 0.001, ∗∗∗∗p < 0.0001, and N.S. indicates not significant. See also Figure S2.
The ability of T cells to produce IFN-γ after S peptide pool activation was also analyzed. IFN-γ secretion in peptide-stimulated whole blood was detected in 90% (18/20) at D7 and 95% (19/20) at D10, and in 89% (16/18) at D21 (Figure 2B). Likewise, T cell responses were also detected using IFN-γ ELISpot, the results of which showed a similar trend. An increased magnitude of spot-forming units (SFUs)/106 cells from baseline to D7 (median 8 SFU/106 cells) and D10 (median 28 SFU/106 cells) was observed, indicating an expansion in the frequency of SARS-CoV-2 S-specific T cells (Figure 2C). These T cells contracted by D21 (median 13 SFU/106 cells) to levels similar to those at D7.
Phenotypic analysis of the T cells producing IFN-γ was performed with intracellular cytokine staining (ICS) in participants (n = 6) with a sufficient quantity of blood. Consistent with the peak IFN-γ detection at D10 (Figures 2B and 2C), a clear population of ex vivo CD4+ T cells producing IFN-γ were visualized in 33% (2/6) of study participants (Figure S2C). Upon waning of the IFN-γ response at D21, however, ex vivo CD8+ or CD4+ T cells producing IFN-γ were no longer visualized over the background level. However, in vitro expansion of peripheral blood mononuclear cells (PBMCs) collected at D21 and stimulated by S peptide pools for 10 days resulted in the expansion of S-specific IFN-γ producing CD4+ and CD8+ T cells (n = 3; Figure S2D).
These data show that RNA vaccination induced early and functionally efficient SARS-CoV-2 S-specific T cells (both CD8+ and CD4+) that temporally coincided with the onset of vaccine efficacy. Notably, the S-specific T cell response detected at D10 was quantitatively and qualitatively similar to S-specific memory T cells present in individuals who recovered from asymptomatic SARS-CoV-2 infection (Figure S2E).
Finally, we found no correlation between either inhibition of receptor-binding domain (RBD)-hACE2 binding or neutralizing antibody titers with total IgG and IFN-γ production in PBMCs (Figures S1D–S1G).
Discussion
BNT162b2 is the first RNA vaccine to be licensed, at least for emergency use. This vaccine, along with another RNA vaccine developed by Moderna (mRNA-1273), provided greater than expected efficacy in preventing COVID-19, the onset of which began at ∼D12 after the first dose.1 The adaptive immune responses associated with the onset of vaccine efficacy thus provides a unique opportunity to glimpse the constituents of correlates of protection against COVID-19.
Efforts to identify the correlates of protection are being made by measuring the adaptive immune response longitudinally in convalescent COVID-19 cases, which has been shown to contain a spectrum of both humoral and cellular responses.5, 6, 7 Without a sizeable proportion of cases with repeat episodes of COVID-19, however, teasing apart these adaptive immune responses to identify the elements minimally required for protection will be challenging. Similar challenges apply to identifying breakthrough infection among vaccinated subjects, given the high level of vaccine efficacy. Hence, identifying elements of the adaptive immune response that develop coincidentally with vaccine efficacy onset offers at least a partial solution to this epidemiological conundrum in defining the correlates of protection.
We were able to detect anti-S antibodies at D10, with the percentage of IgG and IgA seroconversion approaching that of vaccine efficacy starting at D12. What is evident, however, is that the total antibodies developed at this early time point were either not able or were at levels insufficient to neutralize SARS-CoV-2 infection. This finding does not imply that neutralizing antibodies would not prevent COVID-19. Instead, it suggests that they are not absolutely required for protection against COVID-19. The protection coming from the humoral immune response could instead be mediated by Fc-related functions, namely ADCC, complement activation, and phagocytosis.8
We were able to detect S-reactive CD4+ and CD8+ T cells as early as D7 and D10. This early expansion of T cells may protect against SARS-CoV-2 infection at D7 and D10 and thus reduce disease onset from D12, given the COVID-19 incubation period of 2–7 days.3 Experimental SARS-CoV-2 infection in rhesus macaques have shown that T cells are indispensable for protection, especially with suboptimal neutralizing antibodies.9 The presence of S-reactive T cells, among other SARS-CoV-2 proteins, could also be associated with protection against COVID-19 despite seronegativity.10 Cellular immune response may thus be an important component of the early protection offered by RNA vaccines against COVID-19.
In conclusion, our findings provide insights into the elements of the RNA vaccine-induced adaptive immune responses that prevent COVID-19 and calls for circumspection on the prevailing view that neutralizing antibodies are required for immunity.
Limitations of study
The onset of protection from COVID-19 after vaccination was extrapolated from aggregate data from other studies. It is possible the actual timing of onset of protection may vary between individuals. This limitation is, however, unlikely to alter our conclusions as data from other studies have confirmed that the majority of vaccinees do not develop significant levels of neutralizing antibodies even at time points as late as D21 after RNA vaccination,4 well after protection against COVID-19 is definitively induced.11
STAR★Methods
Key resources table
| REAGENT or RESOURCE | SOURCE | IDENTIFIER |
|---|---|---|
| Antibodies | ||
| Anti-human IFN-γ coating antibody | Mabtech | Cat# 3420-3-1000; RRID:AB_907282 |
| Anti-human IFN-γ biotin | Mabtech | Cat# 3420-6-1000; RRID:AB_907272 |
| Anti-human CD3 BV605 | Biolegend | Cat# 317322; RRID:AB_2561911 |
| Anti-human CD8 APC-Cy7 | BD | Cat# 557834; RRID:AB_396892 |
| Anti-human IFN-g PE | R&D systems | IC285P; RRID:AB_357309 |
| Anti-human CD8 V500 | BD | Cat# 560774; RRID:AB_1937325 |
| Anti-human HLA-DR Pe-Cy7 | BD | Cat# 335795; RRID:AB_399973 |
| Anti-human CD38-V450 | BD | Cat# 561378; RRID:AB_10689627 |
| Anti-human CD69 AF700 | Biolegend | Cat# 310922; RRID:AB_493775 |
| Anti-human CD134 (OX40) PerCP-Cy5.5 | Biolegend | Cat# 350010; RRID:AB_10719224 |
| Anti-human CD137 (4-1BB) APC | BD | Cat# 550890; RRID:AB_398477 |
| Goat anti-Human IgG Fc PE | ThermoFischer | 12-4998-82 |
| Anti-6xHis-PE | Abcam | ab72467 |
| Goat Anti-Human IgM-Biotin | SouthernBiotech | 2020-08 |
| Goat Anti-Human IgA-Biotin | SouthernBiotech | 2050-08 |
| Streptavidin-PE | SouthernBiotech | 7105-09L |
| Mouse Anti-Human CD107A-BV421 | BD | 562623 |
| Mouse Anti-Human IFNγ-AF647 | BD | 554702 |
| Bacterial and virus strains | ||
| SARS-CoV-2 - BetaCoV/Singapore/2/2020 | Clinical Isolate | EPI_ISL_406973 |
| Biological samples | ||
| Blood from individuals who received the Pfizer/BioNTech BNT162b2 vaccine | Singapore General Hospital (SGH) | N/A |
| Chemicals, peptides, and recombinant proteins | ||
| Streptavidin-ALP | Mabtech | Cat# 3310-10-1000 |
| KPL BCIP/NBT Phosphotase substrate | SeraCare | Cat# 5420-0038 |
| Recombinant human IL-2 | R7D systems | Cat# 202-1L-050 |
| Yellow Live/Dead fixable dead cell stain | Invitrogen | Cat# L34959 |
| 15-mer SARS-CoV-2 overlapping Spike peptides | Mimotopes | N/A |
| BD Cytofix/Cytoperm fixation | BD Biosciences | Cat# 51-2090 KZ |
| SARS-CoV-2 Spike Protein, His Tag | AcroBiosystems | SPN-C52H4 |
| xMAP Antibody Coupling Kit | Luminex | 40-50016 |
| Luminex MagPlex-C Microspheres, Region 033 | Luminex | MC10033-01 |
| Luminex MAGPIX Performance Verification Kit (IVD) | Luminex | MPXIVD-PVER-K25 |
| Luminex MAGPIX Calibration Kit (IVD) | Luminex | MPXIVD-CAL-K25 |
| Luminex MAGPIX Drive Fluid, 4 Pack | Luminex | MPXDF-4PK-1 |
| Brefeldin A Solution (1,000X) | Biolegend | 420601 |
| GolgiStop Protein Transport Inhibitor | BD | 554724 |
| Critical commercial assays | ||
| Ella immunoassay | Protein simple | SPCKB-PS-002574 |
| cPASS™ SARS-CoV-2 Neutralization Antibody Detection Kit | GenScript | L00847-B |
| Deposited data | ||
| No unique dataset was generated | N/A | N/A |
| Experimental models: cell lines | ||
| No-GFP-CD16.NK-92 cell line (High affinity 176V) | ATCC | PTA-6967 |
| Vero-76 [clone E6, Vero E6] | ATCC | CRL-1586 |
| Software and algorithms | ||
| GraphPad Prism 9 | Graphpad | https://www.graphpad.com/scientific-software/prism/ |
| Immunospot software | Cellular Technology Limited | http://www.immunospot.com/ImmunoSpot-analyzers-software |
| FlowJo software | BD | https://www.flowjo.com/solutions/flowjo/downloads |
| R software Version 3.5.1 | 2018 The R Foundation for Statistical Computing | https://cran.r-project.org/bin/macosx/ |
| RStudio Version 1.1.453 | 2009-2019 RStudio, Inc. | https://www.rstudio.com/products/rstudio/ |
Resource availability
Lead contact
Further information and requests for resources and reagents should be directed to and will be fulfilled by the lead contact, Eng Eong Ooi (eng.eong.ooi@duke-nus.edu.sg).
Materials availability
This study did not generate new unique reagents.
Data and code availability
This study did not generate any unique datasets or new codes.
Experimental model and subject details
This study was approved by the SingHealth Centralized Institutional Review Board (CIRB/F 2021/2014). Healthcare workers from the Singapore Health Services institutions who were eligible for Covid-19 vaccination were invited to participate in this study, and written informed consent was obtained. Whole blood and serum samples were collected for serological and T cell analysis at baseline (pre-vaccination), as well as at D7, D10 and D21 after the first intramuscular dose of the Pfizer/BioNTech BNT162b2 vaccine.
Method details
Serological analysis
Spike bead-based Luminex immuno-assay
Early IgG, IgA and IgM responses in vaccinated individuals were measured using a previously described bead-based Immuno-assay.12 Recombinantly expressed pre-stabilized S-protein of SARS-CoV-2 (AcroBiosystems) were covalently conjugated to Magpix Luminex beads using the ABC coupling kit (Thermo). S-conjugated beads were then blocked with 1% BSA in 0.05% PBS-T (i.e., 0.05% tween20 in 1xPBS), and incubated for 1 hr at 37°C with serum (diluted to 1:100 in blocking buffer). For serum IgM or IgA assessment, beads were then washed, and probed with either anti-human IgM-biotin (Southern Biotech) or anti-human IgA-biotin (Southern Biotech), respectively, for 30 mins at 37°C followed by streptavidin-PE (Southern Biotech) for another 30 mins at 37°C. For IgG assessment, serum-probed beads were washed and incubated with PE-conjugated anti-human IgG secondary antibody (Thermo) for 30 mins at 37°C. S-binding antibodies were then measured on a Magpix instrument as median fluorescence intensity (MFI). All MFI values were adjusted to the quantity of S-protein on beads (which was probed using 6xHIS-PE antibodies). A 4-fold or greater increase in geometric mean Median Fluorescence Intensity (GMFI) was used as seroconversion threshold
RBD-hACE2 binding inhibition assay
Antibodies inhibiting virus binding to host cell attachment was measured using a commercial RBD-human angiotensin-converting enzyme 2 (hACE2) binding inhibition assay called cPASS™ (GenScript).13 As per manufacturer’s instructions, serum was diluted 1:10 in the kit sample buffer was mixed 1:1 with HRP-conjugated RBD and incubated for 30 mins at 37°C. RBD-antibody mixtures were then transferred and incubated for 15 mins at 37°C in enzyme-linked immunosorbent assay (ELISA) plates coated with recombinant hACE2 receptor. Following incubation, plates were washed with the kit wash solution, incubated with TMB substrate for 15 mins and reaction stopped with stop solution. Absorbance was measured at OD450 nm. Percent inhibition of RBD-hACE2 binding was computed using the following equation: . As described by the cPASS kit, a cutoff of 20% and above was used to determine positive RBD-hACE2 inhibition.
SARS-CoV-2 neutralization assay
Neutralization sero-conversion was assessed using a plaque reduction neutralization assay (PRNT) at pre-vaccination and at days 7 and 10 post-vaccination. PRNT was conducted as previously described for SARS-CoV-2.14 Briefly, heat-inactivated human were diluted 1:10 in cell culture media and incubated for 1 hr at 37°C with a Singapore clinical isolate of SARS-CoV-2 (BetaCoV/Singapore/2/2020, GISAID accession code EPI_ISL_406973). The virus-antibody immune-complexes were then transferred to 24-well plates containing Vero-E6 African green monkey kidney cells, and incubated for 1-2 hr. Cells were then overlaid with carboxymethyl cellulose (CMC) and incubated under 5% CO2 at 37°C for 5 days to allow for plaque formation. Following incubation, cells were washed, stained with crystal violet and plaques visually counted. Percentage of virus neutralization was computed following normalization of plaques in serum plus virus wells to virus only control wells. Plaque reduction neutralization test (PRNT) at a single 1:10 dilution was used to assess SARS-CoV-2 neutralizing antibodies where 50% or greater reduction of wild-type SARS-CoV-2 inoculum (PRNT50 ≥ 10) was taken as positive.
Antibody-dependent cellular cytotoxicity (ADCC) assay
ADCC inducing SARS-CoV-2 S-specific antibodies following vaccination was assessed using a natural killer (NK) cell degranulation assay as described previously.15 Briefly, NUNC Maxisorp ELISA plates were coated with 200ng/well of purified SARS-CoV-2 S-protein (overnight at 4°C). Then plates were then washed with sterile 1xPBS and blocked (with 5% BSA) overnight at 4°C. Blocked plates were incubated with diluted serum samples (1:50 in 1% BSA buffer) for 1 hr at 37°C. Plates were then washed (3x) with sterile 1xPBS and incubated with NK92.CD16 cells (ATCC PTA-6967) containing 20 μg/ml Brefeldin A, protein transport inhibitor (GolgiStop) and anti-CD107α-BV421 antibody in the cell culture media for 5 hr at 37°C in 5% CO2. Cells were then fixed and permeabilized with Cytofix/Cytoperm, stained for IFNγ (anti-IFNγ-APC), washed and the percentage of NK cells producing CD107α and IFNγ was acquired using flowcytometry (BD LSR Fortessa).
T cell analysis
SARS-CoV-2 specific T cell quantification
SARS-CoV-2-specific T cells were tested as described previously.7 Briefly, cryopreserved PBMC were thawed and directly tested by IFN-γ-ELISpot for reactivity to a pool of 55 peptides covering the immunogenic regions of the SARS-CoV-2 S-protein (S pool) which spans 40.5% of the whole SARS-CoV-2 S-protein. ELISpot plates (Millipore) were coated with human IFN-γ antibody overnight at 4°C. 400,000 PBMC were seeded per well and stimulated for 18h with the S pool at 2 μg/ml. The plates were then incubated with human biotinylated IFN-γ detection antibody, followed by Streptavidin-AP and developed using the KPL BCIP/NBT Phosphatase Substrate. To quantify positive peptide-specific responses, 2x mean spots of the unstimulated wells were subtracted from the peptide-stimulated wells, and the results expressed as spot forming cells (SFC)/106 PBMC. Results were excluded if negative control wells had > 30 SFC/106 PBMC or positive control wells (PMA/Ionomycin) were negative.
SARS-CoV-2 specific T cell lines
T cell lines were generated as previously described.12 20% of PBMCs were pulsed with 10μg/ml of the overlapping S-pool for 1 hour at 37°C, subsequently washed and co-culture with the remaining cells in AIM-V media supplemented with 2% AB human serum and 20U/ml of recombinant IL-2 for 10 days.
Flow cytometry analysis
All flow cytometry samples were analyzed using cryopreserved cells which were thawed and resuspended in AIM-V media supplemented with 2% AB serum. All samples were acquired on a BD-LSR II Analyzer (BD) and analyzed with FlowJo software (BD).
Activation induced cell marker assay
Cells were stimulated for 24 hr at 37°C with or without the S peptide pool (2μg/ml). Cells were first stained with the Fixable Near-IR Live/Dead fixable cell stain kit (Invitrogen) then with surface markers as previously described6: anti-CD3, anti-CD4, anti-CD8, anti-CD69, anti-CD134 (OX40) and anti-CD137 (4-1BB).
Intracellular cytokine staining assay
Cells were cultured with or without the S-peptide pool (2μg/ml) for 5 hours in the presence of 10ug/ml brefeldin A and 1x monesin. Cells were then stained with the LIVE/DEAD fixable dead cell stain and surface markers: anti-CD3 and anti-CD8. Cells were subsequently fixed and permeabilized using the Cytofix/Cytoperm kit and stained with anti-IFN-γ.
IFN-γ quantification of whole blood culture stimulated with SARS-CoV-2 Speptide pool
320 μL of whole blood drawn on the same day were mixed with 80 μL RPMI and stimulated with pools of the SARS-CoV-2 S-peptides at 2 μg/ml or a DMSO control as described.7 After 16 hours of culture, the culture supernatant (plasma) was collected and stored at −80°C until quantification of cytokines. Cytokine concentrations in the plasma were quantified using an Ella machine with microfluidic multiplex cartridges measuring IFN-γ following the manufacturer’s instructions (ProteinSimple). The level of cytokines present in the plasma of DMSO controls was subtracted from the corresponding peptide pool stimulated samples.
Quantification and statistical analysis
All statistical analysis were performed using GraphPad Prism v9. Where applicable, the statistical tests used, the definition of center and statistical significance were indicated in the figure legends. In all instances, “n” refers to the number of subjects analyzed.
Acknowledgments
We thank our clinical research coordinators Ms. Natalie Lee, Ms. Huizhen Sam, Ms. Christina Titin, and Ms. Charlene Cheong from the Department of Infectious Diseases, Singapore General Hospital for their tireless work. We would also like to extend our heartfelt thanks to all of the doctors and nurses in the vaccination center at the Singapore General Hospital, and all of the healthcare workers who participated in this study. This study was partially funded through a generous donation from The Hourglass to support COVID-19 research in ViREMiCS. S.K. receives salary support from the Transition Award, R.d.A. receives funding from the Open Research Fund Young Investigator Award, J.G.L. and E.E.O. receive salary support from the Clinician Scientist Award, and A.B. receives salary support from the Singapore Translational Research Award, all administered by the National Medical Research Council of Singapore. The graphical abstract was created using BioRender.com.
Author contributions
S.K., J.X.Y.S., and J.G.L. led the clinical portion of this study and enrolled the subjects. C.Y.L.T., M.Q., and J.M.E.L. conducted the T cell analyses. R.d.A., Y.S.L., H.-C.T., and S.L.Z. conducted the serological analyses. R.d.A., Y.S.L., and E.Z.O. conducted the ADCC analysis. A.S., J.X.Y., and E.Z.O. managed the sample collection, processing, and archiving. N.L. and A.T.T. analyzed the data. E.E.O. conceived the study. S.K., E.E.O., A.B., and J.G.L. analyzed the data and wrote the manuscript. E.E.O., A.B., and J.G.L. had unrestricted access to all of the data. All of the authors agreed to submit the manuscript, read and approved the final draft, and take full responsibility for its content, including the accuracy of the data.
Declaration of interests
Duke-NUS Medical School is in partnership with Arcturus Therapeutics to develop a self-replicating RNA vaccine against COVID-19, with E.E.O. as the principal investigator. No monetary or personal benefits are derived from this partnership.
Published: April 8, 2021
Footnotes
Supplemental information can be found online at https://doi.org/10.1016/j.medj.2021.04.003.
Supplemental information
References
- 1.Polack F.P., Thomas S.J., Kitchin N., Absalon J., Gurtman A., Lockhart S., Perez J.L., Pérez Marc G., Moreira E.D., Zerbini C., et al. C4591001 Clinical Trial Group Safety and Efficacy of the BNT162b2 mRNA Covid-19 Vaccine. N. Engl. J. Med. 2020;383:2603–2615. doi: 10.1056/NEJMoa2034577. [DOI] [PMC free article] [PubMed] [Google Scholar]
- 2.Skowronski D.M., De Serres G. Safety and Efficacy of the BNT162b2 mRNA Covid-19 Vaccine. N. Engl. J. Med. 2021;383:2603–2615. doi: 10.1056/NEJMoa2034577. [DOI] [PMC free article] [PubMed] [Google Scholar]
- 3.Lauer S.A., Grantz K.H., Bi Q., Jones F.K., Zheng Q., Meredith H.R., Azman A.S., Reich N.G., Lessler J. The Incubation Period of Coronavirus Disease 2019 (COVID-19) From Publicly Reported Confirmed Cases: Estimation and Application. Ann. Intern. Med. 2020;172:577–582. doi: 10.7326/M20-0504. [DOI] [PMC free article] [PubMed] [Google Scholar]
- 4.Sahin U., Muik A., Vogler I., Derhovanessian E., Kranz L.M., Vormehr M., Quandt J., Bidmon N., Ulges A., Baum A., et al. BNT162b2 induces SARS-CoV-2-neutralising antibodies and T cells in humans. medRxiv. 2020 doi: 10.1101/2020.12.09.20245175. [DOI] [Google Scholar]
- 5.Gaebler C., Wang Z., Lorenzi J.C.C., Muecksch F., Finkin S., Tokuyama M., Cho A., Jankovic M., Schaefer-Babajew D., Oliveira T.Y., et al. Evolution of antibody immunity to SARS-CoV-2. Nature. 2021;591:639–644. doi: 10.1038/s41586-021-03207-w. [DOI] [PMC free article] [PubMed] [Google Scholar]
- 6.Grifoni A., Weiskopf D., Ramirez S.I., Mateus J., Dan J.M., Moderbacher C.R., Rawlings S.A., Sutherland A., Premkumar L., Jadi R.S., et al. Targets of T Cell Responses to SARS-CoV-2 Coronavirus in Humans with COVID-19 Disease and Unexposed Individuals. Cell. 2020;181:1489–1501.e15. doi: 10.1016/j.cell.2020.05.015. [DOI] [PMC free article] [PubMed] [Google Scholar]
- 7.Le Bert N., Clapham H.E., Tan A.T., Chia W.N., Tham C.Y.L., Lim J.M., Kunasegaran K., Tan L.W.L., Dutertre C.A., Shankar N., et al. Highly functional virus-specific cellular immune response in asymptomatic SARS-CoV-2 infection. J. Exp. Med. 2021;218:e20202617. doi: 10.1084/jem.20202617. [DOI] [PMC free article] [PubMed] [Google Scholar]
- 8.Goldberg B.S., Ackerman M.E. Antibody-mediated complement activation in pathology and protection. Immunol. Cell Biol. 2020;98:305–317. doi: 10.1111/imcb.12324. [DOI] [PMC free article] [PubMed] [Google Scholar]
- 9.McMahan K., Yu J., Mercado N.B., Loos C., Tostanoski L.H., Chandrashekar A., Liu J., Peter L., Atyeo C., Zhu A., et al. Correlates of protection against SARS-CoV-2 in rhesus macaques. Nature. 2021;590:630–634. doi: 10.1038/s41586-020-03041-6. [DOI] [PMC free article] [PubMed] [Google Scholar]
- 10.Wyllie D., Mulchandani R., Jones H.E., Taylor-Phillips S., Brooks T., Charlett A., Ades A.E., Makin A., Oliver I., Moore P., et al. SARS-CoV-2 responsive T cell numbers are associated with protection from COVID-19: a prospective cohort study in keyworkers. medRxiv. 2020 doi: 10.1101/2020.11.02.20222778. [DOI] [Google Scholar]
- 11.Dagan N., Barda N., Kepten E., Miron O., Perchik S., Katz M.A., Hernán M.A., Lipsitch M., Reis B., Balicer R.D. BNT162b2 mRNA Covid-19 Vaccine in a Nationwide Mass Vaccination Setting. N. Engl. J. Med. 2021 doi: 10.1056/NEJMoa2101765. [DOI] [PMC free article] [PubMed] [Google Scholar]
- 12.Tan A.T., Linster M., Tan C.W., Le Bert N., Chia W.N., Kunasegaran K., Zhuang Y., Tham C.Y.L., Chia A., Smith G.J.D., et al. Early induction of functional SARS-CoV-2-specific T cells associates with rapid viral clearance and mild disease in COVID-19 patients. Cell Rep. 2021;34:108728. doi: 10.1016/j.celrep.2021.108728. [DOI] [PMC free article] [PubMed] [Google Scholar]
- 13.Tan C.W., Chia W.N., Qin X., Liu P., Chen M.I., Tiu C., Hu Z., Chen V.C., Young B.E., Sia W.R., et al. A SARS-CoV-2 surrogate virus neutralization test based on antibody-mediated blockage of ACE2-spike protein-protein interaction. Nat. Biotechnol. 2020;38:1073–1078. doi: 10.1038/s41587-020-0631-z. [DOI] [PubMed] [Google Scholar]
- 14.GeurtsvanKessel C.H., Okba N.M.A., Igloi Z., Bogers S., Embregts C.W.E., Laksono B.M., Leijten L., Rokx C., Rijnders B., Rahamat-Langendoen J., et al. An evaluation of COVID-19 serological assays informs future diagnostics and exposure assessment. Nat. Commun. 2020;11:3436. doi: 10.1038/s41467-020-17317-y. [DOI] [PMC free article] [PubMed] [Google Scholar]
- 15.Chung A.W., Kumar M.P., Arnold K.B., Yu W.H., Schoen M.K., Dunphy L.J., Suscovich T.J., Frahm N., Linde C., Mahan A.E., et al. Dissecting Polyclonal Vaccine-Induced Humoral Immunity against HIV Using Systems Serology. Cell. 2015;163:988–998. doi: 10.1016/j.cell.2015.10.027. [DOI] [PMC free article] [PubMed] [Google Scholar]
Associated Data
This section collects any data citations, data availability statements, or supplementary materials included in this article.
Supplementary Materials
Data Availability Statement
This study did not generate any unique datasets or new codes.