

Abstract
It is classically thought that it is the amount of salt that is critical for driving acute blood pressure responses. However, recent studies suggest that blood pressure responses, at least acutely, may relate to changes in serum osmolality. Here, we test the hypothesis that acute blood pressure responses to salt can be altered by concomitant water loading. Ten healthy patients free of any disease and medication underwent 4 interventions each a week apart in which they took 300 mL of lentil soup with no salt (visit 1), lentil soup with 3 g salt (visit 2), or lentil soup with 3 g salt and 500 mL water (visit 3) or 750 mL water (visit 4). At each visit, hourly blood measurements and blood pressure measurements (baseline, 1st, 2nd, 3rd, and 4th hour) were performed and plasma osmolarity, sodium and copeptin levels were measured. Patients receiving the 3 g salt showed a 6 mOsm/L change in osmolality with a 2.5 mmol/L change in plasma sodium and 10 mm Hg rise in systolic blood pressure at 2 hours. When the same patients drank salty soup with water, the changes in plasma osmolarity, plasma sodium, and blood pressure were prevented. The ability to raise blood pressure acutely with salt appears dependent on changes in plasma osmolality rather than the amount of salt. Our findings suggest that concurrent intake of water must be considered when evaluating the role of salt in blood pressure.
Keywords: blood pressure, copeptin, plasma osmolarity, salt intake
1. INTRODUCTION
An association of salt intake with blood pressure has been noted for at least a century, leading to low salt diets as one of the first means for treatment.1, 2 The level of salt intake roughly correlates with blood pressure in many populations.3, 4 Nevertheless, there remains controversy over the level of salt restriction that should be undertaken.5, 6 In addition, the mechanism by which salt may influence blood pressure has been evolving. Early studies focused on the Guytonian hypothesis that salt ingestion may lead to a transient increase in cardiac output and pressure natriuresis and that patients with high blood pressure showed an impaired pressure natriuresis, resulting in higher pressures to excrete the same load of salt.7 While impaired pressure natriuresis may have a role in hypertension,8, 9 recent re_analyses call this into question.10 Indeed, there has also been a shift in thinking that the effect of salt to influence BP is less related to effects on cardiac output and extracellular volume, but rather from its ability to increase serum osmolarity.11 Indeed, recent studies by Titze et al12 suggest that high salt diets may actually lead to sequestration of sodium in interstitial tissues as opposed to the more classic volume expansion and excretion.
Evidence supporting a role for salt in acutely raising blood pressure through its effects on osmolarity was provided by a study by Suckling et al.13 This group reported that the administration of a salty soup could induce an immediate rise in blood pressure, with a 1_mmol/L change in serum sodium translating into a 2_mm_Hg rise in systolic blood pressure. However, the ultimate proof would be to document that the effect of salt on blood pressure could be blunted by preventing the rise in serum sodium and osmolarity with water loading. Indeed, the importance of such a study would be to show that it is not the amount of salt that drives blood pressure, but rather how it is given, and that ingestion of salt, at least acutely, may not raise blood pressure if serum sodium and osmolarity can be kept from increasing. To investigate this hypothesis, we performed the following study.
2. MATERIALS AND METHODS
2.1. Study subjects
Ten healthy patients (2 females) without any systemic disease and receiving no medications were included to this study. The body mass index of the patients ranged from 20 to 27 (23.4__SD 3.06). The Koc University School of Medicine ethics committee approved the study protocol (2015.097.IRB2.037), and the study was registered in clinical trials NCT03314727. Written informed consent was taken from all patients before enrollment. The patients were non_smokers and they did not drink alcohol. Each patient attended nephrology clinic for 4 separate visits, 1_week apart. During all interventions, hourly blood measurements and blood pressure measurements (baseline, 1st, 2nd, 3rd, and 4th hour) were performed Figure 1. The patients did not eat and drink during experiments other than the lentil soup and water as directed. During experimental procedures, patients did not perform any physical activity.
Figure 1.
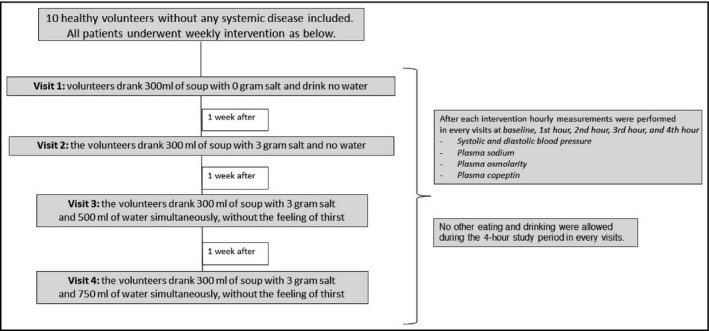
Flow diagram of the study design
After overnight fasting, patients reported to the clinical center and had baseline laboratory studies performed, which included measuring systolic and diastolic blood pressure, and the collection of serum for serum osmolality, serum sodium, and serum copeptin C_terminal provasopressin) levels Figure 1. The latter test has been shown to be an accurate reflection of circulating vasopressin levels which is the primary hormone that is modulated by osmolality.14, 15
2.2. Study protocol: dietary salt and water intervention and measured variables
We studied the dietary salt and water intervention by testing the effect of the prescribed salt intake with lentil soup. The sodium and potassium contents of the lentil soup were 30_mg and 790_mg in 100_g lentil, respectively. A dietician prepared the soup weekly with and without salt. The design of the study protocol is summarized in Figure 1.
In the first week, patients drank 300_mL of lentil soup with 0 additional grams of salt and drank no water (1st visit). No other eating and drinking were allowed during the 4_hour study period.
In the second week, the patients drank 300_mL of lentil soup with 3_g of salt added and no water (2nd visit). No other eating and drinking were allowed during the 4_hour study period.
In the third week, the patients drank 300_mL of lentil soup with 3_g of salt and 500_mL of water simultaneously, without the feeling of thirst (3rd visit). No other eating and drinking were allowed during the 4_hour study period.
In the fourth week, the patients drank 300_mL of lentil soup with 3_g of salt and 750_mL of water simultaneously, without the feeling of thirst (4th visit). No other eating and drinking were allowed during 4_hour study period. Of note, during the study period, patients did not perform any physical activity.
2.3. Serum measurements
Serum sodium, serum chloride, and serum osmolarity were determined with a cobas6000 (Roche Modular System) analyzer, using ion_selective method, and by freezing point Osmometer K_7400S (Knauer) which enables freezing point depression to be evaluated, respectively.
2.4. Blood pressure measurement
Blood pressure measurement was performed using the Omron HEM 907 oscillometric monitor (Omron Healthcare) that has been validated with a cuff size appropriate for the arm. Blood pressure measurement was done after the patients rested quietly for 5_minutes in a seated position with the arm at the level of the heart. Three consecutive recordings were made 30_seconds apart. The average of these three recordings was taken.
2.5. Copeptin analysis
For the measurement of copeptin, patients blood samples were collected into dry tubes and centrifuged immediately (3500_g) for 10_minutes at +4_C. Sera were separated in aliquots and frozen immediately at _80_C. Copeptin levels in serum were determined by Competitive_ELISA using commercial kits (Elabscience, E_EL_H0851). Intra_ and inter_CVs were <5.22 and <6.4, respectively.
2.6. Statistical analysis
Continuous variables are reported as mean with 95% confidence interval (CI). The Shapiro_Wilk test was used to assess the distribution of the continuous variables. Time repeated measurements were taken using linear mixed models including treatment, time, and the treatment by time interaction term. Since all the variables had a normal distribution, we analyzed them through mixed models for repeated measurements, adjusting for baseline values. Visit inferences, effect estimates, and 95% CIs were taken from these models. At each time, the multiple visit comparisons were corrected using the Bonferroni's method. The relationship between changes at each time point in systolic blood pressure levels and changes in serum copeptin and osmolarity concentrations were assessed using Pearson correlation coefficient. Changes in each variable were calculated as a difference from baseline values at each time point.
All analyses were performed using Stata SE software, version 12 (Stata Statistical Software: Release 12. College Station, TX, USA: StataCorp LP.). We considered a two_tailed P_<_0.05 to be significant.
3. RESULTS
3.1. The effect of salt intake with or without water supplement on systolic blood pressure
At baseline, there were no significant differences in systolic blood pressure values among the 10 patients at the four different visits Table 1. Following the ingestion of soup with or without the water supplementation, there was an increase in the systolic blood pressure in all visits (# P_<_0.001), with a significant difference in the pattern between the four visits (_ P_<_0.001; see also Figure 2A). As compared with baseline levels, there was an initial increase in systolic blood pressure values for the first 2_hours in all visits, but this difference remained significant at both 3 and 4_hours only in patients at the 2nd visit that received the high salt containing soup in the absence of hydration (adjusted mean difference at 3 and 4_hours 6.6_mm_Hg, 95% CI 4.6_8.6_mm_Hg and 6.9_mm_Hg, 95% CI 4.9_8.9_mm_Hg, respectively). At each hour interval of follow_up, the mean values of systolic blood pressure were higher at the 2nd visit as compared with the mean values at all the other visits.
Table 1.
Systolic blood pressure (SBP), osmolarity, sodium and copeptin levels evolution during the follow_up across the four study interventional visits
| _ | Baseline | 1_h | 2_h | 3_h | 4_h | P a | P b |
|---|---|---|---|---|---|---|---|
| SBP, mm_Hg | |||||||
| 1st visit | 109.6 (105.9_113.3) | 112.0* (110.6_113.5) | 111.9* (108.8_116.2) | 111.9** (110.5_113.4) | 109.4 (107.9_110.9) | <0.001 | <0.001 |
| 2nd visit | 108.5 (104.8_112.2) | 117.2*** (115.7_118.6) | 117.9*** (116.5_119.4) | 115.5*** (114.0_116.9) | 115.8*** (114.3_117.2) | ||
| 3rd visit | 109.5 (105.8_113.2) | 111.5 (110.0_112.9) | 111.9* (110.5_113.4) | 109.8 (108.3_111.2) | 109.2 (107.7_110.6) | ||
| 4th visit | 108.1 (104.4_111.8) | 111.5 (110.1_112.9) | 112.4** (110.9_113.9) | 109.2 (107.8_110.7) | 109.2 (107.8_110.7) | ||
| P c | 0.75 | <0.001 | <0.001 | 0.01 | <0.001 | ||
| Osmolarity, mOsm/L | |||||||
| 1st visit | 290.8 (286.9_294.7) | 283.9* (282.5_285.4) | 282.0*** (280.6_283.5) | 283.3*** (281.9_284.8) | 284.9 (283.5_286.4) | 0.39 | <0.001 |
| 2nd visit | 285.1 (281.2_289.0) | 289.7* (288.3_291.2) | 291.5*** (290.1_292.9) | 289.9** (288.5_291.4) | 288.4 (286.9_289.9) | ||
| 3rd visit | 281.8 (277.9_285.7) | 288.7 (287.2_290.1) | 289.2 (287.7_290.6) | 288.1 (286.6_289.5) | 286.7 (285.2_288.1) | ||
| 4th visit | 289.6 (285.7_293.5) | 285.9 (284.4_287.3) | 284.9 (283.4_286.3) | 284.9 (283.4_286.3) | 284.7 (283.2_286.1) | ||
| P c | 0.001 | 0.23 | 0.15 | 0.19 | 0.04 | ||
| Sodium, mmol/L | |||||||
| 1st visit | 142.0 (141.2_142.8) | 139.8* (139.3_140.4) | 138.9*** (138.4_139.5) | 140.0*** (139.5_140.6) | 140.8 (140.3_141.4) | 0.79 | <0.001 |
| 2nd visit | 141.6 (140.8_142.4) | 143.1* (142.6_143.7) | 144.2*** (143.7_144.8) | 143.1** (142.6_143.7) | 142.7 (142.2_143.3) | ||
| 3rd visit | 141.8 (140.9_142.6) | 142.6 (142.0_143.1) | 142.6 (142.0_143.1) | 141.9 (141.4_142.5) | 141.8 (141.2_142.3) | ||
| 4th visit | 141.7 (140.9_142.6) | 141.8 (141.2_142.3) | 141.6 (140.9_142.1) | 141.4 (140.8_141.9) | 141.5 (140.9_142.0) | ||
| P c | 0.89 | <0.001 | <0.001 | <0.001 | <0.001 | ||
| Copeptin, pmol/L | |||||||
| 1st visit | 86.9 (76.2_97.7) | 75.0* (75.4_79.3) | 73.7*** (71.8_75.7) | 74.7*** (72.7_76.7) | 75.7 (73.8_77.7) | 0.11 | <0.001 |
| 2nd visit | 70.1 (59.3_80.8) | 82.7* (80.7_84.6) | 85.4*** (83.4_83.4) | 81.9** (79.9_83.9) | 81.1 (79.2_83.1) | ||
| 3rd visit | 76.7 (65.9_87.4) | 77.3 (75.4_79.2) | 77.4 (75.5_79.3) | 75.3 (73.3_77.2) | 75.3 (73.4_77.2) | ||
| 4th visit | 75.0 (64.3_85.8) | 74.8 (72.8_76.7) | 73.8 (71.9_75.7) | 72.2 (70.3_74.1) | 74.3 (72.4_76.3) | ||
| P c | 0.11 | <0.001 | <0.001 | <0.001 | <0.001 | ||
Data are presented as mean (95% CI) at baseline, and least_squares mean (95% CI) at 1, 2, 3, and 4_hours. Analysis was conducted using a mixed model for repeated measures, adjusting for baseline values.
P value for time effect_trend over time in all arms.
P value for treatment___time interaction_evaluates if changes at one visit are different from the changes at other visits.
P value for comparison between visits at each moment.
Statistical significance vs baseline levels: P_<_0.05.
P_<_0.01.
P_<_0.001.
Figure 2.
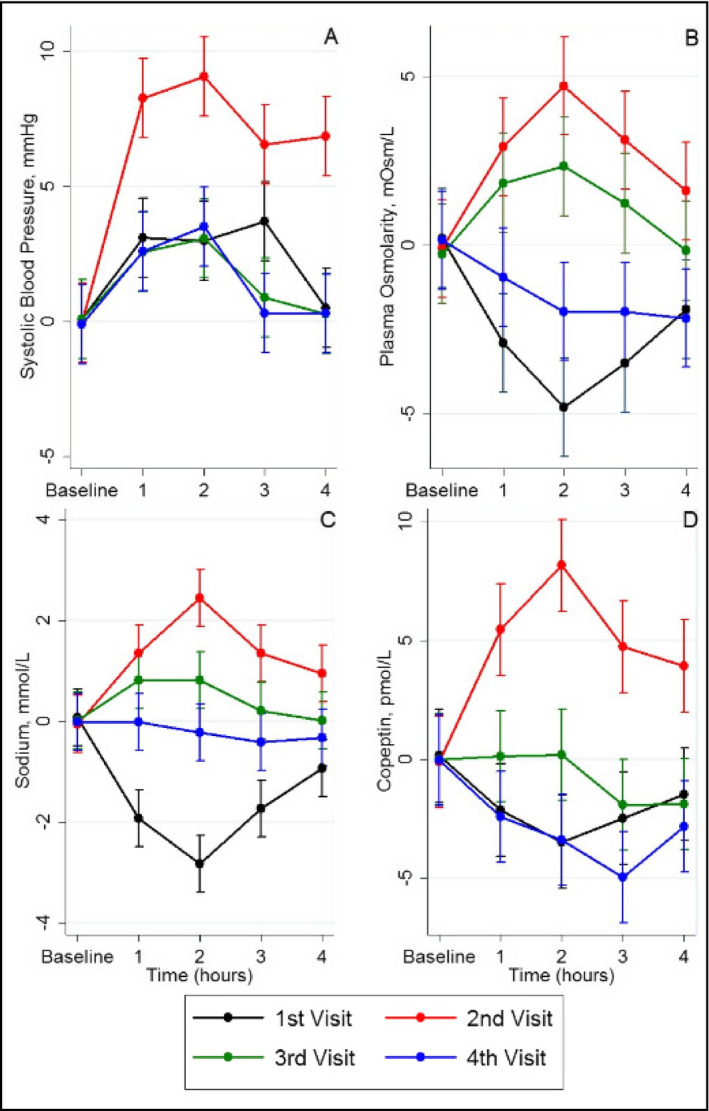
Changes in systolic blood pressure (A), plasma osmolarity (B), sodium (C) and copeptin (D) values during the follow_up in the 4 visits of patients
Similar patterns were observed also for diastolic blood pressure, with an increase in the mean values across the follow_up, but with a significant difference in the slope among the 4 visits (Table S1 and Figure 3. Similarly, there was an initial increase in diastolic blood pressure levels in all visits during the first 2_hours, but this difference remained significant for the last 2_hours only for the visits in which patients received salt alone (visit 2) or with 500_cc of water (visit 3).
Figure 3.

Changes in diastolic blood pressure values during the follow_up in the 4 visits of patients
3.2. The effect of interventions on plasma osmolarity, serum sodium, and copeptin
Plasma osmolality, serum sodium, and serum copeptin were followed serially following intake of soup for each visit Figure 2B_D). The intake of soup containing an additional 3_g of salt resulted in a maximum rise at 2_hours in plasma osmolality 6_mosm/L), serum sodium 2.6_mmol/L), and serum copeptin15_pmol/L) in the visit receiving salt alone without water visit 2). In contrast, patients receiving soup that did not contain added salt visit 1) had a decrease in plasma osmolality, serum sodium, and serum copeptin. Patients receiving 500_mL water showed an intermediate change in osmolality, serum sodium, and copeptin, while patients receiving 750_mL of water had minimal changes in serum sodium and copeptin levels and a fall in plasma osmolality. The pattern of osmolality and blood pressure over time is shown in Figures 2 and 3.
3.3. The correlation between changes in systolic blood pressure and changes in copeptin and serum osmolarity
When all data from the 4 visits were analyzed n_=_160), there were significant correlations between changes in systolic blood pressure and changes in copeptin levels r_=_0.470 P_<_0.0001), changes in serum osmolality r_=_0.272, P_=_0.0005), and changes serum Na r_=_0.253,P_=_0.0012). Correlations showing the relationship with time following soup ingestion are shown in Table 2. The highest correlation was found between the 1_hour post_meal changes in serum copeptin levels and the changes in systolic blood pressure Figure 4.
Table 2.
Correlations between changes in systolic blood pressure (SBP) and changes in plasma copeptin and plasma osmolarity at each time point
| _ | 1_h | 2_h | 3_h | 4_h | ||||
|---|---|---|---|---|---|---|---|---|
| corr. coeff. | P | corr. coeff. | P | corr. coeff. | P | corr. coeff. | P | |
| Delta Copeptin and SBP | ||||||||
| All groups | 0.528 | 0.001 | 0.483 | 0.002 | 0.408 | 0.01 | 0.437 | 0.005 |
| Delta Osmolarity and SBP | ||||||||
| All groups | 0.366 | 0.02 | 0.466 | 0.002 | 0.140 | 0.39 | 0.392 | 0.01 |
All the analyses were conducted using Pearson correlation analysis. Changes in each variable were calculated as a difference from baseline values at each time point.
Figure 4.

Scatter plot of changes in systolic blood pressure and changes in copeptin levels observed in the first hour of each of the 4 visits of the study. (r_=_0.528, P_=_0.0002)
4. DISCUSSION
Here, we tested the hypothesis that the effect of salt to raise blood pressure acutely is not related to the amount of salt ingested, but rather to the effect of salt on serum osmolarity and sodium. Specifically, patients were administered 3_g of salt with or without a water load. Patients receiving the 3_g salt showed a 6_mOsm/L change in osmolarity with a 2.5_mOsml/L change in serum Na and 10_mm_Hg rise in systolic blood pressure at 2_hours. However, when the same patients took the salty soup with additional water, the effect of salt on serum osmolarity and sodium was blunted.
Many studies have shown that increments in osmolality in plasma and cerebrospinal fluid increase blood pressure.16, 17, 18 The osmotic sensitive neurons are, by the most part, located in subfornical areas,19, 20 and since they are placed outside the blood_brain barrier, they are able to respond to osmotic changes in the plasma and in the cerebrospinal fluid.21 It is also known that the ability of hyperosmotic solutions to increase arterial blood pressure depends on the solute. Hypertonic sodium solutions induce greater increments in blood pressure than hypertonic sorbitol or mannitol solutions when injected in the cerebrospinal fluid or in plasma,22, 23 and recent studies have documented that subsets of osmosensitive neurons have a heightened response to hypertonic sodium in relation to equiosmolar stimulation by mannitol.23
In our studies, we show that the acute rise in blood pressure resulting from oral salt administration does not depend on the salt load but, instead is driven by the increments in sodium and osmolarity over baseline. From a practical standpoint, our study suggests that guidelines that recommend only sodium restriction should also to take into account the relative intake of water.
The mechanisms involved in the blood pressure increment induced by salt are incompletely understood. Not only do osmosensitive neurons stimulate central nervous system sympathetic activity24 but salt activates T cells by osmolar_mediated pathways which may play a role in the development of T_cell_mediated autoimmune inflammation in the kidney and arterial walls.25 Other potential mechanisms include effects on vasopressin26, 27 or by stimulating endogenous cardiotonic steroids such as ouabain and marinobufagenin.28 High salt_induced osmolality may also stimulate the aldose reductase_fructokinase pathway in the hypothalamus that might mediate blood pressure responses.29, 30 Thus, salt_induced hyperosmolarity may be involved in both classical renal and central nervous system blood pressure control mechanisms.
In this study, we also measured serum copeptin, which is a marker of vasopressin release, which increases in the setting of increased serum osmolality. As expected, we found a significant increase in copeptin levels with salt ingestion, which was blunted by the intake of water. Copeptin is increasingly recognized as being elevated in patients with hypertension and metabolic syndrome.31, 32, 33, 34, 35 Recent studies have demonstrated increased serum copeptin levels in patients with elevated office and ambulatory blood pressure measurements32, 36 as well as those with resistant hypertension.37 Increased local tissue renin‐angiotensin‐aldosterone system activation, enhanced vasoconstriction,32 and increased tubular sodium retention38 are hypothesized to also play a role in the copeptin related effects on blood pressure in addition to the osmotic mechanisms described above.
A previous study showed that a 6 g salt ingestion was associated with an increase in serum osmolarity and sodium levels, with an associated increase in systolic blood pressure values.13 Although we used half of that quantity of salt and obtained a subsequent smaller increase in systolic blood pressure levels, our results showed a similar pattern. Furthermore, in our study the maximum effect of salt intake on blood pressure was seen at the 2_hour follow_up, a time point that coincides with the maximum rise in serum osmolarity, sodium and copeptin levels, adding more support to the aforementioned (patho)physiological pathways. In addition, the ingestion of water, at the time of salt intake, mitigated the increase in serum sodium and osmolarity immediately, and patients at these visits showed significantly lower systolic blood pressure levels than at the visit with only salt intake at each time point.
This study has some limitations. First, the sample size is small. Second, our studies were performed on healthy patients and their relevance to hypertensive patients needs to be confirmed in subsequent studies. Third, the order in which the study was done was not randomized, and the washout period between each visit was limited to one week. Fourth, we did not measure urinary sodium excretion or changes in extracellular volume. The latter added a considerable difficulty to a design that included 4 experimental periods to each patient. Lastly, we made these experiments with the hypothesis that water intake, without feeling thirst, will hamper the elevation of serum osmolarity and thus the stimulation of ADH copeptin secretion). However, in response to small increases in plasma osmolality, vasopressin release occurs before thirst is triggered.39 Another limitation is the lack of evaluation of renin‐angiotensin‐aldosterone system (RAAS). RAAS is very important factor involved in the regulation of sodium and volume. RAAS and ADH (copeptin) may have bi_directional relationships, in terms of effects on salt and extracellular volume. Finally, our studies only evaluated the acute effects of changing serum sodium and osmolarity on blood pressure. Chronic effects of high sodium intake bring into play compensatory mechanisms, and our studies are not applicable to long_term blood pressure responses to sodium loading.
In conclusion, we showed that the acute effects of salt intake on blood pressure increase are associated with an increase in serum osmolality, sodium and copeptin levels, and that concurrent water intake that prevents the changes in osmolarity can mitigate the rise in blood pressure. Therefore, water intake represents an important modulator of the blood pressure response to salt.
CONFLICT OF INTEREST
The authors declare that they have no conflict of interest.
Supporting information
Kanbay M, Aslan G, Afsar B, et al. Acute effects of salt on blood pressure are mediated by serum osmolality. J Clin Hypertens. 2018;20:1447‐1454. 10.1111/jch.13374
REFERENCES
- 1. Allen FM, Sherrill JW. The treatment of arterial hypertension. J Metabol Research. 1922;2:429_545. [Google Scholar]
- 2. Allen FM. Arterial hypertension. JAMA. 1920;74:652_655. [Google Scholar]
- 3. Dahl LK. Possible role of salt intake in the development of essential hypertension. In: Cottier P, Bock K, eds. Essential Hypertension _ an International Symposium. Berlin: Springer; 1960:53_65. [DOI] [PubMed] [Google Scholar]
- 4. MacGregor GA. Sodium is more important than calcium in essential hypertension. Hypertension. 1985;7(4):628_640. [DOI] [PubMed] [Google Scholar]
- 5. He FJ, MacGregor GA. How far should salt intake be reduced? Hypertension. 2003;42(6):1093_1099. [DOI] [PubMed] [Google Scholar]
- 6. Graudal N, Jurgens G, Baslund B, Alderman MH. Compared with usual sodium intake, low_ and excessive_sodium diets are associated with increased mortality: a meta_analysis. Am J Hypertens. 2014;27(9):1129_1137. [DOI] [PubMed] [Google Scholar]
- 7. Guyton AC, Coleman TG, Fourcade JC, Navar LG. Physiologic control of arterial pressure. Bull N Y Acad Med. 1969;45(9):811_830. [PMC free article] [PubMed] [Google Scholar]
- 8. Hall JE, Mizelle HL, Hildebrandt DA, Brands MW Abnormal pressure natriuresis. A cause or a consequence of hypertension? Hypertension. 1990;15(6 Pt 1):547_559. [DOI] [PubMed] [Google Scholar]
- 9. Franco M, Tapia E, Bautista R, et al. Impaired pressure natriuresis resulting in salt_sensitive hypertension is caused by tubulointerstitial immune cell infiltration in the kidney. Am J Physiol Renal Physiol. 2013;304(7):F982_F990. [DOI] [PMC free article] [PubMed] [Google Scholar]
- 10. Kurtz TW, DiCarlo SE, Morris RC Jr. Logical issues with the pressure natriuresis theory of chronic hypertension. Am J Hypertens. 2016;29(12):1325_1331. [DOI] [PMC free article] [PubMed] [Google Scholar]
- 11. de Wardener HE, He FJ, MacGregor GA. Plasma sodium and hypertension. Kidney Int. 2004;66(6):2454_2466. [DOI] [PubMed] [Google Scholar]
- 12. Rakova N, Kitada K, Lerchl K, et al. Increased salt consumption induces body water conservation and decreases fluid intake. J Clin Invest. 2017;127(5):1932_1943. [DOI] [PMC free article] [PubMed] [Google Scholar]
- 13. Suckling RJ, He FJ, Markandu ND, MacGregor GA. Dietary salt influences postprandial plasma sodium concentration and systolic blood pressure. Kidney Int. 2012;81(4):407_411. [DOI] [PubMed] [Google Scholar]
- 14. Morgenthaler NG, Struck J, Alonso C, Bergmann A. Assay for the measurement of copeptin, a stable peptide derived from the precursor of vasopressin. Clin Chem. 2006;52(1):112_119. [DOI] [PubMed] [Google Scholar]
- 15. Khan SQ, Dhillon OS, O'Brien RJ, et al. C_terminal provasopressin (copeptin) as a novel and prognostic marker in acute myocardial infarction: Leicester Acute Myocardial Infarction Peptide (LAMP) study. Circulation. 2007;115(16):2103_2110. [DOI] [PubMed] [Google Scholar]
- 16. Buggy J, Hoffman WE, Phillips MI, Fisher AE, Johnson AK. Osmosensitivity of rat third ventricle and interactions with angiotensin. Am J Physiol. 1979;236(1):R75_R82. [DOI] [PubMed] [Google Scholar]
- 17. Dunn FL, Brennan TJ, Nelson AE, Robertson GL. The role of blood osmolality and volume in regulating vasopressin secretion in the rat. J Clin Invest. 1973;52(12):3212_3219. [DOI] [PMC free article] [PubMed] [Google Scholar]
- 18. Thompson CJ, Bland J, Burd J, Baylis PH. The osmotic thresholds for thirst and vasopressin release are similar in healthy man. Clin Sci (Lond). 1986;71(6):651_656. [DOI] [PubMed] [Google Scholar]
- 19. McKinley MJ, Denton DA, Leventer M, Penschow J, Weisinger RS, Wright RD. Morphology of the organum vasculosum of the lamina terminalis (OVLT) of the sheep. Brain Res Bull. 1983;11(6):649_657. [DOI] [PubMed] [Google Scholar]
- 20. Kinsman BJ, Nation HN, Stocker SD. Hypothalamic signaling in body fluid homeostasis and hypertension. Curr Hypertens Rep. 2017;19(6):50. [DOI] [PubMed] [Google Scholar]
- 21. Broadwell RD, Brightman MW. Entry of peroxidase into neurons of the central and peripheral nervous systems from extracerebral and cerebral blood. J Comp Neurol. 1976;166(3):257_283. [DOI] [PubMed] [Google Scholar]
- 22. Frithiof R, Xing T, McKinley MJ, May CN, Ramchandra R. Intracarotid hypertonic sodium chloride differentially modulates sympathetic nerve activity to the heart and kidney. Am J Physiol Regul Integr Comp Physiol. 2014;306(8):R567_R575. [DOI] [PMC free article] [PubMed] [Google Scholar]
- 23. Kinsman BJ, Browning KN, Stocker SD. NaCl and osmolarity produce different responses in organum vasculosum of the lamina terminalis neurons, sympathetic nerve activity and blood pressure. J Physiol. 2017;595(18):6187_6201. [DOI] [PMC free article] [PubMed] [Google Scholar]
- 24. Toney GM, Stocker SD. Hyperosmotic activation of CNS sympathetic drive: implications for cardiovascular disease. J Physiol. 2010;588(Pt 18):3375_3384. [DOI] [PMC free article] [PubMed] [Google Scholar]
- 25. Rodriguez_Iturbe B, Pons H, Johnson RJ. Role of the immune system in hypertension. Physiol Rev. 2017;97(3):1127_1164. [DOI] [PMC free article] [PubMed] [Google Scholar]
- 26. Bankir L, Bichet DG, Bouby N. Vasopressin V2 receptors, ENaC, and sodium reabsorption: a risk factor for hypertension? Am J Physiol Renal Physiol. 2010;299(5):F917_F928. [DOI] [PubMed] [Google Scholar]
- 27. Koshimizu TA, Nakamura K, Egashira N, Hiroyama M, Nonoguchi H, Tanoue A. Vasopressin V1a and V1b receptors: from molecules to physiological systems. Physiol Rev. 2012;92(4):1813_1864. [DOI] [PubMed] [Google Scholar]
- 28. Fedorova OV, Shapiro JI, Bagrov AY. Endogenous cardiotonic steroids and salt_sensitive hypertension. Biochim Biophys Acta. 2010;1802(12):1230_1236. [DOI] [PMC free article] [PubMed] [Google Scholar]
- 29. Song Z, Roncal_Jimenez CA, Lanaspa_Garcia MA, et al. Role of fructose and fructokinase in acute dehydration_induced vasopressin gene expression and secretion in mice. J Neurophysiol. 2017;117(2):646_654. [DOI] [PMC free article] [PubMed] [Google Scholar]
- 30. Lanaspa MA, Kuwabara M, Andres_Hernando A, et al. High salt intake causes leptin resistance and obesity in mice by stimulating endogenous fructose production and metabolism. Proc Natl Acad Sci USA. 2018. [DOI] [PMC free article] [PubMed] [Google Scholar]
- 31. Enhorning S, Struck J, Wirfalt E, Hedblad B, Morgenthaler NG, Melander O. Plasma copeptin, a unifying factor behind the metabolic syndrome. J Clin Endocrinol Metab. 2011;96(7):E1065_E1072. [DOI] [PubMed] [Google Scholar]
- 32. Tenderenda_Banasiuk E, Wasilewska A, Filonowicz R, Jakubowska U, Waszkiewicz_Stojda M. Serum copeptin levels in adolescents with primary hypertension. Pediatr Nephrol. 2014;29(3):423_429. [DOI] [PMC free article] [PubMed] [Google Scholar]
- 33. Enhorning S, Bankir L, Bouby N, et al. Copeptin, a marker of vasopressin, in abdominal obesity, diabetes and microalbuminuria: the prospective Malmo Diet and Cancer Study cardiovascular cohort. Int J Obes (Lond). 2013;37(4):598_603. [DOI] [PubMed] [Google Scholar]
- 34. Enhorning S, Leosdottir M, Wallstrom P, et al. Relation between human vasopressin 1a gene variance, fat intake, and diabetes. Am J Clin Nutr. 2009;89(1):400_406. [DOI] [PubMed] [Google Scholar]
- 35. Enhorning S, Wang TJ, Nilsson PM, et al. Plasma copeptin and the risk of diabetes mellitus. Circulation. 2010;121(19):2102_2108. [DOI] [PMC free article] [PubMed] [Google Scholar]
- 36. Schoen T, Hohmann EM, Van Der Lely S, et al. Plasma copeptin levels and ambulatory blood pressure characteristics in healthy adults. J Hypertens. 2015;33(8):1571_1579. [DOI] [PubMed] [Google Scholar]
- 37. Mendes M, Dubourg J, Blanchard A, et al. Copeptin is increased in resistant hypertension. J Hypertens. 2016;34(12):2458_2464. [DOI] [PubMed] [Google Scholar]
- 38. Perucca J, Bichet DG, Bardoux P, Bouby N, Bankir L. Sodium excretion in response to vasopressin and selective vasopressin receptor antagonists. J Am Soc Nephrol. 2008;19(9):1721_1731. [DOI] [PMC free article] [PubMed] [Google Scholar]
- 39. Gizowski C, Zaelzer C, Bourque CW. Clock_driven vasopressin neurotransmission mediates anticipatory thirst prior to sleep. Nature. 2016;537(7622):685_688. [DOI] [PubMed] [Google Scholar]
Associated Data
This section collects any data citations, data availability statements, or supplementary materials included in this article.
Supplementary Materials