

Abstract
The authors conducted a national cross‐sectional cohort study to evaluate the associations between pulse pressure (PP) and body mass index (BMI) and sex, according to blood pressure (BP) status. A total of 18 812 patients without a history of antihypertensive medication and cardiovascular disease were selected. There was good concordance between PP and the selected cardiovascular risk factors. PP increased with high BMI among patients with normal BP, but decreased with high BMI among patients with hypertension (HTN). BMI (ß, −0.260; SE, 0.039 [P<.001]) and male sex (ß, −4.727; SE, 1.100 [P<.001]) were negatively correlated with PP in a multivariate model adjusted for several risk factors in patients with HTN. In conclusion, PP was negatively correlated with BMI in patients with HTN, which may explain the higher cardiovascular risk in lean persons and women with HTN.
Keywords: age, body mass index, pulse pressure, sex, Keywordsage, body mass index, Pulse pressure, sex
1. Introduction
Pulse pressure (PP) is a good predictor of cardiovascular (CV) events and in some cases has superior predictive capability to that provided by systolic blood pressure (SBP) alone. In addition, the combinations of PP with mean arterial pressure and SBP with diastolic blood pressure (DBP) are superior to single blood pressure (BP) components for predicting CV disease.1, 2, 3, 4
An increase in PP leads to greater stress on arteries, resulting in an increased fracture rate in the elastic components. The vascular intima becomes susceptible to damage, thereby increasing the risk of atherosclerosis and thrombosis. In addition to vascular damage, increased PP is associated with increased stress on the heart, which can result in heart disease.5 The Multiple Risk Factor Intervention Trial (MRFIT) revealed that the risk of CV mortality was 22% higher for patients in the highest PP quartile, compared with those in the lowest PP quartile, particularly among older men.6 Furthermore, in patients with heart failure with preserved ejection fraction, there is a significant positive association between PP and mortality.7
Although studies have shown that factors such as body mass index (BMI) and microalbuminuria are associated with PP,8, 9 the relationship between PP and CV risk factors remains unknown. Therefore, we evaluated the relationship between PP and certain CV risk factors such as BMI, age, sex, cholesterol levels, glucose levels, and smoking status.
2. Materials and methods
2.1. Study population
This study analyzed data from the Korea National Health and Nutrition Examination Survey (KNHANES) V (2010–2012), which was a cross‐sectional nationwide survey using a stratified, multistage, probability cluster sampling method in a rolling sample of the general population of South Korea. It included comprehensive information on health status, health behavior, and sociodemographic characteristics. Face‐to‐face interviews at the patients' homes were conducted by trained interviewers and included the nutrition survey. Details of KNHANES have been previously described.10
Of the 34 052 KNHANES patients who completed the health interview and health examinations surveys during 2010–2012, 25 947 patients aged 19 years and older were selected for our analysis. Patients with a history of hypertensive medication use (n=5069), stroke (n=167), myocardial infarction/angina (n=333), or missing data (n=1566) were sequentially excluded. Finally, 18 812 patients were included in the analyses (Figure 1).
Figure 1.
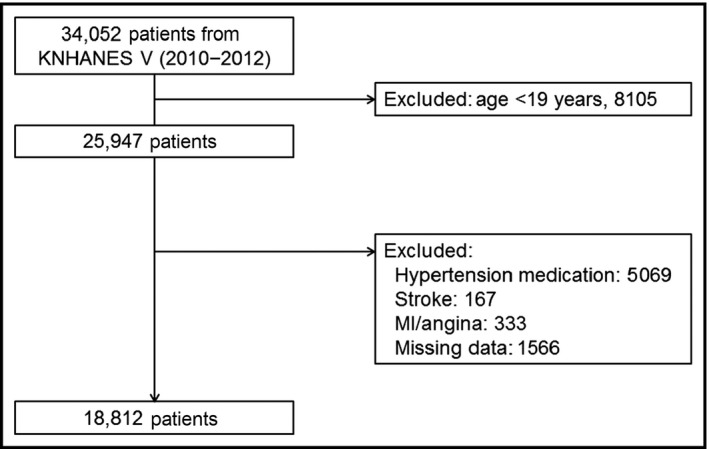
Study protocol using data for 18 812 healthy patients from the Korea National Health and Nutrition Examination Survey (KNHANES) V (2010–2012), which is a cross‐sectional nationwide survey. MI indicates myocardial infarction
All procedures and protocols of the study were approved by the institutional review board of the Korea Centers for Disease Control and Prevention. Written informed consent regarding the survey and blood analysis was obtained from all patients.
2.2. Data collection
2.2.1. Health examination and interview
Trained medical staff and interviewers performed the health interview and health examination survey in mobile examination centers. During the health interview, detailed information on smoking, prior diagnosis of hypertension (HTN) or diabetes by a physician, and current use of hypotensive or hypoglycemic agents was collected.
2.2.2. Measurement of BP and BMI
Trained and quality‐controlled examiners manually measured BP using a mercury sphygmomanometer while the patient was seated. The patients were asked to refrain from smoking for 30 minutes before the measurement and rested for 5 minutes before the measurements. Three measurements were obtained with 30‐second intervals. The average of the second and third measurements was used as the mean SBP or DBP value. PP was obtained by subtracting DPB from SBP, and the patients were categorized into four PP groups, by quartile (PP I: PP ≤33 mm Hg, n=4878 [25.9%]; PP II: PP 34–39 mm Hg, n=5241 [27.9%]; PP III: PP 40–46 mm Hg, n=4311 [22.9%]; and PP IV: PP ≥47 mm Hg, n=4382 [23.2%]).
BMI was calculated as weight divided by height squared (kg/m2). The patients were divided into four BMI groups based on the World Health Organization recommendations for the Asian population: underweight (group I: <18.5 kg/m2); normal weight (group II: ≥18.5 and <23.0 kg/m2); overweight (group III: ≥23.5 and <27.5 kg/m2); and obese (group IV: ≥27.5 kg/m2).11 We also stratified the patients by BP (HTN was defined as SBP ≥140 mm Hg or DBP ≥90 mm Hg) for further analyses of differences by BMI.
2.2.3. Blood sample collection and biochemical analysis
Blood samples were obtained from all patients in the morning after a ≥8‐hour fast. To analyze blood lipid levels, blood samples were stored in an 8‐mL serum separating tube at room temperature for 30 minutes, and the blood was subsequently centrifuged at 1077 × g (RCF) for 15 minutes. All blood samples were refrigerated at 2–8°C and immediately transported to the central laboratory. Plasma glucose and lipid concentrations were assayed using a Hitachi Automatic Analyzer 7600 (Hitachi, Tokyo, Japan) within 24 hours after blood sampling.
2.3. Statistical analysis
All analyses were performed using SPSS version 21.0 (IBM Corp, Armonk, NY). Baseline data are presented as frequencies or mean and SD. Continuous variables were compared using ANOVA, and categorical variables were compared using χ2 tests.
Associations between PP‐related factors and risk factors were analyzed using univariate logistic regression analysis for complex sampling adjusted for the following variables: age, SBP, DBP, waist circumference, BMI, fasting glucose, total cholesterol, high‐density lipoprotein cholesterol (HDL‐C), triglycerides, low‐density lipoprotein cholesterol (LDL‐C), vitamin D, urinary sodium, smoking status, and male sex. The results are presented as odds ratios with 95% CIs. In addition, we examined the data using multivariable logistic regression models. Two multivariable models were constructed: model I used patients with normal BP (SBP <140 mm Hg and DBP <90 mm Hg), while model II used patients with HTN (SBP ≥140 mm Hg or DBP ≥90 mm Hg). These models were adjusted for age, BMI, fasting glucose, LDL‐C, vitamin D, urinary sodium, and male sex.
3. Results
3.1. Baseline characteristics
The general characteristics of the four PP groups are listed in Table 1. Compared with patients in the lower PP groups, those in the higher PP groups were more likely to have HTN, diabetes, or dyslipidemia and to be men. Patients in the higher PP groups were also older, had higher total cholesterol and LDL‐C levels, and had lower HDL‐C levels than those in the lower PP groups. There were greater proportions of patients who reported never smoking in the lower PP groups.
Table 1.
Baseline Characteristics
| Pulse Pressure Group | Group I | Group II | Group III | Group IV | P Value |
|---|---|---|---|---|---|
| No. (%) | 4878 (25.9) | 5241 (27.9) | 4311 (22.9) | 4382 (23.3) | |
| Pulse pressure, mm Hg | 29.6±3.0 | 36.5±1.7 | 42.5±2.0 | 57.1±10.3 | <.001 |
| Age, y | 40.1±12.0 | 42.5±12.9 | 46.5±14.9 | 58.8±15.6 | <.001 |
| Male, No. (%) | 1912 (39.4) | 2191 (41.8) | 1958 (45.4) | 1946 (44.4) | <.001 |
| Hypertension, No. (%) | 56 (1.1) | 72 (1.4) | 141 (3.3) | 325 (7.4) | <.001 |
| Diabetes, No. (%) | 126 (2.6) | 137 (2.6) | 189 (4.4) | 448 (10.2) | <.001 |
| Dyslipidemia, No. (%) | 215 (4.4) | 302 (5.8) | 302 (7.0) | 423 (9.7) | <.001 |
| SBP, mm Hg | 104.0±9.4 | 111.1±9.7 | 118.8±11.1 | 134.6±15.8 | <.001 |
| DBP, mm Hg | 74.5±9.1 | 74.6±9.5 | 76.2±10.8 | 77.5±12.0 | <.001 |
| Waist circumference, cm | 77.3±10.0 | 79.4±9.6 | 81.1±9.7 | 82.2±9.3 | <.001 |
| BMI, kg/m2 | 22.7±3.3 | 23.2±3.3 | 23.7±3.4 | 23.7±3.2 | <.001 |
| FBS, mg/dL | 92.0±16.9 | 93.5±18.6 | 96.2±21.7 | 100.6±23.8 | <.001 |
| TC, mg/dL | 186.3±34.8 | 187.9±34.7 | 191.5±35.9 | 196.3±39.6 | <.001 |
| TGs, mg/dL | 117.1±87.9 | 122.1±108.9 | 130.1±103.6 | 141.2±116.0 | <.001 |
| HDL‐C, mg/dL | 54.4±12.8 | 54.0±12.9 | 53.4±12.7 | 52.5±13.0 | <.001 |
| LDL‐C, mg/dL | 113.2±32.3 | 114.1±31.7 | 114.5±32.7 | 119.6±34.4 | <.001 |
| Vitamin D, ng/mL | 16.5±5.6 | 17.0±5.6 | 17.2±5.9 | 18.1±6.1 | <.001 |
| Creatinine, mg/dL | 0.82±0.25 | 0.81±0.16 | 0.82±0.19 | 0.82±0.18 | .708 |
| Urine sodium, mmol/L | 121.6±51.6 | 126.4±53.0 | 128.1±52.4 | 135.8±52.5 | <.001 |
| Smoking status, No. (%) | <.001 | ||||
| Never smoker | 2960 (60.7) | 3087 (59.1) | 2493 (58.0) | 2515 (57.6) | |
| Ex‐smoker | 804 (16.5) | 927 (17.7) | 836 (19.4) | 945 (21.6) | |
| Current smoker | 1109 (22.8) | 1210 (23.2) | 970 (22.6) | 908 (20.8) |
Pulse pressure group: evenly divided into four groups. BMI indicates body mass index; DBP, diastolic blood pressure; FBS, fasting blood sugar; HDL‐C, high‐density lipoprotein cholesterol; LDL‐C, low‐density lipoprotein cholesterol; SBP, systolic blood pressure; TC, total cholesterol; TGs, triglycerides.
3.2. Relationships with PP based on BP, sex, and age
Older patients (>60 years) had higher SBP, DBP, and PP than younger patients (Table 2). SBP and DBP increased with increasing age; however, DBP decreased at ages ≥50 years. Therefore, PP increased with age, and the increase was significantly greater in those aged ≥50 years (Figure 2A).
Table 2.
Blood Pressure Component According to BMI, Sex, and Age
| Pulse Pressure, mm Hg | Systolic Pressure, mm Hg | Diastolic Pressure, mm Hg | P Value | |
|---|---|---|---|---|
| BMI | ||||
| Group I (n=1013, 5.4%) | 38.5±11.9 | 109.5±15.6 | 70.9±8.2 | <.001 |
| Group II (n=9333, 49.9%) | 40.4±11.5 | 114.0±15.8 | 73.6±9.6 | |
| Group III (n=6480, 34.6%) | 41.7±11.1 | 119.4±15.8 | 77.7±10.4 | |
| Group IV (n=1885, 10.1%) | 42.1±11.2 | 123.2±15.6 | 81.2±10.8 | |
| Sex | ||||
| Male (n=8016, 42.6%) | 41.2±11.1 | 120.1±15.1 | 78.8±10.6 | <.001 |
| Female (n=10 796, 57.4%) | 40.6±11.6 | 113.8±15.1 | 73.2±9.5 | |
| Age | ||||
| Old age (n=4166, 22.1%) | 50.9±38.0 | 126.2±17.6 | 75.4±9.9 | <.001 |
| Young age (n=14646, 22.1%) | 50.9±14.0 | 113.7±14.6 | 75.7±10.5 | .069 |
Body mass index (BMI) groups: underweight (group I: BMI <18.5 kg/m2); normal weight (group II: 18.5≤BMI<23.0 kg/m2); overweight (group III: 23.5≤BMI<27.5 kg/m2); and obese (group IV: BMI ≥27.5 kg/m2). Old age indicates ≥60 years and young age <60 years.
Figure 2.
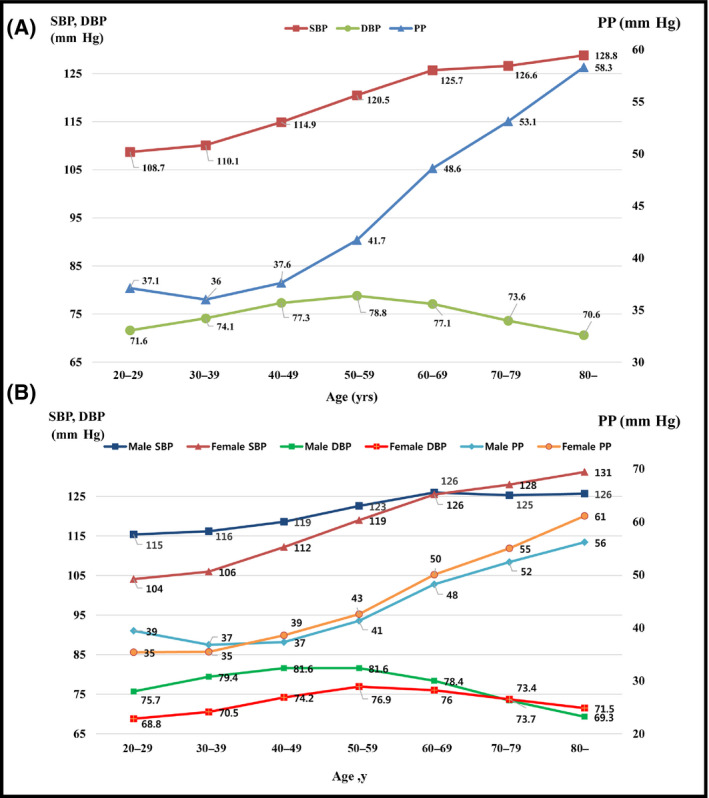
Trends in systolic blood pressure (SBP), diastolic blood pressure (DBP), and pulse pressure (PP) according to age in all patients (A) and by sex (B)
Men had higher SBP (120.1 mm Hg [SD 15.1] vs 113.8 mm Hg [SD 15.1]; P<.001), DBP (78.8 mm Hg [SD 10.6] vs 73.2 mm Hg [SD 9.5]; P<.001), and PP (41.2 mm Hg [SD 11.1] vs 40.6 [SD 11.6]; P<.001) than women (Table 2). These relationships were the opposite in the elderly. PP increased with age in both men and women. Compared with women, PP was higher in men aged <40 years but lower in those aged ≥40 years (Figure 2B).
3.3. Relationships with PP based on BP and BMI
Based on BMI, there were 1013 patients in group I, 9333 patients in group II, 6480 patients in group III, and 1885 patients in group IV. Compared with groups II–IV, group I had lower SBP (group I, 109.5 mm Hg; group II, 114.0 mm Hg; group III, 119.4 mm Hg; and group IV, 123.2 mm Hg), DBP (group I, 70.9 mm Hg; group II, 73.6 mm Hg; group III, 77.6 mm Hg; and group IV, 81.1 mm Hg), and PP (group I, 38.5 mm Hg; group II, 40.4 mm Hg; group III, 41.7 mm Hg; and group IV, 42.1 mm Hg) (Table 2). Next, patients were divided into normal or HTN groups. In the group of patients with HTN (Figure 3A), PP decreased with increasing BMI, which was due to decreased SBP and increased DBP. The opposite trend was found among patients with normal BP (Figure 3B).
Figure 3.

Associations between systolic blood pressure (SBP), diastolic blood pressure (DBP), and pulse pressure (PP) according to body mass index (BMI) in patients with (A) hypertension (HTN) and (B) normal blood pressure (BP). BMI: underweight (group I): BMI <18.5 kg/m2; normal weight (group II): 18.5≤BMI<23.0 kg/m2; overweight (group III): 23.5≤BMI<27.5 kg/m2; and obese (group IV): BMI ≥27.5 kg/m2
3.4. Univariate and multivariate analyses
In the univariate analysis, the following variables were positively correlated with PP: age (ß, 0.345; standard error [SE], 0.005 [P<.001]), SBP (ß, 0.540; SE, 0.003 [P<.001]), DBP (ß, 0.112; SE, 0.008 [P<.001]), waist circumference (ß, 0.190; SE, 0.008 [P<.001]), BMI (ß, 0.291; SE, 0.025 [P<.001]), fasting glucose level (ß, 0.086; SE, 0.004 [P<.001]), total cholesterol level (ß, 0.031; SE, 0.002 [P<.001]), triglyceride level (ß, 0.009; SE, 0.001 [P<.001]), LDL‐C level (ß, 0.021; SE, 0.004 [P<.001]), vitamin D level (ß, 0.181; SE, 0.014 [P<.001]), urinary sodium level (ß, 0.021; SE, 0.002 [P<.001]), and male sex (ß, 0.579; SE, 0.017 [P<.001]).
In model I of the multivariate analysis (patients with normal BP), age (ß, 0.138; SE, 0.010 [P<.001]), BMI (ß, 0.266; SE, 0.041 [P<.001]), and fasting glucose level (ß, 0.014; SE, 0.007 [P=.044]) were positively correlated with PP. However, in model II (patient with HTN), BMI (ß, −0.260; SE, 0.039 [P<.001]) and male sex (ß, −4.727; SE, 1.100 [P<.001]) were negatively correlated with PP, while age (ß, 0.630; SE, 0.040 [P<.001]) and urine sodium (ß, 0.028; SE, 0.008 [P<.001) were positively correlated with PP (Table 3).
Table 3.
Univariate and Multivariate Linear Regression Analysis of the Relationship Between Pulse Pressure and Risk Factors
| Variables | ß±SE | P Value |
|---|---|---|
| Univariate linear regression analysis | ||
| Age, y | 0.345±0.005 | <.001 |
| SBP, mm Hg | 0.54±0.003 | <.001 |
| DBP, mm Hg | 0.112±0.008 | <.001 |
| Waist circumference, cm | 0.19±0.008 | <.001 |
| BMI, kg/m2 | 0.291±0.025 | <.001 |
| Fasting glucose, mg/dL | 0.086±0.004 | <.001 |
| TC, mg/dL | 0.031±0.002 | <.001 |
| HDL‐C, mg/dL | −0.047±0.006 | <.001 |
| TGs, mg/dL | 0.009±0.001 | <.001 |
| LDL‐C, mg/dL | 0.021±0.004 | <.001 |
| Vitamin D, ng/mL | 0.181±0.014 | <.001 |
| Urine sodium, mmol/L | 0.021±0.002 | <.001 |
| Current smoker | 0.020±0.101 | .843 |
| Male sex | 0.579±0.167 | .001 |
| Multivariate linear regression analysis | ||
| Model I (normal BP) | ||
| Age, y | 0.138±0.010 | <.001 |
| BMI, kg/m2 | 0.266±0.041 | <.001 |
| Fasting glucose, mg/dL | 0.014±0.007 | .044 |
| LDL‐C, mg/dL | −0.014±0.004 | .001 |
| Vitamin D, ng/mL | −0.002±0.022 | .94. |
| Urine sodium, mmol/L | 0.003±0.002 | .129 |
| Male sex | 0.211±0.254 | .405 |
| Model II (HTN) | ||
| Age, y | 0.630±0.040 | <.001 |
| BMI, kg/m2 | −0.260±0.039 | .001 |
| Fasting glucose, mg/dL | 0.079±0.021 | <.001 |
| LDL‐C, mg/dL | −0.021±0.014 | .122 |
| Vitamin D, ng/mL | −0.146±0.078 | .064 |
| Urine sodium, mmol/L | 0.028±0.008 | .001 |
| Male sex | −4.727±1.100 | <.001 |
BMI indicates body mass index; BP, blood pressure; DBP, diastolic blood pressure; HDL‐C, high‐density lipoprotein cholesterol; HTN, hypertension; LDL‐C, low‐density lipoprotein cholesterol; SBP, systolic blood pressure; SE, standard error; TC, total cholesterol; TGs, triglycerides.
3.5. Urine sodium and BP
In univariate analysis, urine sodium was positively correlated with SBP (ß, 0.036; SE, 0.003 [P<.001]), DBP (ß, 0.015; SE, 0.002 [P<.001]), and PP (ß, 0.021; SE, 0.002 [P<.001]). In multivariate analysis, which adjusted for sex, BMI, and age, urine sodium was also positively correlated with SBP (ß, 0.016; SE, 0.002 [P<.001]), DBP (ß, 0.004; SE, 0.002 [P=.006]), and PP (ß, 0.012; SE, 0.002 [P<.001]).
4. Discussion
Using data from KNHANES V, we found that PP was associated with age, BMI, sex, and fasting glucose, cholesterol, vitamin D, and urinary sodium levels. PP increased with increasing age, and this relationship was more significant in older age (≥60 years). Women had a lower PP at ages <60 years, but a higher PP at ages ≥60 years. BMI was positively associated with PP; however, this relationship was negative for patients with HTN. Therefore, in patients with high BP, BMI was negatively correlated with PP.
PP is influenced by several cardiac and vascular factors, such as arterial stiffness and summation of a forward wave coming from the heart and propagating at a given speed (pulse wave velocity or PWV), and the returning backward wave.12 At the same time, PP can predict CV events.1, 2, 3, 4 The Framingham Heart Study suggested that PP is associated with coronary heart disease in middle‐aged and elderly patients,2 and other studies have revealed that PP is a powerful independent predictor of CV end points such as myocardial infarction, coronary heart failure, and overall mortality. Furthermore, the risk of coronary artery disease (CAD) increases by 22%, 15%, or 14% with each 10‐mm Hg increase in PP, SBP, or DBP. In addition, the risk of heart failure increases 9% with an increase in PP of up to 10 mm Hg.13, 14
In the presence of diabetes mellitus, HTN, dyslipidemia, or old age, obesity is a well‐established CV risk factor. A high BMI is one of the most powerful predictors of death from CV disease.15, 16 We hypothesized that people with a high BMI also have high PP because obesity is associated with arterial stiffness. In all patients, PP increased with increasing BMI. However, in this cross‐sectional nationwide survey, the positive association between PP and BMI became negative in patients with high BP. This inverse relationship is similar to that seen in a previous report, in which PP was higher in lean participants with HTN.8 With high SBP, people with a lower BMI have a higher PP than overweight people. The inverse relationship between BMI and PP might help to explain the reported higher mortality rates in lean hypertensive persons than in other hypertensive individuals, as suggested by Stamler et al.17 This relationship might also partially explain the obesity paradox, in which BMI is negatively associated with CV events in patients with illnesses such as CAD, end‐stage renal disease, and stroke.18 Therefore, the management of CV risk factors, except weight control, might be more important in leaner patients with HTN.
Regnault et al19 suggested that PP is highly predictive of CV‐related death and morbidity in both sexes, and both PP and BP were higher in men. Moreover, men have greater incidences of HTN and CV complications. Therefore, male sex alone might contribute to the risk of coronary heart disease and CV‐related mortality.20, 21, 22 In the present cohort study, sex was also independently correlated with PP. Compared with women, men had higher PP values. However, this was attenuated after adjusting for SBP, owing to the higher SPB in men. At younger ages, PP was lower in women than in men; however, PP was higher in women than in men at ages ≥50 years. A previous study reported that postmenopausal women (age 46–80 years) who were not taking hormone therapy had greater carotid artery intima‐media thickness, a marker of subclinical atherosclerosis, with older age.23 The incidence of CAD is also higher at ages ≥60 years.24 A significantly higher PP at this age is considered a risk factor for CV disease in postmenopausal women.
Aging leads to a multitude of changes in the CV system, and it is a powerful predictor of adverse CV events. There is a dramatic increase in the prevalence of peripheral artery disease, carotid artery disease, and abdominal aortic aneurysm with advanced age.25 Isolated systolic HTN mostly occurs in older patients. Moreover, SBP increases and DBP decreases after 60 years of age in normotensive and untreated hypertensive populations.26, 27 Similarly, in the present study, SBP and PP increased with age, while DBP decreased with age.
Several cross‐sectional studies demonstrated that urine sodium was associated with SBP and DBP.28, 29, 30 Mitsumasa et al31 reported that high sodium concentrations in spot urine were associated with SBP, but not with DBP.31 Our study revealed that spot urine sodium was positively associated with SBP, DBP, and PP, even after adjusting for sex, age, and BMI. Several mechanisms explained the association between sodium excretion and BP.32 Urine spot sodium can be tested and is helpful in controlling BP.
5. Study Limitations and Strengths
The major limitation of our study is that KNHANES V is a cross‐sectional dataset from which a causal inference cannot be drawn. Although we performed rigorous adjustment analyses, unmeasured hidden biases may have remained. However, the merits of this study include a large sample size, and all patients were evaluated by a well‐trained interviewer and physician staff.
6. Conclusions
This analysis of data from KNHANES demonstrates that PP has good concordance with selected CV risk factors, such as age, sex, history of diabetes, dyslipidemia, and BMI. However, PP increases with high BMI in patients with normal BP, but PP decreases with high BMI among patients with HTN. This effect was maintained after adjusting for several risk factors. Our findings provide further insight into the role of PP in CV events based on age, sex, or BMI, and may explain the increased CV risk in patients with lean body types or in women with HTN.
Conflict of Interest
The authors report no conflicts of interest to disclose.
Kang, M. G. , Kim, K.‐H. , Koh, J.‐S. , Park, J. R. , Hwang, S.‐J. , Hwang, J.‐Y. , Ahn, J. H. , Jang, J. Y. , Jeong, Y.‐H. , Kwak, C. H. and Park, H. W. (2017), Association between pulse pressure and body mass index in hypertensive and normotensive populations in the Korea National Health and Nutrition Examination Survey V, 2010–2012. Journal of Clinical Hypertension, 19:395–401. doi: 10.1111/jch.12935
References
- 1. Franklin SS, Lopez VA, Wong ND, et al. Single versus combined blood pressure components and risk for cardiovascular disease: the Framingham Heart Study. Circulation. 2009;119:243–250. [DOI] [PMC free article] [PubMed] [Google Scholar]
- 2. Franklin SS, Khan SA, Wong ND, Larson MG, Levy D. Is pulse pressure useful in predicting risk for coronary heart Disease? The Framingham heart study. Circulation. 1999;100:354–360. [DOI] [PubMed] [Google Scholar]
- 3. Roman MJ, Devereux RB, Kizer JR, et al. High central pulse pressure is independently associated with adverse cardiovascular outcome the strong heart study. J Am Coll Cardiol. 2009;54:1730–1734. [DOI] [PMC free article] [PubMed] [Google Scholar]
- 4. Benetos A, Rudnichi A, Safar M, Guize L. Pulse pressure and cardiovascular mortality in normotensive and hypertensive subjects. Hypertension. 1998;32:560–564. [DOI] [PubMed] [Google Scholar]
- 5. Winston GJ, Palmas W, Lima J, et al. Pulse pressure and subclinical cardiovascular disease in the multi‐ethnic study of atherosclerosis. Am J Hypertens. 2013;26:636–642. [DOI] [PMC free article] [PubMed] [Google Scholar]
- 6. Domanski M, Mitchell G, Pfeffer M, et al. Pulse pressure and cardiovascular disease‐related mortality: follow‐up study of the Multiple Risk Factor Intervention Trial (MRFIT). JAMA. 2002;287:2677–2683. [DOI] [PubMed] [Google Scholar]
- 7. Laskey WK, Jingjing W, Schulte PJ, et al. Association of arterial pulse pressure with long‐term clinical outcomes in patients with heart failure. JACC Heart Failure. 2016;4:42–49. [DOI] [PubMed] [Google Scholar]
- 8. Martins D, Tareen N, Pan D, Norris K. The relationship between body mass index and pulse pressure in older adults with isolated systolic hypertension. Am J Hypertens. 2002;15:538–543. [DOI] [PubMed] [Google Scholar]
- 9. Cirillo M, Stellato D, Laurenzi M, Panarelli W, Zanchetti A, De SN. Pulse pressure and isolated systolic hypertension: association with microalbuminuria. The GUBBIO Study Collaborative Research Group. Kidney Int. 2000;58:1211–1218. [DOI] [PubMed] [Google Scholar]
- 10. Lim S, Shin H, Song JH, et al. Increasing prevalence of metabolic syndrome in Korea: the Korean National Health and Nutrition Examination Survey for 1998‐2007. Diabetes Care. 2011;34:1323–1328. [DOI] [PMC free article] [PubMed] [Google Scholar]
- 11. Who expert consultation . Appropriate body‐mass index for Asian populations and its implications for policy and intervention strategies. Lancet. 2004;363:157–163. [DOI] [PubMed] [Google Scholar]
- 12. Nichols WW, O'Rourke M. McDonald's Blood Flow in Arteries: Theoretical, Experimental and Clinical Principles. 4th ed. London: Arnold; 1998. [Google Scholar]
- 13. Vaccarino V, Holford TR, Krumholz HM. Pulse pressure and risk for myocardial infarction and heart failure in the elderly. J Am Coll Cardiol. 2000;36:130–138. [DOI] [PubMed] [Google Scholar]
- 14. Benetos A. Pulse pressure and cardiovascular risk. J Hypertens. 1999;17):S21–S24. [PubMed] [Google Scholar]
- 15. Calle EE, Thun MJ, Petrelli JM, Rodriguez C, Heath CW Jr. Body‐mass index and mortality in a prospective cohort of U.S. adults. N Engl J Med. 1999;341:1097–1105. [DOI] [PubMed] [Google Scholar]
- 16. Hubert HB, Feinleib M, McNamara PM, Castelli WP. Obesity as an independent risk factor for cardiovascular disease: a 26‐year follow‐up of participants in the Framingham Heart Study. Circulation. 1983;67:968–977. [DOI] [PubMed] [Google Scholar]
- 17. Stamler R, Ford CE, Stamler J. Why do lean hypertensives have higher mortality rates than other hypertensives? Findings of the hypertension detection and follow‐up program. Hypertension. 1991;17:553–564. [DOI] [PubMed] [Google Scholar]
- 18. Angeras O, Albertsson P, Karason K, et al. Evidence for obesity paradox in patients with acute coronary syndromes: a report from the Swedish Coronary Angiography and Angioplasty Registry. Eur Heart J. 2013;34:345–353. [DOI] [PubMed] [Google Scholar]
- 19. Regnault V, Thomas F, Safar ME, et al. Sex difference in cardiovascular risk: role of pulse pressure amplification. J Am Coll Cardiol. 2012;59:1771–1777. [DOI] [PMC free article] [PubMed] [Google Scholar]
- 20. Tunstall‐Pedoe H, Kuulasmaa K, Mahonen M, Tolonen H, Ruokokoski E, Amouyel P. Contribution of trends in survival and coronary‐event rates to changes in coronary heart disease mortality: 10‐year results from 37 WHO MONICA project populations. Monitoring trends and determinants in cardiovascular disease. Lancet. 1999;353:1547–1557. [DOI] [PubMed] [Google Scholar]
- 21. D'Agostino RB Sr, Vasan RS, Pencina MJ, et al. General cardiovascular risk profile for use in primary care: the Framingham Heart Study. Circulation. 2008;117:743–753. [DOI] [PubMed] [Google Scholar]
- 22. Kappert K, Bohm M, Schmieder R, et al. Impact of sex on cardiovascular outcome in patients at high cardiovascular risk: analysis of the Telmisartan Randomized Assessment Study in ACE‐Intolerant Subjects With Cardiovascular Disease (TRANSCEND) and the Ongoing Telmisartan Alone and in Combination With Ramipril Global End Point Trial (ONTARGET). Circulation. 2012;126:934–941. [DOI] [PubMed] [Google Scholar]
- 23. Mack WJ, Slater CC, Xiang M, Shoupe D, Lobo RA, Hodis HN. Elevated subclinical atherosclerosis associated with oophorectomy is related to time since menopause rather than type of menopause. Fertil Steril. 2004;82:391–397. [DOI] [PubMed] [Google Scholar]
- 24. Lerner DJ, Kannel WB. Patterns of coronary heart disease morbidity and mortality in the sexes: a 26‐year follow‐up of the Framingham population. Am Heart J. 1986;111:383–390. [DOI] [PubMed] [Google Scholar]
- 25. Savji N, Rockman CB, Skolnick AH, et al. Association between advanced age and vascular disease in different arterial territories: a population database of over 3.6 million subjects. J Am Coll Cardiol. 2013;61:1736–1743. [DOI] [PubMed] [Google Scholar]
- 26. Franklin SS, Wt G, Wong ND, et al. Hemodynamic patterns of age‐related changes in blood pressure. The Framingham Heart Study. Circulation. 1997;96:308–315. [DOI] [PubMed] [Google Scholar]
- 27. Franklin SS, Jacobs MJ, Wong ND, L'Italien GJ, Lapuerta P. Predominance of isolated systolic hypertension among middle‐aged and elderly US hypertensives: analysis based on National Health and Nutrition Examination Survey (NHANES) III. Hypertension. 2001;37:869–874. [DOI] [PubMed] [Google Scholar]
- 28. Khaw KT, Bingham S, Welch A, et al. Blood pressure and urinary sodium in men and women: the Norfolk Cohort of the European Prospective Investigation into Cancer (EPIC‐Norfolk). Am J Clin Nutr. 2004;80:1397–1403. [DOI] [PubMed] [Google Scholar]
- 29. Kihara M, Fujikawa J, Ohtaka M, et al. Interrelationships between blood pressure, sodium, potassium, serum cholesterol, and protein intake in Japanese. Hypertension. 1984;6:736–742. [DOI] [PubMed] [Google Scholar]
- 30. Takemori K, Mikami S, Nihira S, Sasaki N. Relationship of blood pressure to sodium and potassium excretion in Japanese women. Tohoku J Exp Med. 1989;158:269–281. [DOI] [PubMed] [Google Scholar]
- 31. Umesawa M, Yamagishi K, Noda H, et al. The relationship between sodium concentrations in spot urine and blood pressure increases: a prospective study of Japanese general population: the Circulatory Risk in Communities Study (CIRCS). BMC Cardiovasc Disord. 2016;16:55. [DOI] [PMC free article] [PubMed] [Google Scholar]
- 32. Adrogue HJ, Madias NE. Sodium and potassium in the pathogenesis of hypertension. N Engl J Med. 2007;356:1966–1978. [DOI] [PubMed] [Google Scholar]