

1. INTRODUCTION
High dietary sodium is estimated to be the leading dietary risk for death and disability according to the Global Burden of Disease Study.1, 2 The health risk associated with dietary sodium is largely related to a direct relationship between increasing dietary sodium and increasing blood pressure. Notably, increased blood pressure is a leading global risk factor for death and disability causing approximately 50% of cardiovascular disease.3 In both observational and interventional studies, 24‐hour urine sodium excretion is often used as the “gold standard” to estimate dietary sodium. Although it is generally stated that approximately 90% of dietary sodium is excreted in 24‐hour urine collections,4 to our knowledge, there has been no systematic review of the percentage of ingested sodium excreted in the urine. Previous studies in healthy people have reported that 24‐hour urine sodium excretion accounts for 61%‐107% of ingested sodium.5 We have conducted a systematic review of studies that examined the percentage of sodium excreted in 24‐hour urine collections in study participants ingesting known quantities of sodium. Accurately defining the percentage of dietary sodium excreted in urine is important to assess the validity of using urine excretion studies as the best evidence for assessing relationships between dietary sodium and health.
This systematic review was conducted with the support of the TRUE consortium.6 The TRUE consortium formed because of concerns that low‐quality research was causing controversy about the health impact of dietary sodium.7 Specifically, studies that inadequately assess dietary sodium may be susceptible to drawing false conclusions between sodium intake and health outcomes. The TRUE consortium will provide recommendations about minimum and desirable standards for the conduct of research and also conduct systematic reviews of outcome studies that meet the minimum standards as part of a process to ensure clinical and population recommendations for dietary sodium are based on reliable, reproducible research.
2. METHODS
2.1. Selection criteria
To establish the percentage of ingested sodium that is excreted in urine, we included only studies that rigorously assessed the amount of sodium ingested and the amount of sodium excreted in 24‐hour urine collections in individuals on a prescribed intake of dietary sodium. To ensure adherence to prescribed dietary sodium, eligible studies had to either provide meals with known content of sodium to participants or record the weight of food ingested and the food samples be subsequently analyzed for sodium content. To be included, studies had to have adult participants and ensure adherence to a constant quantity of dietary sodium for a minimum of 3 days, to ensure participants were at a “steady state” of urine sodium excretion relative to ingested sodium. Additionally, studies were excluded if the participants had any acute or major chronic illnesses (eg, heart failure), or acute change in physical activity or heat exposure or ingestion of drugs (eg, furosemide) that may have altered sodium absorption, metabolism, or excretion. Studies involving participants with stable chronic health risks such as hypertension were included.
2.2. Search strategy
Medline, Embase, Cochrane Database of Systematic Reviews, Cochrane Central Register of Controlled Trials, and the World Health Organization (WHO) International Clinical Trials Registry Platform were searched to identify potential studies. Search terms were developed with a librarian and tailored for each database (see Appendix A). The search terms for each database were developed to capture studies that evaluated our surrogate measure (24‐hour urine sodium excretion) and our reference standard (sodium/salt, dietary consumption). The WHO Clinical Trials database used a broader set of terms because of restrictions caused by the search engine user interface. No language or date restrictions were applied. All searches were performed on October 3, 2016. All studies identified were initially screened using a title‐abstract review, followed by a full‐text review. Disagreements for article inclusion were resolved through consensus between 2 reviewers (AL and CD).
2.3. Data extraction
Studies identified as suitable through the full‐text review were subject to data extraction for the following variables: (1) health status; (2) sex; (3) study design; (4) sample size; (5) the duration of dietary intervention; (6) prescribed daily sodium intake; (7) 24‐hour urine sodium excretion; (8) prescribed potassium intake or excretion; and (9) study environment (controlled study [conducted in a research facility] vs uncontrolled study [conducted in free living subjects]. Cochrane Collaboration tool for assessing risk of bias was used to score biases and quality of each study8. Cochrane's tool contains measures that identify selection, performance, detection, attrition, and reporting bias.
2.4. Statistical analysis
The percentage of daily sodium intake excreted in 24‐hour urine samples was calculated by dividing sodium excreted in mg by daily sodium intake in mg and multiplying by 100. Once the percentage of daily sodium excreted was calculated, the standard error of the amount of excreted urine was used to calculate the 95% confidence interval (CI) for the percentage of daily sodium excreted. To calculate the 95% CI, the mean sodium excreted was added or subtracted (for the upper and lower ranges of confidence) to the z value of 1.96, multiplied by the standard error divided by the daily sodium intake. Studies that did not provide standard errors were excluded from the meta‐analysis as it was not possible to calculate the confidence intervals (n = 2), but these studies were included in the descriptive analysis9, 10.
A meta‐analysis was performed on all percentages of sodium excretion provided in each study (n = 35). A random effects model with inverse‐variance weighting was used, as we expected that each of the study point estimate(s) would differ based on varying study conditions and characteristics (eg, age of participants across studies differed). Heterogeneity was assessed using the I 2 statistic. Subgroup analysis was performed on the following variables: potassium intake (calculated as either having a potassium intake above or below the sample mean of 77.6 mmol/d (n = 22) and also calculated as a continuous variable, study environment (controlled [study conducted in a research facility] vs uncontrolled [study conducted in free living subjects outside of a research facility]), sex (male, female), sodium intake range, health status, dietary sodium changes (low to high, high to low, and no direction), length of steady state (3, 4‐5, and 7 or more days), and study rigor. An additional subgroup analysis was conducted on those studies with sodium intake < 1000 mg/d, and length of steady state. A random effects metaregression was also performed on all subgroup analyses to obtain P values for the differences between subgroups. Sodium intake levels were as previously defined by Campbell and colleagues, based on the paleolithic diets human evolved on, long‐term physiologic studies, and the World Health Organization dietary recommendations, where low daily sodium intake was defined as < 100 mg, normal‐physiological intake as 100 to < 1000 mg, recommended intake as 1000 mg to < 2000 mg, high intake as ≥ 2000 mg to 4000 mg, very high intake as > 4000 to 6000 mg, and extremely high intake as > 6000 mg.11 Study rigor was considered high if dietary intake was assessed with a known unbiased reference measure (denominator) and the 24‐hour urine collections were high quality. Known unbiased reference measures for sodium intake include (1) controlled feeding studies or (2) direct observation.12 Controlled feeding studies provide meals and carefully monitor the amount of food consumed.13 High‐quality 24‐hour urine collections were arbitrarily defined as including provision of explicit instructions for collection, an assessment of completion of 24‐hour urine collection (eg, creatinine criteria, para‐aminobenzoic acid recovery) and at least 80% of urine specimens meeting completion criteria.14 Age was not assessed as a subgroup as there was inconsistent reporting of age across studies.
Studies that may have potentially influenced the final estimates and heterogeneity (ie, high risk of bias, studies that did not assess completeness of 24‐hour urine collections or that included incomplete 24‐hour urine samples, and studies with larger changes in sodium intake over a shorter period in time where steady state sodium excretion may not have been achieved) were removed as part of the sensitivity analysis to assess whether the findings were robust.
In most cases, studies assessed sodium excretion as a secondary rather than primary objective. Therefore, we did not consider publication bias.
3. RESULTS
3.1. Study characteristics
The search of the 5 electronic databases retrieved 6754 articles (Figure 1). After removing duplicate studies in the literature searches, 5264 unique studies were identified for the title/abstract search. The title and abstract search identified 392 (95% consensus between 2 reviewers) relevant articles that then underwent a full‐text review. Of those, 359 were excluded because they did not meet the inclusion criteria for sodium intake and 24‐hour urine excretion measurements. Two more articles were excluded from the meta‐analysis because the data they provided did not allow a confidence interval to be calculated.9, 10 Two studies were also removed because they included participants or used methodologies that may have affected sodium steady state.15, 16 These 2 articles were still included during data extraction but not in the meta‐analysis. Six additional studies were found from the reference lists of review articles that were identified during the literature search. A final 35 articles were included in the meta‐analysis (Appendix B)17, 18, 19, 20, 21, 22, 23, 24, 25, 26, 27, 28, 29, 30, 31, 32, 33, 34, 35, 36, 37, 38, 39, 40, 41, 42, 43, 44, 45, 46, 47, 48, 49, 50, 51.
Figure 1.
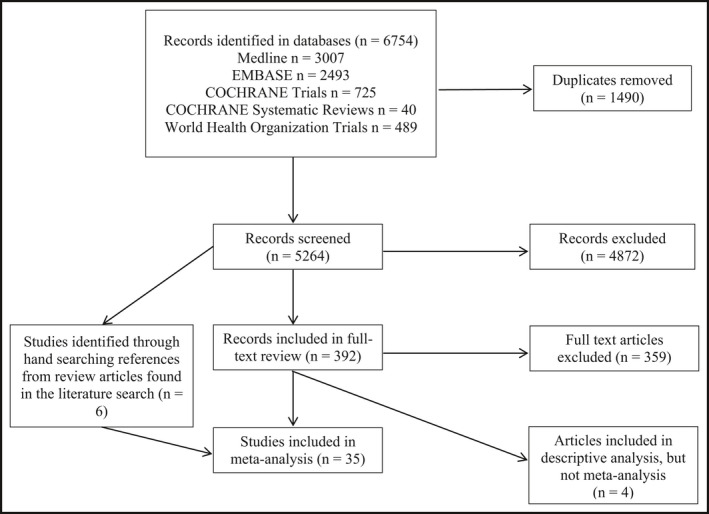
A Preferred Reporting Item for Systematic Reviews and Meta‐Analyses (PRISMA) flow diagram of literature search process and results
All studies included in the analysis were prospective and were either randomized controlled parallel group trials (n = 10) or randomized crossover trials (n = 25). Participants in each study ranged from 18 to 80 years of age and were considered to be either healthy (n = 22) or have chronic health risks such as hypertension (n = 13). The studies used different schedules for urine sample collection, different methods for assessing completeness of 24‐hour urine collections and for ensuring dietary adherence. Only 2 of the studies17, 18 included had a primary objective of assessing the quantity of ingested sodium excreted in urine.
3.2. Percentage of total sodium excreted
Figure 2 provides a forest plot for the pooled percentage of dietary sodium excretion in each study. The pooled estimate for the percentage of sodium excreted in urine for all studies included in the meta‐analysis was 92.8% (95% CI 90.7, 95.0, heterogeneity 95.1%, P < 0.001).
Figure 2.
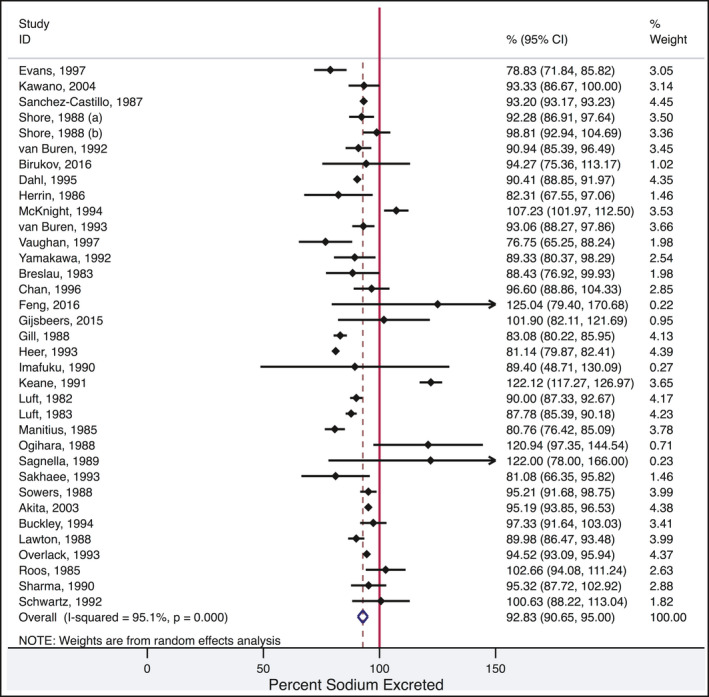
Forest plot for pooled percentage of dietary sodium excretion in each study
3.3. Subgroup analyses (Figure 3)
Figure 3.
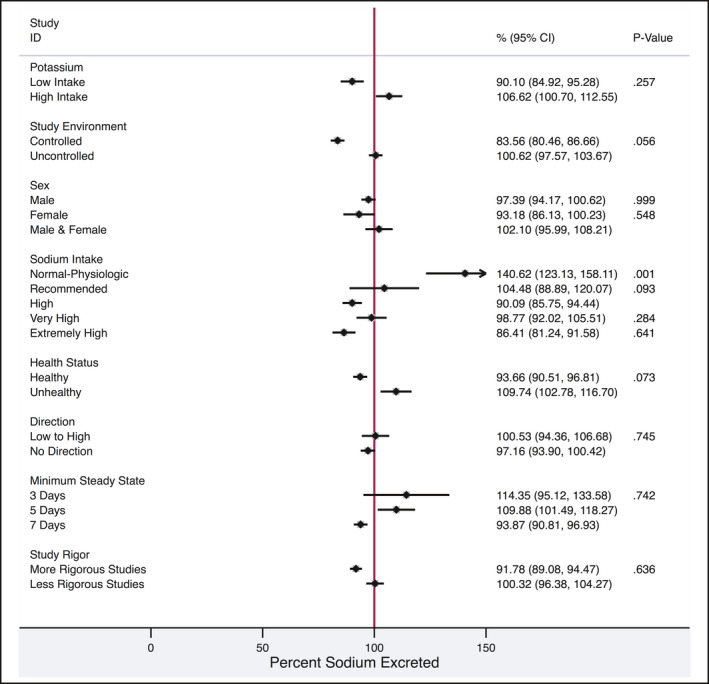
Forest plot detailing the percentage of excretion by each subgroup category. P values represent the test statistic for differences between each variable and sodium excretion. Potassium intake and duration of steady state were metaregressed as continuous variables, the rest were categorical. Low potassium intake was defined as < 77.6 mmol/d and high potassium as > 77.6 mmol/d. Controlled environments included studies where the participants were in a research facility (eg, hospital ward) and uncontrolled studies were those where the participants were “free living.” The sodium intake metaregression was compared to high intake. Sodium intakes were categorized and included the following ranges: normal‐physiologic (100‐< 1000 mg sodium/d), recommended (1000 to < 2000 mg sodium/d), high (≥ 2000‐4000 mg sodium/d), very high (> 4000‐6000 mg sodium/d), and extremely high (> 6000 mg sodium/d). The low‐to‐high direction indicates sodium intake had been increased before the assessment of excretion whereas no direction indicates there had been no change in sodium intake before the assessment. Steady state refers to the duration of a constant sodium diet before assessment of excretion. Studies were considered to have more rigor if dietary intake was assessed with a known unbiased reference measure (denominator) and the 24‐h urine collections were high quality
3.3.1. Studies conducted at different levels of potassium intake
Several studies reported levels for potassium intake, or potassium excretion. Studies that reported potassium intake exhibited a mean potassium intake or excretion of < 77.6 mmol/d (n = 10) yielded a pooled estimate of 90.1% (95% CI 84.9, 95.3, heterogeneity 93.7, P < 0.001) for percentage of ingested sodium that was excreted in urine. The pooled estimate of sodium excretion for studies with potassium intake or excretion > 77.6 mmol/day (n = 12) was 106.6% (95% CI 100.7, 112.6, heterogeneity 95.1%, P < 0.001). Dietary potassium (as a continuous variable) was not significantly related to the percentage of sodium excreted (P = 0.257).
3.3.2. Studies conducted in controlled research facilities vs studies conducted in free living participants
Studies that took place in controlled research facilities (eg, metabolic wards, sealed chambers, hospitals; n = 7) demonstrated a percentage excretion of ingested sodium of 83.6% (95% CI 80.5, 86.7, heterogeneity 72.3%, P < 0.001). In comparison, participants in studies that were conducted in uncontrolled environments (n = 28) excreted 100.6% (95% CI 97.6, 103.7, heterogeneity 96.8%, P < 0.001) of ingested sodium intake. The percentage of sodium excreted did not differ between the study environments (controlled vs uncontrolled, P = 0.056). Studies with controlled environments did not appear to have any systematic differences in methodology (eg, low dietary sodium, short dietary periods, etc.) compared to studies with uncontrolled environments.
3.3.3. Males vs females
In studies that reported sex‐specific data, sex‐specific estimates of urine sodium excretion were calculated. In studies that reported data in males only (n = 16), the pooled estimate of ingested sodium that was excreted in 24‐hour urine was 97.4% (95% CI 94.2, 100.6, heterogeneity 95.6% P < 0.001). Only 3 studies reported data in female participants; the percentage of dietary sodium excreted in urine was 93.2% (95% CI 86.1, 100.2, heterogeneity 79.1% P < 0.001). The percentages of sodium excreted by males and females were not significantly different (P = 0.481).
3.3.4. Studies conducted at different levels of sodium intake
Many studies reported sodium excretion, with differing levels of sodium intake.11 Sodium intakes were categorized according to standardized nomenclature in the following ranges: low (< 100 mg sodium/d, n = 0), normal‐physiologic (100‐< 1000 mg sodium/day, n = 17), recommended (1000 ‐< 2000 mg sodium/d, n = 6), high (≥ 2000‐4000 mg sodium/d, n = 13), very high (≥ 4000‐6000 mg sodium/d, n = 11), and extremely high (> 6000 mg sodium/d, n = 10). Within the normal‐physiologic range of sodium intake (100 to < 1000 mg/d), mean urine sodium excretion was 140.6% (95% CI 123.1, 158.1, heterogeneity 96.3%, P < 0.001). Studies that fell into the recommended (1000 to < 2000 mg/d) and high ranges of sodium intake (2000‐4000 mg/d) reported pooled estimates of sodium excretion of 104.5% (95% CI 88.9, 120.1, heterogeneity 95.2%, P < 0.001) and 90.1% (95% CI 85.7, 94.4, heterogeneity 97.9%, P < 0.001), respectively. Studies with very high intake (sodium > 4000 to 6000 mg/d) reported pooled estimates of sodium excretion of 98.8% (95% CI 92.0, 105.5, heterogeneity 88.4%, P < 0.001) and the studies with extremely high levels of sodium intake (sodium > 6000 mg/d) had a pooled estimate of 86.4% (95% CI 81.2, 91.6, heterogeneity 94.7%, P < 0.001). The percentage of sodium excreted was not different for recommended, very high, and extremely high compared to high sodium intake (P = 0.093, P = 0.284, P = 0.641 respectively). However, normal‐physiological sodium intake had a higher percentage excretion of sodium compared with high levels of sodium intake (P < 0.001).
3.3.5. Healthy participants vs those with chronic health risks
Studies assessing healthy populations (n = 25) had a pooled 24‐hour excretion of ingested sodium estimate of 93.7% (95% CI 90.5, 96.8, heterogeneity 97.1%, P < 0.001). Comparatively, in the studies with participants who had chronic health risks, such as diabetes and hypertension (n = 9), the pooled estimate of urine sodium excretion was 109.7% (95% CI 102.8, 116.7, heterogeneity 96.2%, P < 0.001). The presence of health risks did not significantly affect the percentage of sodium excreted (P = 0.073).
3.3.6. Studies with changes in dietary sodium protocols
Studies that had dietary protocols that changed from low sodium intake to high sodium intake (n = 13) had a pooled estimate of 100.5% (95% CI 94.4, 106.7, heterogeneity 95.5%, P < 0.001) sodium excretion compared to studies with no directionality to dietary changes (n = 22) with a pooled estimate of 97.2% (95% CI 93.9, 100.4, heterogeneity 97.0%, P < 0.001). There were no significant differences in percentage of urine sodium excretion between the diets that increased sodium intake and those with no change in sodium intake (P = 0.745). There were no studies that had dietary protocols that changed from high to low sodium intake.
3.3.7. Studies with longer dietary periods before sampling
Studies with stable dietary sodium intervention periods of 3 days before urine sampling (n = 5) had a pooled estimate of 114.4% (95 CI 95.1, 33.6, heterogeneity 96.4% P < 0.001). Studies that had stable dietary sodium intervention periods of 4 or 5 days before sampling (n = 9) had a pooled estimate of 109.9% (95% CI 101.5, 118.3, heterogeneity 95.4%, P < 0.001) excretion, whereaas studies with 7 days or more days of stable dietary sodium intervention before sampling (n = 21) had pooled estimates of 93.9% (95% CI 90.8, 96.9, heterogeneity 97.1%, P < 0.001). The length of dietary intervention did not significantly affect the percentage of sodium excreted (P = 0.742).
3.3.8. Studies that met more rigorous criteria for diet provision and completion of 24‐h urine
Studies that had high‐quality dietary assessment methods and 24‐hour urine sodium excretion measures (n = 3) reported a pooled estimate of 91.8% (95% CI 89.1, 94.5, heterogeneity 79.8%, P = 0.001), whereas studies that did not meet the criteria for high‐quality diets and 24‐hour urine sodium excretion measures (n = 32) reported a pooled estimate of 100.3% (95% CI 96.4, 104.3, heterogeneity 96.9%, P < 0.001).
3.3.9. Assessment of low sodium intake and length of steady state
Studies categorized as having low sodium intake were separately analyzed with meta‐regression to assess the interaction between the length of steady state and sodium excretion (Figure 4). The length of steady state did not affect the percentage of sodium excreted (P = 0.134).
Figure 4.
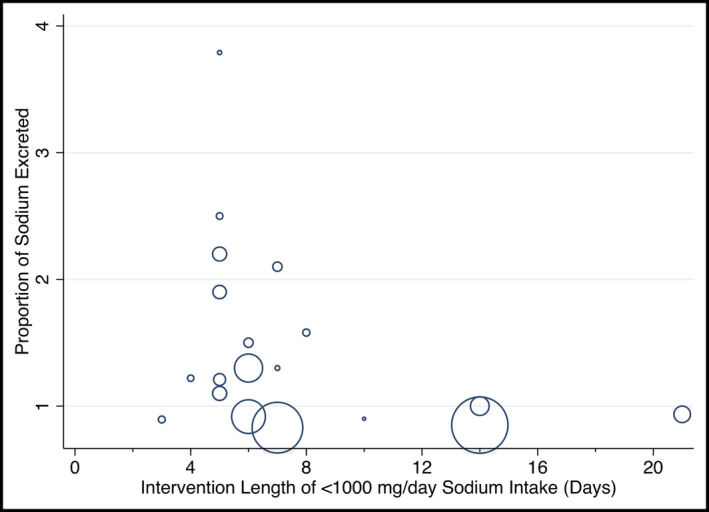
Metaregression plot of the percentage of sodium excreted to length of steady state in those with low sodium intake
3.3.10. Sensitivity analyses
Ten separate studies were sequentially removed from the overall pooled analysis, as well as each of the subgroups, to attempt to identify potential sources of heterogeneity and statistical outliers. Studies were removed for not excluding incomplete urine samples,18 a high risk of bias,19, 20, 21 and for having a change in sodium intake of over 4600 mg/d.21, 22, 23, 24, 25, 26, 27 The heterogeneity of the overall pooled estimate did not change by more than 4.5% when each of the studies was removed from the pool. The sensitivity analysis was also applied to each of the subgroups, where the largest change in heterogeneity was from 95.1% to 76.3% when one study23 was removed (based on a very large change in sodium intake in the high potassium intake subgroup). All other subgroups’ heterogeneity changed by less than 18% during the sensitivity analysis.
3.3.11. Excluded studies
Four studies were separated prior to the analysis but still included data that could be useful when interpreting the conclusions of this analysis. Two of these studies did not meet methodological criteria because of an intervention exposing the participants acutely to a hot environment.15, 16 The other 2 studies did not include variance data for urine sodium excretion and so could not be used in the analysis.9, 10 The studies ranged between 8 and 105 participants, with 2 studies being male only.15, 16 Two studies measured urine sodium while on a stable diet for 5 days or more, 2 measured urine sodium at either 3 or 4 days of a stable diet. Two of the studies assessed hypertensive patients.9, 10 Allsopp and colleagues had 3 sodium intake levels of 1525, 4004, and 8013 mg/d during acute heat exposure and urine sodium excretion ranged from 38.14% to 72.13%.15 Armstrong and coauthors had 1081 and 5490 mg/d sodium intake levels during acute heat exposure and a sodium excretion range of 47.96% to 59.82%.16 Mueller and colleagues and Parfrey and colleagues both had 2 levels of sodium intake of 1012 and 4048 mg/d and 230 and 8050 mg/d, respectively, and respective sodium excretion values ranging between 100.1% to 115.5% and 69.71% to 220%.9, 10
4. DISCUSSION
The overall pooled estimate from this meta‐analysis indicates that on average 92.8% of 24‐hour dietary sodium was excreted in 24‐hour urine collections. This meta‐analysis included only studies where participants had a constant amount of sodium in their diets for a minimum of 3 days. Where participants ate their usual diets, in other studies that included careful assessment of dietary sodium and collection of 24‐hour urine, similar percentages of dietary sodium were excreted in urine.52, 53 For example, Holbrook reported 86% of sodium ingested was excreted in 24‐hour urine while on a usual dietary pattern during a yearlong study that included 4 separate weeks of rigorous assessment of dietary sodium intake and urine excretion 52 and Schachter reported 98% of sodium was excreted in 24‐hour urines in a 3‐day study.53 When there is a substantive sustained change in dietary sodium, it can take 3 or more days before a new steady state urine excretion of sodium is achieved.21, 25, 54, 55 Therefore, in the absence of large recent changes in dietary sodium, this meta‐analysis indicates quantitating 24‐hour urine sodium is a close (93%) estimate of average 24‐hour dietary sodium in a study population. However, most people vary their sodium intake meal to meal, day to day, and often season to season.5, 56 Further, a very carefully conducted physiological study found half weekly and weekly cyclic variation in sodium excretion when people were on a constant sodium diet17 Hence, there is no scientific rationale to expect a single 24‐hour urine sodium to reflect an individual's usual long‐term sodium intake. Several studies support the need for multiple 24‐hour urine collections, timed to account for usual daily variation of dietary intake and long‐term cyclic changes in sodium excretion to accurately assess an individual's usual sodium intake.5, 55
The average 24‐hour urine sodium included large variations in the percentage of sodium excreted between studies leading to high heterogeneity. For example, the average excretion of ingested sodium varied from 76% to 122% (Figure 2). The heterogeneity indicates caution should be exercised when interpreting the average result. It is likely that inaccuracies in quantitating sodium in the diet and in collecting 24‐hour urine accounts of some of the observed heterogeneity in the percentage of dietary sodium excreted. The studies were selected based on criteria that implied rigorous collection of 24‐hour urines and assessment of the amount of dietary sodium that was consumed. However, we noted, there was a general lack of quality assurance to ensure the accuracy of and adherence to dietary sodium and criteria to assess and exclude incomplete 24‐hour urine collections. The limitations of dietary assessment of sodium intake have been well documented and include difficulty accurately measuring discretionary salt and portion size and inaccuracies in food composition databases.57 In at least 1 study that reported measuring the sodium content in the foods provided, there was some variance from the amount of sodium the study intended to provide.28 Further, most studies did not observe the diets being consumed and hence there is no certainty that additional sodium was not added to the foods or that more or less food was consumed than reported. In addition, it is likely that there was variation in the completeness of collecting 24‐hour urine samples within individuals and between studies. Incomplete 24‐hour urine collections are common in research studies and will lead to underestimates of the amount of sodium excreted.58 Less commonly, excess urine is collected and can result in overestimates of sodium excretion. We noted wide variation in indirect methods used to exclude incomplete urine collections. The different methods for excluding incomplete urine collections can result in large differences in estimated dietary sodium.59 Nevertheless, when we examined the 3 studies that most carefully assessed dietary sodium and completeness of urine collections, the average excretion was close to that in the overall meta‐analysis (89.4% vs 92.8% of ingested sodium excreted in 24‐hour urine).17, 18, 29
Other factors besides variation in dietary sodium and incomplete 24‐hour urine collections that have been reported to affect estimates of sodium excretion include health status, circadian variation, hydration status, excessive sweating, hormonal changes, and other dietary factors that may have not been reported in the studies.60, 61, 62 Long‐term cyclic variation in sodium excretion has also been reported, which could further complicate measurements taken during short‐term studies.17 Diets varied between and within studies, with some studies identifying relationships between dietary calcium, alcohol, potassium, and sodium excretion.30, 63, 64, 65 We did not confirm an impact of different levels of stable potassium intake on the percentage of dietary sodium excreted but this does not exclude an effect of changes in potassium intake. Studies should account for potential confounding factors when reporting average sodium excretion and interpreting single 24‐hour urine excretions.
There was also variation in the mean percentage excretion of dietary sodium in the subgroup analysis comparing normal‐physiological sodium intake to the high intake group. Studies included in the normal physiological sodium intake group (100 to < 1000 mg/d) often had > 100% of ingested sodium excreted. The > 100% sodium excretion found in some studies may reflect a lack of adherence to the lower dietary sodium or cyclic variations in sodium excretion. It is also possible that, because of a large recent reduction of sodium intake as part of some trials, the participants had not yet achieved a steady state of sodium excretion relative to intake. In our subgroup analysis examining the length of steady state at lower sodium intake levels, it was unclear whether longer durations are needed to reach steady state. Previous studies examining less substantive changes in intake of sodium indicate approximately 3 days are required to reach a steady state for the study groups’ average sodium excretion.21, 54, 55 In our subgroup meta‐analyses, of all levels of dietary sodium, steady state diets longer than 3 days did not alter the percentage of dietary sodium excreted.
An important limitation of this study is the generalizability of findings. The focus on strict dietary protocols to ensure metabolic steady state may not represent participants who do have varying dietary protocols (eg, substantive short‐term change in sodium intake). Likewise, individuals with acute health problems, rigorous physical activity, short‐term exposure to high temperature, drug therapies that affect sodium excretion, or chronic kidney disease may excrete different percentages of sodium.5, 63 Therefore, 24‐hour urine sodium measurements during acute dietary transition, acute changes in physical activity, large temperature changes, or illness may not be able to accurately define sodium intake level.
5. CONCLUSION
The current meta‐analysis found that approximately 93% of dietary sodium is excreted in urine. The primary and subgroup analyses had substantive heterogeneity that may in part be explained by a general lack of quality control in assessing dietary intake of sodium and the completeness of 24‐hour urine collections. Nevertheless, the average percentage excretion of each subgroup analysis was close to 93% providing strong support for using 24‐hour urine collections to assess average dietary sodium intake (while accounting for the loss of approximately 7% of dietary sodium). It is noteworthy though that diet usually changes meal to meal and day to day; therefore, to determine a person's usual salt intake, multiple 24‐hour urine samples are required.
DISCLAIMER
The findings and conclusions expressed in this article are those of the authors and do not necessarily represent the official position of the Centers for Disease Control and Prevention.
CONFLICT OF INTEREST
FJH is a member of Consensus Action on Salt & Health (CASH) and World Action on Salt & Health (WASH). Both CASH and WASH are nonprofit charitable organizations and FJH does not receive any financial support from CASH or WASH. GAM is chairman of Blood Pressure UK (BPUK), chairman of CASH, WASH, and Action on Sugar (AoS). BPUK, CASH, WASH, and AoS are nonprofit charitable organizations. GAM does not receive any financial support from any of these organizations. NRCC was a paid consultant to the Novartis Foundation to support their program to improve hypertension control in cities of low to middle income countries, which includes travel support for site visits and a contract to develop a survey (2016‐2017). NRCC has provided paid consultative advice on accurate blood pressure assessment to Midway Corporation (2017) and is an unpaid member of World Action on Salt and Health (WASH). MW is a consultant to Amgen. RM has no conflicts of interest to declare.
Supporting information
ACKNOWLEDGMENTS
The authors would like to acknowledge the contributions of Ms. Helen Robertson in developing the search terms used in this project, as well as Ms. Jane Liang, Drs. Tyler Williamson, and Paul Ronksley for their consultation on the statistical analysis. Member organizations of the TRUE consortium include the American Heart Association, British and Irish Hypertension Society, Chinese Regional Office of the World Hypertension League, Hypertension Canada, International Council of Cardiovascular Prevention and Rehabilitation, International Society of Hypertension, International Society of Nephrology, Journal of Clinical Hypertension, Pan American Health Organization/World Health Organization Technical Advisory Group on Cardiovascular Diseases Prevention Through Population Wide Dietary Salt Reduction, World Hypertension League, World Stroke Organization.
Lucko AM, Doktorchik C, Woodward M, et al.; for the TRUE Consortium . Percentage of ingested sodium excreted in 24‐hour urine collections: A systematic review and meta‐analysis. J Clin Hypertens. 2018;20:1220–1229. 10.1111/jch.13353
REFERENCES
- 1. GBD 2015 Risk Factors Collaborators . Global, regional, and national comparative risk assessment of 79 behavioral, environmental and occupational, and metabolic risks or clusters of risks, 1990‐2015: a systematic analysis for the Global Burden of Disease Study 2015. Lancet 2016. 388(10053): 1659‐1724. [DOI] [PMC free article] [PubMed] [Google Scholar]
- 2. Campbell NRC, Lackland DT, Niebylski ML, et al. 2016 Dietary salt fact sheet and call to action: The World Hypertension League, International Society of Hypertension, and the International Council of Cardiovascular Prevention and Rehabilitation. J Clin Hypertens (Greenwich). 2016;18(11):1082‐1085. [DOI] [PMC free article] [PubMed] [Google Scholar]
- 3. Campbell NR, Khalsa T, Lackland DT, et al. High Blood Pressure 2016: Why Prevention and Control Are Urgent and Important. The World Hypertension League, International Society of Hypertension, World Stroke Organization, International Diabetes Foundation, International Council of Cardiovascular Prevention and Rehabilitation. J Clin Hypertens (Greenwich). 2016;18(8):714‐717. [DOI] [PMC free article] [PubMed] [Google Scholar]
- 4. World Health Organization . Salt Reduction: Fact Sheet [updated June 2016; cited February 2017]. Available from: http://www.who.int/mediacentre/factsheets/fs393/en/. Accessed July 11, 2018.
- 5. Cogswell M, Maalouf J, Elliott P, Loria CM, Patel S, Bowman B. Use of urine biomarkers to assess sodium intake: challenges and opportunities. Annu Rev Nutri. 2015;35:349‐387. [DOI] [PMC free article] [PubMed] [Google Scholar]
- 6. TRUE Consortium (inTernational consoRtium for qUality resEarch on dietary sodium/salt) . Recommended standards for assessing blood pressure in human research where blood pressure or hypertension is a major focus. J Clin Hypertens (Greenwich). 2017;19(2):108‐113. [DOI] [PMC free article] [PubMed] [Google Scholar]
- 7. Campbell NRC, Appel LJ, Cappuccio FP, et al. A call for quality research on salt intake and health : from the World Hypertension League and Supporting Organizations. J Clin Hypertens (Greenwich). 2014;16(7):469‐471. [DOI] [PMC free article] [PubMed] [Google Scholar]
- 8. Higgins J, Altman D, Gotzsche P, Juni P, Moher D, Oxman A. The Cochrane Collaboration's Tool for assessing risk of bias in randomized trials. BMJ. 2011;343:1‐9. [DOI] [PMC free article] [PubMed] [Google Scholar]
- 9. Mueller PW, Hall WD, Caudill SP, MacNeil ML, Arepally A. An in‐depth examination of the excretion of albumin and other sensitive markers of renal damage in mild hypertension. Am J Hypertens. 1995;8(11):1072‐1082. [DOI] [PubMed] [Google Scholar]
- 10. Parfrey PS, Markandu ND, Roulston JE, Jones BE, Jones JC, MacGregor GA. Relation between arterial pressure, dietary sodium intake, and renin system in essential hypertension. Br Med J (Clin Res Ed). 1981;283(6284):94‐97. [DOI] [PMC free article] [PubMed] [Google Scholar]
- 11. Campbell NC, Correa‐Rotter R, Cappuccio F, et al. Proposed Nomenclature for Salt Intake and for Reductions in Dietary Salt. J Clin Hypertens (Greenwich). 2015;17(4):247‐251. [DOI] [PMC free article] [PubMed] [Google Scholar]
- 12. Thompson FE, Kirkpatrick SI, Subar AF, et al. The National Cancer Institute's dietary assessment primer: a resource for diet research. J Acad Nutr Diet. 2015;115(12):1986‐1995. [DOI] [PMC free article] [PubMed] [Google Scholar]
- 13. Lampe JW, Huang Y, Neuhouser ML, et al. Dietary biomarker evaluation in a controlled feeding study in women from the Women's Health Initiative cohort. Am J Clin Nutr. 2017;105:466‐475. [DOI] [PMC free article] [PubMed] [Google Scholar]
- 14. John KA, Cogswell ME, Campbell NR, Nowson CA, Diet DN. Accuracy and usefulness of select methods for assessing complete collection of 24‐hour urine: a systematic review. J Clin Hypertens (Greenwich). 2015;18(5):456‐467. [DOI] [PMC free article] [PubMed] [Google Scholar]
- 15. Allsopp AJ, Sutherland R, Wood P, Wootton SA. The effect of sodium balance on sweat sodium secretion and plasma aldosterone concentration. Eur J Appl Physiol. 1998;78(6):516‐521. [DOI] [PubMed] [Google Scholar]
- 16. Armstrong LE, Costill DL, Fink WJ. Effects of dietary sodium on body and muscle potassium content during heat acclimation. Eur J Appl Physiol. 1985;54(4):391‐397. [DOI] [PubMed] [Google Scholar]
- 17. Birukov A, Rakova N, Lerchl K, et al. Ultra‐long‐term human salt balance studies reveal interrelations between sodium, potassium, and chloride intake and excretion. Am J Clin Nutr. 2016;104(1):49‐57. [DOI] [PMC free article] [PubMed] [Google Scholar]
- 18. Sanchez‐Castillo CP, Branch WJ, James WPT. A test of the validity of the lithium‐marker technique for monitoring dietary sources of salt in man. Clin Sci. 1987;72(1):87‐94. [DOI] [PubMed] [Google Scholar]
- 19. Breslau NA, Pak CY. Lack of effect of salt intake on urinary uric acid excretion. J Urol. 1983;129(3):531‐532. [DOI] [PubMed] [Google Scholar]
- 20. Buckley M, Markandu N, Sagnella G, MacGregor G. Brain and atrial natriuretic peptides: a dual peptide system of potential importance in sodium balance and blood pressure regulation in patients with essential hypertension. J Hypertens. 1994;12:809‐813. [PubMed] [Google Scholar]
- 21. Shore AC, Markandu ND, MacGregor GA. A randomized crossover study to compare the blood pressure response to sodium loading with and without chloride in patients with essential hypertension. J Hypertens. 1988;6(8):613‐617. [DOI] [PubMed] [Google Scholar]
- 22. Chan TY, Critchley JA, Ho CS, Chan JC, Tomlinson B. Urinary dopamine and noradrenaline outputs during oral salt loading in healthy Chinese subjects with a family history of hypertension. J Auton Pharmacol. 1996;16(1):1‐6. [DOI] [PubMed] [Google Scholar]
- 23. Heer M, Drummer C, Baisch F, Gerzer R. Long‐term elevations of dietary sodium produce parallel increases in the renal excretion of urodilatin and sodium. Pflugers Arch. 1993;425(5–6):390‐394. [DOI] [PubMed] [Google Scholar]
- 24. Herrin JR, Rubright WC, Squier CA, et al. Local and systemic effects of orally applied sodium salts. J Am Dent Assoc. 1986;113(4):607‐611. [DOI] [PubMed] [Google Scholar]
- 25. Manitius J, Kliz J, Krupa‐Wojciechowska B. The effect of dietary sodium loading on the kinetics of sodium excretion and blood pressure regulation in essential hypertensive men. Cor Vasa. 1985;27(1):29‐35. [PubMed] [Google Scholar]
- 26. McKnight JA, Roberts G, Sheridan B, Atkinson AB. The effect of low and high sodium diets on plasma atrial Atkinson AB. The effect of low and high sodium diets on plasma atrial natriuretic factor, the renin‐aldosterone system and blood pressure in subjects with essential hypertension. Clin Endocrinol. 1994;40(1):73‐77. [DOI] [PubMed] [Google Scholar]
- 27. Sakhaee K, Harvey JA, Padalino PK, Whitson P, Pak CY. The potential role of salt abuse on the risk for kidney stone formation. J Urol. 1993;150(2 Pt 1):310‐312. [DOI] [PubMed] [Google Scholar]
- 28. Luft FC, Fineberg NS, Sloan RS. Estimating dietary sodium intake in individuals receiving a randomly fluctuating intake. Hypertension. 1982;4(6):805‐808. [DOI] [PubMed] [Google Scholar]
- 29. Dahl WJ, Whiting SJ, Stephen AM. Dietary lentils and calcium balance in adult men. Nutr Res. 1995;15(11):1587‐1598. [Google Scholar]
- 30. Vaughan LA, Manore MM, Russo ME, Swart A, Carroll SS, Felicetta JV. Blood pressure responses of mild hypertensive caucasian males to a metabolic diet with moderate sodium and two levels of dietary calcium. Nutr Res. 1997;17(2):215‐229. [Google Scholar]
- 31. Akita S, Sacks FM, Svetkey LP, Conlin PR, Kimura G, Group DA‐STCR . Effects of the Dietary Approaches to Stop Hypertension (DASH) diet on the pressure‐natriuresis relationship. Hypertension. 2003;42(1):8‐13. [DOI] [PubMed] [Google Scholar]
- 32. Evans CE, Chughtai AY, Blumsohn A, Giles M, Eastell R. The effect of dietary sodium on calcium metabolism in premenopausal and postmenopausal women. Eur J Clin Nutr. 1997;51(6):394‐399. [DOI] [PubMed] [Google Scholar]
- 33. Feng W, Cai Q, Yuan W, et al. Low response of renin‐angiotensin system to sodium intake intervention in Chinese hypertensive patients. Medicine (Baltimore). 2016;95(6):e2602. [DOI] [PMC free article] [PubMed] [Google Scholar]
- 34. Gijsbers L, Dower JI, Mensink M, Siebelink E, Bakker SJ, Geleijnse JM. Effects of sodium and potassium supplementation on blood pressure and arterial stiffness: a fully controlled dietary intervention study. J Hum Hypertens. 2015;29(10):592‐598. [DOI] [PubMed] [Google Scholar]
- 35. Gill JR Jr, Gullner G, Lake CR, Lakatua DJ, Lan G. Plasma and urinary catecholamines in salt‐sensitive idiopathic hypertension. Hypertension. 1988;11(4):312‐319. [DOI] [PubMed] [Google Scholar]
- 36. Imafuku T, Ogawa Z, Itoh H, Suzuki H, Saruta T. Na+, K(+)‐ATPase inhibitory activity of fractionated urine during changes in dietary sodium intake in man. Endocrinol Jpn. 1990;37(1):39‐46. [DOI] [PubMed] [Google Scholar]
- 37. Kawano Y, Abe H, Kojima S, Takishita S, Matsuoka H. Effects of repeated alcohol intake on blood pressure and sodium balance in Japanese males with hypertension. Hypertens Res. 2004;27(3):167‐172. [DOI] [PubMed] [Google Scholar]
- 38. Keane P, Burgess E, Watanabe M, Wong T. Plasma sodium‐potassium ATPase inhibition activity in low‐ and normal‐renin hypertension. Am J Hypertens. 1991;4(1 Pt 1):9‐13. [DOI] [PubMed] [Google Scholar]
- 39. Lawton W, Sinkey C, Fitz A, Mark AL. Dietary salt produces abnormal renal vasoconstrictor responses to upright posture in borderline hypertensive subjects. Hypertension. 1988;11(6):529‐536. [DOI] [PubMed] [Google Scholar]
- 40. Luft FC, Fineberg NS, Sloan RS, Hunt JN. The effect of dietary sodium and protein on urine volume and water intake. J Lab Clin Med. 1983;101(4):605‐610. [PubMed] [Google Scholar]
- 41. Ogihara T, Hara H, Shima J, Iinuma K, Kumahara Y. Changes in the plasma hANP level during long‐term salt loading in patient with essential hypertension. Clin Exp Hypertens. 1988;10(1):105‐117. [DOI] [PubMed] [Google Scholar]
- 42. Overlack A, Ruppert M, Kolloch R, et al. Divergent hemodynamic and hormonal responses to varying salt intake in normotensive subjects. Hypertension. 1993;22(3):331‐339. [DOI] [PubMed] [Google Scholar]
- 43. Roos JC, Koomans HA, Delawi IMK. Renal sodium handling in normal humans subjected to low, normal, and extremely high sodium supplies. Am J Physiol. 1985;249(6):941‐947. [DOI] [PubMed] [Google Scholar]
- 44. Sagnella GA, Markandu ND, Buckley MG, Miller MA, Singer DR, MacGregor GA. Hormonal responses to gradual changes in dietary sodium intake in humans. Am J Physiol. 1989;256(6 Pt 2):R1171‐R1175. [DOI] [PubMed] [Google Scholar]
- 45. Schwartz GL, Turner ST, Sing CF. Twenty‐four‐hour blood pressure profiles in normotensive sons of hypertensive parents. Hypertension. 1992;20:834‐841. [DOI] [PubMed] [Google Scholar]
- 46. Sharma AM, Arntz H, Kribben A, Schattenfroh S, Distler A. Klinische schrift dietary sodium restriction: adverse effect on plasma lipids. Klin Wochenschr. 1990;68:664‐668. [DOI] [PubMed] [Google Scholar]
- 47. Shore AC, Markandu ND, Sagnella GA, et al. Endocrine and renal response to water loading and water restriction in normal man. Clin Sci. 1988;75(2):171‐177. [DOI] [PubMed] [Google Scholar]
- 48. Sowers JR, Zemel MB, Zemel P, Beck FW, Walsh MF, Zawada ET. Salt sensitivity in blacks. Salt intake and natriuretic substances. Hypertension. 1988;12(5):485‐490. [DOI] [PubMed] [Google Scholar]
- 49. van Buren M, Rabelink AJ, Bijlsma JA, Koomans HA. Natriuretic and kaliuretic response to potassium load: modulation by sodium intake. Nephrol Dial Transplant. 1993;8(6):495‐500. [DOI] [PubMed] [Google Scholar]
- 50. van Buren M, Rabelink TJ, van Rijn HJ, Koomans HA. Effects of acute NaCl, KCl and KHCO3 loads on renal electrolyte excretion in humans. Clin Sci. 1992;83(5):567‐574. [DOI] [PubMed] [Google Scholar]
- 51. Yamakawa H, Suzuki H, Nakamura M, Ohno Y, Saruta T. Disturbed calcium metabolism in offspring of hypertensive parents. Hypertension. 1992;19(6):528‐534. [DOI] [PubMed] [Google Scholar]
- 52. Holbrook JT, Douglas LW, Smith JC, Patterson Y, Bodner JE, Kelsay JL. Sodium and potassium intake and balance in adults consuming self‐selected diets1 2. Am J Clin Nutr. 1984;40(4):786‐793. [DOI] [PubMed] [Google Scholar]
- 53. Schachter J, Harper PH, Radin ME, Caggiula AW, McDonald RH, Diven WF. Comparison of sodium and potassium intake with excretion. Hypertens. 1980;2(5):695‐699. [DOI] [PubMed] [Google Scholar]
- 54. Sagnella GA, Markandu ND, Singer DRJ, Macgregor GA. Kinetics of renal sodium excretion during changes in dietary sodium intake in man ‐ an exponential process? Clin Exp Hypertens 1990;12(2):171‐178. [DOI] [PubMed] [Google Scholar]
- 55. Weaver C, Martin B, McCabe G, et al. Individual variation in urinary sodium excretion among adolescent girls on a fixed intake. J Hypertens. 2016;34(7):1290‐1297. [DOI] [PubMed] [Google Scholar]
- 56. Cogswell ME, Elliott P, Wang C, Rhodes DG, Pfeiffer CM, Loria CM. Assessing U S. sodium intake through dietary data and urine biomarkers. Adv Nutr 2013;4:560‐562. [DOI] [PMC free article] [PubMed] [Google Scholar]
- 57. Rhodes DG, Murayi T, Clemens JC, Baer DJ, Sebastian RS, Moshfegh AJ. The USDA Automated Multiple‐Pass Method accurately assesses population sodium intakes. Am J Clin Nutr. 2013;97(5):958‐964. [DOI] [PubMed] [Google Scholar]
- 58. John KA, Cogswell ME, Campbell NR, et al. Accuracy and usefulness of select methods for assessing complete collection of 24‐hour urine: a systematic review. J Clin Hypertens (Greenwich). 2016;18(5):456‐467. [DOI] [PMC free article] [PubMed] [Google Scholar]
- 59. Wielgosz A, Robinson C, Mao Y, et al. The impact of using different methods to assess completeness of 24‐hour urine collection on estimating dietary sodium. J Clin Hypertens (Greenwich). 2016;18(6):581‐584. [DOI] [PMC free article] [PubMed] [Google Scholar]
- 60. Armanini D, Bordin L, Andrisani A, Ambrosini G, Dona G, Sabbadin C. Considerations for the assessment of salt intake by urinary sodium excretion in hypertensive patients. J Clin Hypertens (Greenwich). 2016;18(11):1143‐1145. [DOI] [PMC free article] [PubMed] [Google Scholar]
- 61. Baldo MP, Rodrigues SL, Mill JG. High salt intake as a multifaceted cardiovascular disease: new support from cellular and molecular evidence. Heart Fail Rev. 2015;20(4):461‐474. [DOI] [PubMed] [Google Scholar]
- 62. Titze J, Muller DN, Luft FC. Taking another “look” at sodium. Can J Cardiol. 2014;30(5):473‐475. [DOI] [PubMed] [Google Scholar]
- 63. Sterns RH. Disorders of plasma sodium–causes, consequences, and correction. N Engl J Med. 2015;372(1):55‐65. [DOI] [PubMed] [Google Scholar]
- 64. Panel on Dietary Reference Intakes for Electrolytes, Water, and Ions, Standing Committee on the Scientific Evaluation of Dietary Reference Intakes . Dietary Reference Intakes for Water, Potassium, Sodium, Chloride and Sulfate. Scientific Evaluation of Dietary Reference;2004:1‐640. [Google Scholar]
- 65. Kojima S, Kawano Y, Abe H, et al. Acute effects of alcohol ingestion on blood pressure and erythrocyte sodium concentration. J Hypertens. 1993;11:185‐190. [DOI] [PubMed] [Google Scholar]
Associated Data
This section collects any data citations, data availability statements, or supplementary materials included in this article.
Supplementary Materials