

Abstract
We examine the joint association of weight status and leisure‐time physical activity on high blood pressure in a nationally representative sample of adults and older adults in Brazil. This was a national cross‐sectional survey conducted in Brazil in 2013 (Brazilian Health Survey). The sample consisted of 59 402 participants (56% women, aged 18 to 100 years). Outcome was objectively assessed blood pressure. Body mass index (BMI) was objectively measured, while self‐reported information on leisure‐time physical activity, TV viewing, chronological age, race, educational status, tobacco smoking, sodium consumption, and hypertension medication was obtained using questionnaires. Logistic regression analysis with adjusted odds ratio was conducted to test the joint association of BMI and leisure‐time physical activity categories on high blood pressure. Overall, compared to normal weight (NW) and physically active group, the NW/inactive (OR = 1.28; 1.04 to 1.58), overweight/active (OR = 1.38; 1.08 to 1.78), overweight/inactive (OR = 1.89; 1.53 to 2.33), obese/active (OR = 2.19; 1.59 to 3.01) and obese/inactive (OR = 2.54; 2.05 to 3.15) groups were 28% to 254% more likely to have high blood pressure. The attenuation and high blood pressure was greater for women and adults than for men and older adults. Thus, leisure‐time physical inactivity and being overweight and obesity were associated with high blood pressure in Brazilian population. Engaging in sufficient level of physical activity during leisure could attenuate, but not eliminate, the negative influence of obesity on high blood pressure in Brazilian adults and older adults.
Keywords: hypertension, non‐communicable disease, obesity, physical inactivity, risk factors
1. INTRODUCTION
The epidemiological transition, characterized by economic, industrial, technological, and social change in many developing countries1, 2 has made chronic disease the main cause of death in not only developing countries, but also worldwide.3 Hypertension is one of the most prevalent chronic diseases and one of the 10 most common causes of death.4, 5 Due to its multiple etiologic pathways to morbidity and mortality (eg, through its association with many chronic diseases such as chronic kidney disease, ischemic heart disease, cerebrovascular diseases, and others),5 hypertension has remained a significant contributor to the global burden of disease. Because of this, a public health effort targeting effective interventions to control and reduce population prevalence of hypertension and its risk factors is an important global health priority.
There are several risk factors of hypertension, ranging from lifestyle behaviors (eg, physical inactivity, unhealthy diets, tobacco smoking, and alcohol use) to biological factors such as unhealthy body weight status and the ageing process.6, 7 Of these risk factors, obesity and physical inactivity are strongly associated with hypertension.7, 8, 9 Obesity activates systemic inflammation, oxidative stress, the renin‐angiotensin‐aldosterone system, and sympathetic nervous systems, and consequently, potentiates endothelial dysfunction, and vascular hypertrophy.7, 8 On the other hand, sufficient physical activity can protect against hypertension and obesity,9 possibly through the energy expenditure pathway and its positive influence on autonomic nervous system.10 Moreover, there is assumption that even with a high body fat percentage, physically active patients could be protected against chronic diseases, including hypertension,11, 12 especially through the positive influence of physical activity on physical fitness (fat but fit paradox).13
Ortega and colleagues14 in a recent editorial summarized concerns regarding the “state of the art” of the called “fat but fit paradox.” Among the gaps related to this paradox is the lack of evidence on its demographic distribution in the general population. For example, it is unclear if physical activity has greater protection against the negative influence of body adiposity on chronic diseases in men than women or in adults than older adults. Also, there is dearth of evidence on the relative effects of physical activity and weight status (overweight and obesity) on high blood pressure of population in the developing countries. Understanding the relative and joint influence of physical activity and weight status on blood pressure status of population subgroups in developing countries could contribute to effective evidence‐based intervention to prevent and control the global pandemics of hypertension and its associated chronic diseases. Thus, our aim was to examine the joint association of weight status and leisure‐time physical activity on high blood pressure, according to sex and age groups in a nationally representative sample of Brazilian adults and older adults.
2. METHODS
2.1. Sample
The participants consist of a representative sample of adults (18 to 64 years old) and older adults (65 to 100 years) in a cross‐sectional survey (Brazilian National Health Survey) conducted in 2013 in Brazil. Sampling process was conducted in clusters. First, census tracts were randomly selected; after this, households were randomly selected; finally, in the households, 1 adult (18 years or older) was randomly selected. The minimum sample size per federal unit was 1800 households. Interviews as well as anthropometric and blood pressure assessment (by home visits) were conducted in a total of 64 348 households. Due to mussing data, the final sample for this study was 59 402 participants. To guarantee that all population have equal chance of been selected into the national survey, the sample estimates were weighted and calculated considering the size of the household (interviewed patients), the geographical locality and age‐group.15 The sampling calculation was adjusted for nonresponse by sex and total population by sex and age, and counting the number per household. More details of the sample process and weighting has been previously published.16
2.2. Weight status
Body mass index (BMI) was adopted as weight status indicator. Stature and weight were measured using a portable stadiometer (Sanny‐ES 2040; precision: 0.1 cm), and a portable electronic weighing‐machine (JOYCARE‐JC‐320; precision: 0.1 kg), respectively. Trained staffs collected all measures. For categorization, we adopted the WHO criteria,17 as follow: normal weight (BMI between 18.5 and 24.99); overweight (BMI between 25.0 and 29.99); and obesity (BMI ≥30.0).
2.3. Leisure‐time physical activity
Leisure‐time physical activity was assessed through 3 subjective questions. First, the patients were asked if they had practiced any sport or physical activity in the previous 3 months with the question: “Have you practiced any sport and/or activity in the last 3 months?” The answers were: “Yes” and “No.” Next, the frequency of practice was established with the question: “How many days a week do you practice sports or physical exercise?” Finally, the participants were asked about the duration of this practice with the question: “In general, on the day that you practice sports and/or physical exercise, how many hours/minutes does it take?” We classified leisure‐time physical activity into 2 categories, 0 = physically inactive (<150 min/wk) and 1 = physically active (≥150 min/wk). Leisure‐time physical activity is the most reliable domain of physical activity among Brazilians on the IPAQ (the questionnaire from which questions of the current survey was derived).18
2.4. Blood pressure
The measurement of blood pressure was performed by a trained assessor using calibrated digital equipment (TECH® model MA 100). Patients started by resting for 10 minutes, after which 3 measurements were taken. Prior to these measurements, all the patients were instructed to empty their bladders and to not smoke or drink at least 30‐minutes before the measurement. The measurements were done with the patient in a seated position and on the upper right arm (brachial). The average between the second and third measurement was used as the reference value for the present study. Blood pressure value of >140/90 mm Hg was considered as high blood pressure.5
2.5. Covariates
Chronological age was collected in a continuous manner and categorized into: adults (18 to 64.9 years) and older adults (≥65 years). Educational status was collected through the question: “What is your highest academic qualification?” Responses were placed into 1 of 3 categories: (1) without formal education (no academic degree), (2) at least high school, and (3) at least college. Race was self‐reported and dichotomized as “white” or “not white (other races).” Tobacco smoking was evaluated through the question: “Do you use any tobacco product?” Answers were “yes, daily”; “yes, but not daily”; and “no.” We considered those who answered “yes, daily” and “yes, but not daily” as having this exposure. With regards to sodium consumption, the patients were asked whether they perceived their diet as containing salt. Response was based on a 5‐point Likert scale, ranging from “a little” to “a lot” of salt. Diets containing “quite a lot” and “a lot” were considered as indicative of high sodium consumption. Sugar consumption was accessed through the weekly frequency of eating processed food/snacks/sweets. More than 3 times a week was considered as high consumption. Moreover, patients were asked if they used any antihypertensive medication during the previous 2 weeks. Responses were treated as dichotomous variables (no or yes).
In addition to demographic covariates, we also collected self‐reported information on previous diagnosis of type 2 diabetes and heart disease. Diabetes data were measured with the question: “Has a physician already given you a diagnosis of diabetes?” The answers were: “Yes,” “No,” and “During gestation.” We considered a diagnosis of diabetes from those who responded “Yes.” Heart disease was evaluated through the question: “Has a physician already given you a diagnosis of heart disease, such as heart attack, angina, heart failure or another?” The answers were: “Yes” or “No.” We considered individuals who answered “Yes” as having a heart disease.
2.6. Statistical procedures
To describe the sample, we used values of frequencies and 95% confidence intervals (95% CI). To describe and compare blood pressure values by weight status (overweight and obese) and physical activity categories according to sex and age group, we used means and 95% confidence intervals. In the main analysis, logistic regression with adjusted odds ratio (95% CI) was conducted to test the joint association of weight status and leisure‐time physical activity categories on high blood pressure. Also, logistic regressions were computed separately for women and men, and for adults and older adults. Sex (in the total sample and age stratified analysis), chronological age, race, educational status, sodium consumption, sugar consumption, anti‐hypertensive drugs consumption, tobacco smoking, TV‐viewing, and diagnoses of type 2 diabetes and heart disease were the covariates adjusted in the regression analysis. Statistical and meaningful differences were determined when 95% CI does not contain the value 1, and when the 95% CIs of 2 comparison groups do not overlap.19, 20 All analyses were conducted adjusting for sampling weights (svy command) in STATA 14.0.
3. RESULTS
A total of 59 402 patients, adults (n = 51 690) and older adults (n = 7712), comprising of 56% women participated in the study. Characteristics of the sample according to sex are described in Table 1. Male adults had higher prevalence of sufficient leisure‐time physical activity, overweight, and high blood pressure compared to women. On the other hand, women presented higher prevalence of obesity and greater than 2 hours of TV‐viewing. The mean age was 42.3 years (95% CI: 41.9 years to 42.7 years) for men and 43.8 years (95% CI: 43.5 years to 44.1 years) for women. The mean BMI was 25.9 (95% CI: 25.8 to 26.1) kg/m2 for men and 26.5 (95% CI: 26.3 to 26.7) kg/m2 for women. While the mean systolic blood pressure was 125.9 (95% CI: 125.4 to 126.5) mm Hg for men and 120.6 (95% CI: 119.9 to 121.3) mm Hg for women, the mean diastolic blood pressure was 78.7 (95% CI: 78.4 to 79.1) mm Hg for men and 75.7 (95% CI: 75.3 to 76.1) mm Hg for women.
Table 1.
Characteristics of the sample according to sex
| Male % (95% CI) (n = 25 920) | Female % (95% CI) (n = 33 482) | |
|---|---|---|
| Age group | ||
| 18‐64 y | 88.6 (87.9‐89.2) | 86.7 (86.1‐87.3) |
| ≥65 y | 11.4 (10.8‐12.1) | 13.3 (12.7‐13.9) |
| Educational status | ||
| No academic qualification | 15.2 (14.4‐15.9) | 16.1 (15.4‐16.8) |
| High school | 71.7 (70.8‐72.7) | 68.9 (68.0‐69.7) |
| More than high school | 13.1 (12.4‐13.8) | 15.0 (14.3‐15.7) |
| Skin color | ||
| White | 46.8 (45.7‐47.9) | 48.0 (47.1‐49.0) |
| Other | 53.2 (52.1‐54.3) | 52.0 (51.0‐53.0) |
| Leisure PA | ||
| Inactive | 82.3 (81.5‐83.2) | 85.6 (84.9‐86.3) |
| Active | 17.7 (16.8‐18.5) | 14.4 (13.7‐15.1) |
| Sodium consumption | ||
| Normal | 83.9 (83.1‐84.7) | 87.5 (86.9‐88.1) |
| High | 16.1 (15.3‐16.9) | 12.5 (11.9‐13.1) |
| Sugar consumption | ||
| Normal | 78.7 (77.8‐79.5) | 71.1 (70.3‐71.9) |
| High | 21.3 (20.5‐22.2) | 28.9 (28.1‐29.7) |
| Anti‐hypertensive drugs | ||
| No | 86.0 (85.2‐86.7) | 79.2 (78.4‐80.0) |
| Yes | 14.0 (13.3‐14.8) | 20.8 (20.0‐21.6) |
| Tobacco smoking | ||
| No | 81.1 (80.3‐82.0) | 89.0 (88.4‐89.6) |
| Yes | 18.9 (18.0‐19.7) | 11.0 (10.4‐11.6) |
| TV view | ||
| <2 h | 51.8 (50.7‐52.9) | 45.6 (44.6‐46.5) |
| 2‐4 h | 25.5 (34.5‐36.6) | 36.9 (36.0‐37.8) |
| >4 h | 12.7 (12.0‐13.4) | 17.5 (16.8‐18.3) |
| Body mass index | ||
| Normal weight | 43.8 (42.5‐45.0) | 48.0 (46.8‐49.2) |
| Overweight | 39.4 (38.1‐40.6) | 31.5 (30.4‐32.6) |
| Obese | 16.9 (16.0‐17.8) | 20.5 (19.5‐21.5) |
| High systolic blood pressure | ||
| No | 80.2 (79.3‐81.1) | 81.9 (81.1‐82.6) |
| Yes | 19.8 (18.9‐20.7) | 18.1 (17.7‐18.9) |
| High diastolic blood pressure | ||
| No | 81.4 (80.5‐82.2) | 86.1 (85.4‐86.7) |
| Yes | 18.6 (17.7‐19.5) | 13.9 (13.3‐14.6) |
| High blood pressure | ||
| No | 73.2 (72.2‐74.1) | 77.8 (77.1‐78.6) |
| Yes | 26.8 (25.9‐27.8) | 22.2 (21.4‐22.9) |
CI, confidence interval; PA, physical activity; TV, television.
Patterns of diastolic and systolic blood pressure according to weight status and leisure‐time physical activity among men, women, adults, and older adults are described in Figure 1. In general, groups with normal weight and classified as physically active presented lower values of diastolic and systolic blood pressure. The obese group, classified as physically inactive, showed the highest values of blood pressure (systolic and diastolic) in both sexes and age groups. Differences between active and inactive women in both outcomes (diastolic and systolic blood pressure) were observed in all the weight status categories (normal weight, overweight and obese), while no differences were found among obese men. Normal weight/inactive group presented similar systolic blood pressure when compared to overweight/active group, especially among women. Obese/active women showed lower systolic and diastolic blood pressure compared to their overweight/inactive counterparts. Greater values of systolic blood pressure were observed in older adults regardless of the category. However, there is less clear pattern for diastolic blood pressure values by weight status/physical activity categories in this age group. In adults, regardless of weight status category, active patients showed lower blood pressure values. No differences were found between overweight/inactive and obese/active groups for systolic blood pressure among adults; however, the obese but active group showed lower diastolic blood pressure values.
Figure 1.
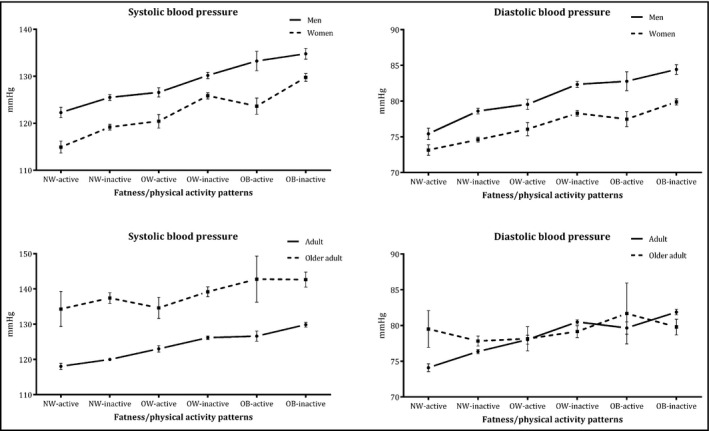
Comparison of blood pressure among weight status and physical activity categories according to sex and age groups. NW, normal weight; OW, overweight; OB, obese. Values are described with means and 95% confidence intervals. Sample sizes: Men: NW‐Active = 1985, NW‐Inactive = 9328, OW‐Active = 1871, OW‐Inactive = 8099, OB‐Active = 688, OB‐Inactive = 3630; Women: NW‐Active = 2005, NW‐Inactive = 11 876, OW‐Active = 1619, OW‐Inactive = 1619, OB‐Active = 1025, OB‐Inactive = 6913; Adults: NW‐Active = 3758, NW‐Inactive = 18 309, OW‐Active = 3194, OW‐Inactive = 15 302, OB‐Active = 1584, OB‐Inactive = 9036; Older adults: NW‐Active = 232, NW‐Inactive = 2895, OW‐Active = 296, OW‐Inactive = 2618, OB‐Active = 129, OB‐Inactive = 1507
The prevalence of high blood pressure according to the mutually exclusive categories of weight status and leisure‐time physical activity is described in Figure 2. Confirming patterns from the continuous data, an attenuation influence of leisure‐time physical activity on the positive association between overweight/obesity on high BP was observed. Physically active patients presented lower prevalence of high BP than their inactive peers with similar weight status. Lower prevalence of high BP was found among the group of normal weight classified as physically active, while greater prevalence was found among patients with obesity classified as physically inactive. No differences were observed between normal weight/inactive vs overweight/active and overweight/inactive vs obese/active groups.
Figure 2.
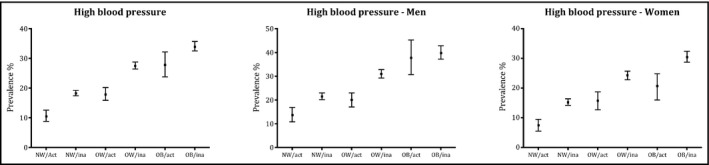
Prevalence of high blood pressure according to weight status and physical activity categories. NW, normal weight; Act, active; Ina, inactive; OW, overweight; OB, obese. Values are described with frequencies and 95% confidence intervals. Sample sizes: Total sample: NW‐Active = 3990, NW‐Inactive = 21 204, OW‐Active = 3490, OW‐Inactive = 17 920, OB‐Active = 1713, OB‐Inactive = 10 543; Men: NW‐Active = 1985, NW‐Inactive = 9328, OW‐Active = 1871, OW‐Inactive = 8099, OB‐Active = 688, OB‐Inactive = 3630; Women: NW‐Active = 2005, NW‐Inactive = 11 876, OW‐Active = 1619, OW‐Inactive = 1619, OB‐Active = 1025, OB‐Inactive = 6913
Table 2 presents the adjusted joint association between exposures categories and high blood pressure in the entire sample, by sex and age groups. Except among older adults, the obese/inactive group was more likely to present high blood pressure compared to the reference group (normal weight/active), even after adjustments for confounders. Increases in odds to higher blood pressure were observed throughout the weight status categories; however, this progression was attenuated among the physically active patients. The attenuating effect of leisure‐time physical activity was more consistent among women and adults compared to men and older adults, respectively.
Table 2.
Joint association of leisure‐time physical activity and weight status with blood pressure in overall sample (n = 59 402), by sex and age group
| Variables | Normal weight | Overweight | Obese | |||
|---|---|---|---|---|---|---|
| Active (n = 3990) | Inactive (n = 21 204) | Active (n = 3490) | Inactive (n = 17 920) | Active (n = 1713) | Inactive (n = 10 543) | |
| Total sample | ||||||
| High systolic blood pressure | 1 | 1.28 (1.01‐1.63) | 1.26 (0.95‐1.68) | 1.75 (1.38‐2.22) | 2.16 (1.50‐3.12) | 2.44 (1.91‐3.11) |
| High diastolic blood pressure | 1 | 1.38 (1.07‐1.78) | 1.50 (1.11‐2.01) | 2.16 (1.68‐2.77) | 2.13 (1.52‐3.00) | 2.81 (2.17‐3.63) |
| High blood pressure | 1 | 1.28 (1.04‐1.58) | 1.38 (1.08‐1.78) | 1.89 (1.53‐2.33) | 2.19 (1.59‐3.01) | 2.54 (2.05‐3.15) |
| Men | ||||||
| High systolic blood pressure | 1 | 1.16 (0.85‐1.60) | 1.23 (0.84‐1.79) | 1.64 (1.19‐2.26) | 2.95 (1.72‐5.07) | 2.59 (1.86‐3.61) |
| High diastolic blood pressure | 1 | 1.32 (0.95‐1.85) | 1.56 (1.06‐2.30) | 2.17 (1.56‐3.04) | 2.49 (1.55‐3.98) | 2.89 (2.05‐4.08) |
| High blood pressure | 1 | 1.12 (0.84‐1.48) | 1.27 (0.91‐1.77) | 1.75 (1.32‐2.32) | 2.71 (1.68‐4.36) | 2.50 (1.86‐3.35) |
| Women | ||||||
| High systolic blood pressure | 1 | 1.52 (1.07‐2.16) | 1.31 (0.85‐2.01) | 1.96 (1.38‐2.78) | 1.61 (1.02‐2.55) | 2.44 (1.71‐3.46) |
| High diastolic blood pressure | 1 | 1.42 (0.98‐2.05) | 1.33 (0.84‐2.10) | 2.05 (1.41‐2.98) | 1.73 (1.06‐2.80) | 2.62 (1.80‐3.83) |
| High blood pressure | 1 | 1.61 (1.19‐2.17) | 1.59 (1.10‐2.30) | 2.21 (1.63‐2.98) | 1.88 (1.26‐2.81) | 2.80 (2.07‐3.80) |
| Adults | ||||||
| High systolic blood pressure | 1 | 1.29 (0.99‐1.70) | 1.29 (0.93‐1.78) | 1.80 (1.37‐2.35) | 2.06 (1.35‐3.13) | 2.42 (1.84‐3.18) |
| High diastolic blood pressure | 1 | 1.39 (1.06‐1.83) | 1.46 (1.06‐2.02) | 2.06 (1.56‐2.71) | 1.80 (1.24‐2.63) | 2.59 (1.96‐3.44) |
| High blood pressure | 1 | 1.28 (1.02‐1.62) | 1.42 (1.07‐1.87) | 1.91 (1.51‐2.41) | 2.09 (1.46‐2.98) | 2.51 (1.97‐3.18) |
| Older adults | ||||||
| High systolic blood pressure | 1 | 1.11 (0.66‐1.86) | 0.93 (0.50‐1.86) | 1.25 (0.74‐2.09) | 2.06 (0.91‐4.68) | 1.77 (1.05‐3.01) |
| High diastolic blood pressure | 1 | 0.78 (0.43‐1.40) | 0.66 (0.30‐1.45) | 1.00 (0.56‐1.80) | 1.96 (0.81‐4.77) | 1.24 (0.67‐2.29) |
| High blood pressure | 1 | 1.06 (0.65‐1.73) | 0.87 (0.48‐1.58) | 1.29 (0.79‐2.11) | 1.95 (0.88‐4.36) | 1.72 (1.04‐2.85) |
Data are described in odds ratio (95% confidence interval). Adjusted by sex, chronological age, race, educational status, sodium consumption, sugar consumption, anti‐hypertensive drugs consumption, tobacco smoking, TV‐viewing, type 2 diabetes and heart disease.
4. DISCUSSION
Obesity, as well as physical inactivity during leisure, are recognized to have independent relationships with high blood pressure,6, 21 and the possible interdependent relationship between these exposures in predicting high blood pressure has been reported.12, 22 In the present study, we confirmed that both overweight and obesity and leisure‐time physical activity have a joint and independent relationship with high blood pressure. Also, we observed that overweight adults and obese women who are physically active had a lower prevalence of high blood pressure compared to their physically inactive counterparts for the same weight status, and even compared to normal weight/inactive and overweight/inactive groups, respectively. These findings support recent evidence that physical activity and body mass index have independent roles in predicting high blood pressure among Brazilian adolescents.23 To the best of our knowledge, this is the first evidence on the demographic patterns of joint effects of weight status and physical activity on high blood pressure of adults and older adults in a low‐and‐middle income country.
Obesity has a clear effect on blood pressure regulation.21, 24 This effect is explained by the fact that adipocytes synthesize and release several hormones (eg, adiponectin, leptin, and angiotensin) that activate the sympathetic nervous system, renin‐angiotensin‐aldosterone system, oxidative stress and systemic inflammation; leading to reductions of nitric oxide synthesis, causing endothelial dysfunction and vascular hypertrophy,7, 8, 25 which are risk factors for high blood pressure.26 Similarly, physical activity has been related to a reduction in blood pressure,9, 27 especially through its effect on reducing peripheral resistance,27 and improving the release of nitric oxide that relaxes blood vessels wall.10 As both overweight/obesity and physical inactivity can coexist and because their mechanism of action and effect on blood pressure could be synergistic, understanding the combined impacts of these behavioral and biological risk factors on hypertension is relevant to effective public health actions against chronic diseases at the population level.
We found that leisure‐time physical activity can attenuate the negative influence of overweight/obesity on high blood pressure, but not eliminate it. Possibly, the joint effects of physical activity and body weight status on high blood pressure occur through the same mechanisms of their independent effect on high blood pressure (ie, peripheral resistance, inflammation markers, nitric oxide synthesis, renin regulation and energy balance).10, 27 Looking at the demographic subgroups, we observed that the potential benefits of being active are more marked in women. In other words, meeting the recommendation of leisure‐time physical activity seems to be more important for attenuating the effect of obesity on blood pressure in women than in men. This finding can partly be explained by differences in the social patterns of leisure‐time physical activity that exist between men and women, which is especially influenced by cultural norms. Since women tend to be less physically active than men,28 it is possible that the achievement of international guidelines of 150 min/wk of leisure‐time physical activity is sufficient to confer significant health benefits against the negative influence of obesity on high blood pressure in women. Plausibly, obese men would need to perform a higher amount of leisure‐time physical activity—above the minimum recommendations—to attenuate the negative effects of obesity on blood pressure.
With regards to the age groups, we found more consistent evidence of the influence of leisure‐time physical activity in attenuating the negative effects of overweight/obesity on high blood pressure among adults (compared to older adults). This finding suggests that reinforcing or improving leisure‐time physical activity could be an important strategy for controlling overweight and high blood pressure in adults. The less consistent evidence for older adults can be explained, in part, by the fact that prevalence of other risk factors of high blood pressure is more common among older adults than adults.29 Changes in lifestyle characteristics, such as declining physical activity level and increasing obesity—risk factors to hypertension and other chronic diseases—are common in older ages.22, 30, 31 It could be that higher time in leisure‐time physical activity beyond the minimum recommendations would be required to confer greater attenuation on the negative influence of overweight/obesity on high blood pressure in older adults. However, given the cross‐sectional design nature of the present study, reverse‐causality is plausive. It could be that high blood pressure been a more prevalent condition among the older adults promotes more leisure time physical inactivity and overweight/obesity in this group than the adults.
The current findings have a clear application. The evidence suggests the relevance of improving and promoting leisure‐time physical activity to prevent or control overweight/obesity as well as high blood pressure in specific population subgroups in Brazil. Since obesity represents a complex disease, a feasible short‐term intervention should be to focus on increasing leisure‐time physical activity level to at least meeting the international guidelines of a minimum of 150 min/wk. This recommendation is important because, by being active, overweight adults could also be preventing or controlling their high blood pressure.32 This recommendation seems most important for obese women who are at higher risk of physical inactivity and hypertension. However, our data suggest that greater amounts of leisure‐time physical activity would probably be needed to attenuate the negative effects of obesity on high blood pressure among obese men and older adults.
Our study has some limitations that should be mentioned. First, our indicator of obesity was an indirect measure.21 Compared to BMI as used in the present study, indicators of central adiposity (ie waist circumference, waist‐to‐height ratio) seem to be more strongly associated with hypertension.33 Moreover, BMI is just a simple measure of weight‐for‐height and could not discriminate high‐fat percentage or be used as a proxy for nutritional status. Also, the level of physical activity was determined by a subjective measure, which is known to be prone to measurement errors. Since only leisure‐time physical activity was assessed, the influence of other domains of physical activity (eg, domestic activities or active commuting) and overall physical activity on the association of body weight status and high blood pressure could not be inferred from the present study. Although educational status (a proxy of socioeconomic status) was adjusted in our analysis, people of higher socioeconomic status in Brazil are more active during leisure and could have lower blood pressure due to greater access to health care.34 However, leisure‐time physical activity domain has a strong relationship with health outcomes and the questions used in this study, derived from IPAQ, had good evidence of validity among Brazilian adults.18 Further, since physical fitness is an important component of the “Fat but Fit Paradox,”35 the lack of information on physical fitness status of the participants is a limitation of the present study. Also, unlike direct measures such as 24‐hour urinary salt excretion, the sodium consumption question used in our study may underestimate the real sodium consumption level of the participants. Moreover, more precise measures of socioeconomic status like household income were not available in our dataset. Finally, the cross‐sectional design utilized does not allow for causal associations to be determined.
On the other hand, the strengths of the study include a large national sample (59 000) selected to be representative of the demographics (sex and age groups) of the adult population in Brazil, objective assessment of BMI and blood pressure, and a tested and valid measure of physical activity. Also, we adjusted the analysis for important confounders, including lifestyle (TV‐viewing, tobacco smoking, sodium ingestion and sugar consumption) and socio‐demographic factors (race and educational status).
5. CONCLUSIONS
In summary, physical inactivity during leisure time and overweight and obesity were independently and jointly associated with high blood pressure in the Brazilian population. Engaging in sufficient levels of physical activity during leisure‐time attenuated the negative effects of obesity on high blood pressure, especially in adults and in women. Increasing the population's level of physical activity to meet international guidelines is recommended as an effective intervention tool to help control the negative influence of overweight/obesity on high blood pressure in Brazilian adults and older adults.
CONFLICT OF INTEREST
The authors declare that they have no conflicts of interest.
6.
What is new?
We analyzed the joint association of leisure‐time physical activity and overweight/obesity in predicting high blood pressure in a national representative sample of adults and older adults in a developing country.
Engaging in sufficient level of physical activity during leisure could attenuate, but not eliminate, the negative influence of obesity on high blood pressure in the Brazilian population.
How might it impact on clinical practice in the future?
Leisure‐time physical activity should be promoted as an effective non‐invasive clinical and health promotion strategy for blood pressure control among overweight/obese individuals in Brazil.
Sex and age specific leisure‐time physical activity interventions targeting overweight/obese women and older adults should be prioritized when planning and implementing population level actions on hypertension control and management in Brazil.
ETHICS APPROVAL
All procedures performed in the original studies involving human participants were approved by national council of ethics in research (CONEP: 10853812.7.0000.0008) in accordance with the ethical standards of the institutional and/or national research committee and with the 1964 Helsinki Declaration and its later amendments or comparable ethical standards.
INFORMED CONSENT
Informed consent was obtained from all individual participants included in the study.
ACKNOWLEDGMENTS
We gratefully acknowledge the contribution of all the participants of the present research as well as the IBGE for the collection of data.
Werneck AO, Oyeyemi AL, Gerage AM, et al. Does leisure‐time physical activity attenuate or eliminate the positive association between obesity and high blood pressure?. J Clin Hypertens. 2018;20:959‐966. 10.1111/jch.13292
REFERENCES
- 1. Popkin BM, Adair LS, Ng SW. Global nutrition transition and the pandemic of obesity in developing countries. Nutr Rev. 2012;70:3‐21. [DOI] [PMC free article] [PubMed] [Google Scholar]
- 2. Katzmarzyk PT, Mason C. The physical activity transition. J Phys Act Health. 2009;6:269‐280. [DOI] [PubMed] [Google Scholar]
- 3. Global Burden of Disease (GBD) . Global, regional, and national life expectancy, all‐cause mortality, and cause‐specifi c mortality for 249 causes of death, 1980‐2015: a systematic analysis for the Global Burden of Disease Study 2015. Lancet. 2015;388:117‐171. [DOI] [PMC free article] [PubMed] [Google Scholar]
- 4. WHO . Global status report on noncommunicable diseases 2014; 2014. 298 p.
- 5. Forouzanfar MH, Liu P, Roth GA, et al. Global burden of hypertension and systolic blood pressure of at least 110 to 115 mm Hg, 1990‐2015. JAMA. 2017;317:827‐838. [DOI] [PubMed] [Google Scholar]
- 6. Maseli A, Aeschbacher S, Schoen T, et al. Healthy lifestyle and blood pressure variability in young adults. Am J Hypertens. 2017;30:690‐699. [DOI] [PubMed] [Google Scholar]
- 7. Dorresteijn JAN, Visseren FLJ, Spiering W. Mechanisms linking obesity to hypertension. Obes Rev. 2012;13:17‐26. [DOI] [PubMed] [Google Scholar]
- 8. Kotsis V, Stabouli S, Papakatsika S, Rizos Z, Parati G. Mechanisms of obesity‐induced hypertension. Hypertens Res. 2010;33:386‐393. [DOI] [PubMed] [Google Scholar]
- 9. Huai P, Xun H, Reilly KH, Wang Y, Ma W, Xi B. Physical activity and risk of hypertension a meta‐analysis of prospective cohort studies. Hypertension. 2013;62:1021‐1026. [DOI] [PubMed] [Google Scholar]
- 10. Zanesco A, Antunes E. Effects of exercise training on the cardiovascular system: pharmacological approaches. Pharmacol Ther. 2007;114:307‐317. [DOI] [PubMed] [Google Scholar]
- 11. Loprinzi PD, Frith E. Cardiometabolic healthy obesity paradigm and all‐cause mortality risk. Eur J Intern Med. 2017;43:42‐45. [DOI] [PubMed] [Google Scholar]
- 12. Loprinzi P, Smit E, Lee H, Crespo C, Andersen R, Blair SN. The “fit but fat” paradigm addressed using accelerometer‐determined physical activity data. N Am J Med Sci. 2014;6:295‐301. [DOI] [PMC free article] [PubMed] [Google Scholar]
- 13. Blair SN, Kohl HW, Paffenbarger RS, Clark DG, Cooper KH, Gibbons LW. Physical fitness and all‐cause mortality. A prospective study of healthy men and women. JAMA. 1989;262:2395‐2401. [DOI] [PubMed] [Google Scholar]
- 14. Ortega FB, Ruiz JR, Labayen I, Lavie CJ, Blair SN. The Fat but Fit paradox: what we know and don”t know about it. Br J Sports Med. 2017;52:151‐153. [DOI] [PubMed] [Google Scholar]
- 15. de Souza‐Júnior PRB, de Freitas MPS, de Antonaci GA, Szwarcwald CL. Desenho da amostra da Pesquisa Nacional de Saúde 2013. Epidemiol Serv Saúde. 2015;24:207‐216. [Google Scholar]
- 16. IBGE . Pesquisa Nacional de Saúde 2013. 2014. 181 p. Available from: ftp://ftp.ibge.gov.br/PNS/2013/pns2013.pdf. Accessed January 20, 2017.
- 17. World Health Organization . Obesity: preventing and managing the global epidemic. Report of a WHO consultation. Geneva, Switzerland: WHO Technical Report Series 894; 2000. [PubMed] [Google Scholar]
- 18. Hallal PC, Gomez LF, Parra DC, et al. Lessons learned after 10 years of IPAQ use in Brazil and Colombia. J Phys Act Health. 2010;7(suppl 2):S259‐S264. [DOI] [PubMed] [Google Scholar]
- 19. Gardner MJ, Altman DG. Statistics in Medicine Confidence intervals rather than P values: estimation rather than hypothesis testing. Br Med J (Clin Res Ed). 1986;292:746‐750. [DOI] [PMC free article] [PubMed] [Google Scholar]
- 20. du Prel J‐B, Hommel G, Röhrig B, Blettner M. Confidence interval or P‐value?: part 4 of a series on evaluation of scientific publications. Dtsch Arztebl Int. 2009;106:335‐339. [DOI] [PMC free article] [PubMed] [Google Scholar]
- 21. Gnatiuc L, Alegre‐Díaz J, Halsey J, et al. Adiposity and blood pressure in 110 000 Mexican adults. Hypertension. 2017;69:608‐614. [DOI] [PMC free article] [PubMed] [Google Scholar]
- 22. Dankel SJ, Loenneke JP, Loprinzi PD. The impact of overweight/obesity duration on the association between physical activity and cardiovascular disease risk: an application of the “fat but fit” paradigm. Int J Cardiol. 2015;201:88‐89. [DOI] [PubMed] [Google Scholar]
- 23. Christofaro DGD, Ritti‐Dias RM, Chiolero A, Fernandes RA, Casonatto J, de Oliveira AR. Physical activity is inversely associated with high blood pressure independently of overweight in Brazilian adolescents. Scand J Med Sci Sport. 2013;23:317‐322. [DOI] [PubMed] [Google Scholar]
- 24. Ostchega Y, Hughes JP, Terry A, Fakhouri THI, Miller I. Abdominal obesity, body mass index, and hypertension in US adults: NHANES 2007‐2010. Am J Hypertens. 2012;25:1271‐1278. [DOI] [PMC free article] [PubMed] [Google Scholar]
- 25. Kotsis V, Nilsson P, Grassi G, et al. New developments in the pathogenesis of obesity‐induced hypertension. J Hypertens. 2015;33:1499‐1508. [DOI] [PubMed] [Google Scholar]
- 26. Yiannikouris F, Gupte M, Putnam K, Cassis L. Adipokines and blood pressure control. Curr Opin Nephrol Hypertens. 2010;19:195‐200. [DOI] [PMC free article] [PubMed] [Google Scholar]
- 27. Kokkinos PF, Giannelou A, Manolis A, Pittaras A. Physical activity in the prevention and management of high blood pressure. Hellenic J Cardiol. 2009;50:52‐59. [PubMed] [Google Scholar]
- 28. da Silva ICM, Mielke GI, Bertoldi AD, et al. Overall and leisure‐time physical activity among Brazilian adults: national survey based on the global physical activity questionnaire. J Phys Act Health. 2018;15:212‐218. [DOI] [PubMed] [Google Scholar]
- 29. Buford TW. Hypertension and aging. Ageing Res Rev. 2016;26:96‐111. [DOI] [PMC free article] [PubMed] [Google Scholar]
- 30. Paffenbarger RS, Hyde RT, Wing AL, Lee IM, Jung DL, Kampert JB. The association of changes in physical‐activity level and other lifestyle characteristics with mortality among men. N Engl J Med. 1993;328:538‐545. [DOI] [PubMed] [Google Scholar]
- 31. Paffenbarger RS, Hyde R, Wing AL, Hsieh C. Physical activity, all‐cause mortality, and longevity of college alumni. N Engl J Med. 1986;314:605‐613. [DOI] [PubMed] [Google Scholar]
- 32. Shaw K, Gennat H, O'Rourke P, Del MC. Exercise for overweight or obesity. Cochrane Database Syst Rev. 2006;4:CD003817. [DOI] [PMC free article] [PubMed] [Google Scholar]
- 33. Lee CMY, Huxley RR, Wildman RP, Woodward M. Indices of abdominal obesity are better discriminators of cardiovascular risk factors than BMI: a meta‐analysis. J Clin Epidemiol. 2008;61:646‐653. [DOI] [PubMed] [Google Scholar]
- 34. Silva KS, Del Duca GF, Garcia LMT, et al. Barriers associated with frequency of leisure‐time physical activity among Brazilian adults of different income strata. Scand J Med Sci Sports. 2016;26:206‐213. [DOI] [PubMed] [Google Scholar]
- 35. Duncan G. The, “fit but fat” concept revisited: population‐based estimates using NHANES. Int J Behav Nutr Phys Act. 2010;7:47. [DOI] [PMC free article] [PubMed] [Google Scholar]